

Trading
Explore a wide range of markets with competitive pricing, deep liquidity, and advanced trading tools.
Learn More 
Platform
Trade seamlessly with TMGM's powerful platform, built for speed, precision, and a superior trading experience.
Learn More Trading Platform
Academy
Learn the fundamentals of trading with beginner-friendly resources, including guides, webinars, and market insights.
Learn More News & Analysis
Get real-time market updates and expert analysis to stay ahead of trading opportunities
Learn More News & Analysis
About
Learn what sets TMGM apart — our global presence, regulatory strength, and commitment to innovation in trading.
Learn More Why Choose TMGM
Sponsorship
Crypto Today: Capital outflows persist as Bitcoin falls, Ethereum and XRP trim losses
- $66,000 marks the supply zone keeping Bitcoin’s upside in check. Sellers retain control, while demand sits near $62,000.
- $1,830 is Ethereum’s approximate trading level as prices edge higher. The downtrend is easing despite $8 million in ETF outflows.
- $0.94–$0.98 defines XRP’s narrow consolidation range. Buyers are holding support, while sellers restrict advances at resistance.
$64,600 is Bitcoin’s (BTC) approximate trading level on Tuesday. Bears remain largely in command as the price moves lower for a second consecutive day. The Crypto King’s latest losses follow last week’s sharp, macro-driven sell-off to lows near $62,000.

Among major altcoins, Ethereum (ETH) and Ripple (XRP) are showing signs of price stabilisation as their downtrends ease ahead of a possible upswing. Trading around $1,830, Ethereum is holding relatively steady. XRP remains confined to a tight band between support at $0.94 and resistance at $0.98.
In an emailed analysis, Crypto Finance said: “BTC is currently trading within the $59,000-$66,000 range, with $66,000 representing the first meaningful resistance and $59,000-$60,000 the next key support,”
$69 million leaves Bitcoin ETFs; Ethereum also sees outflows
Monday brought $69 million in outflows from Bitcoin spot Exchange-Traded Funds (ETFs). The withdrawals extended a negative run that totalled $1.07 billion last week through Friday. These flows underscore the broader bearish trend and risk-averse sentiment. With ETF demand absent, Bitcoin has less support in the spot market, compounding selling pressure.

At roughly $8 million, Monday’s outflows from Ethereum spot ETFs were comparatively modest, SoSoValue data showed. US-listed ETH ETFs have faced broadly bearish conditions over recent weeks. Withdrawals have weighed on prices and hastened the decline. A possible rebound around $1,830 may prompt investors to reassess their risk exposure. Renewed demand could improve the prospects for a sustained recovery.

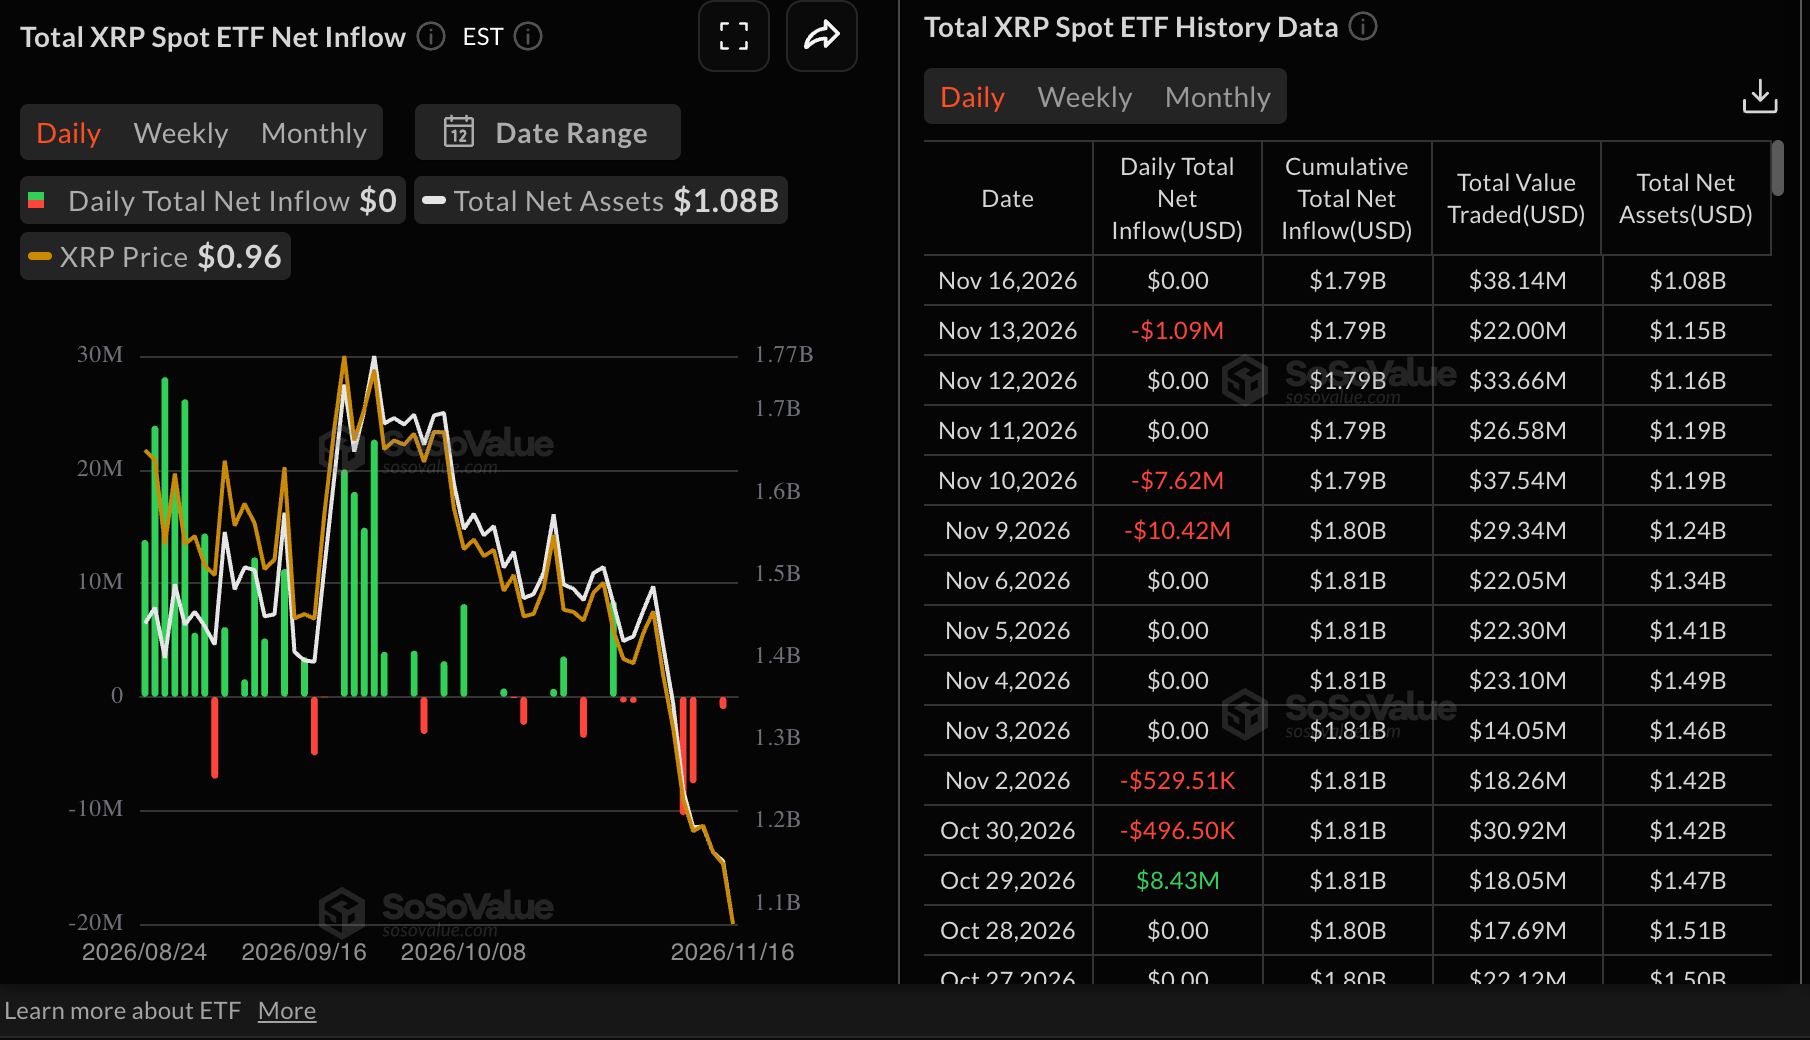
Following roughly $1 million in withdrawals last Friday, XRP spot ETFs saw subdued activity on Monday. Weaker ETF demand has reduced cumulative inflows to $1.79 billion. Net assets under management have undergone a steeper correction to $1.08 billion.
Crypto Finance also noted: “Institutional flows remain weak, with US spot BTC ETFs recording $1.07 billion in net outflows last week, extending the redemption streak to seven consecutive sessions and $1.91 billion since November 5,”
$64,613: Bitcoin’s losing run continues in technical analysis
At $64,613, Bitcoin remains in a bearish phase. The price sits well beneath both the $72,539 SuperTrend line and all key Exponential Moving Averages (EMAs). Grouped around $76,200, the 50-day, 100-day and 200-day EMAs further constrain the outlook. A negative MACD points to continuing downward pressure. Although the RSI is near 23 in oversold territory, suggesting selling may be stretched, bears still appear to hold control.
Near $72,539, the SuperTrend line provides the first resistance barrier. A stronger supply area follows at the 200-day EMA of $76,180, with the 50-day EMA at $76,219 and the 100-day EMA at $76,231 close by. The current indicators identify no nearby technical support. Attention therefore centres on whether the pair can first regain the SuperTrend line, then test the EMA cluster around $76,200. Such a move would help temper the prevailing bearish bias.
$1,831: Ethereum’s decline eases as buyers consider a return
At $1,831, Ethereum’s downtrend is losing pace. The smart contract token nevertheless retains a bearish near-term bias, trading well below the 50-day, 100-day and 200-day EMAs grouped between roughly $2,244 and $2,283. This overhead alignment signals continued pressure on the broader trend. Momentum remains weak, with the MACD below zero. Meanwhile, the Relative Strength Index (RSI) has slipped to near 27, entering oversold territory. That suggests the downside is stretched, but a reversal has yet to be confirmed.
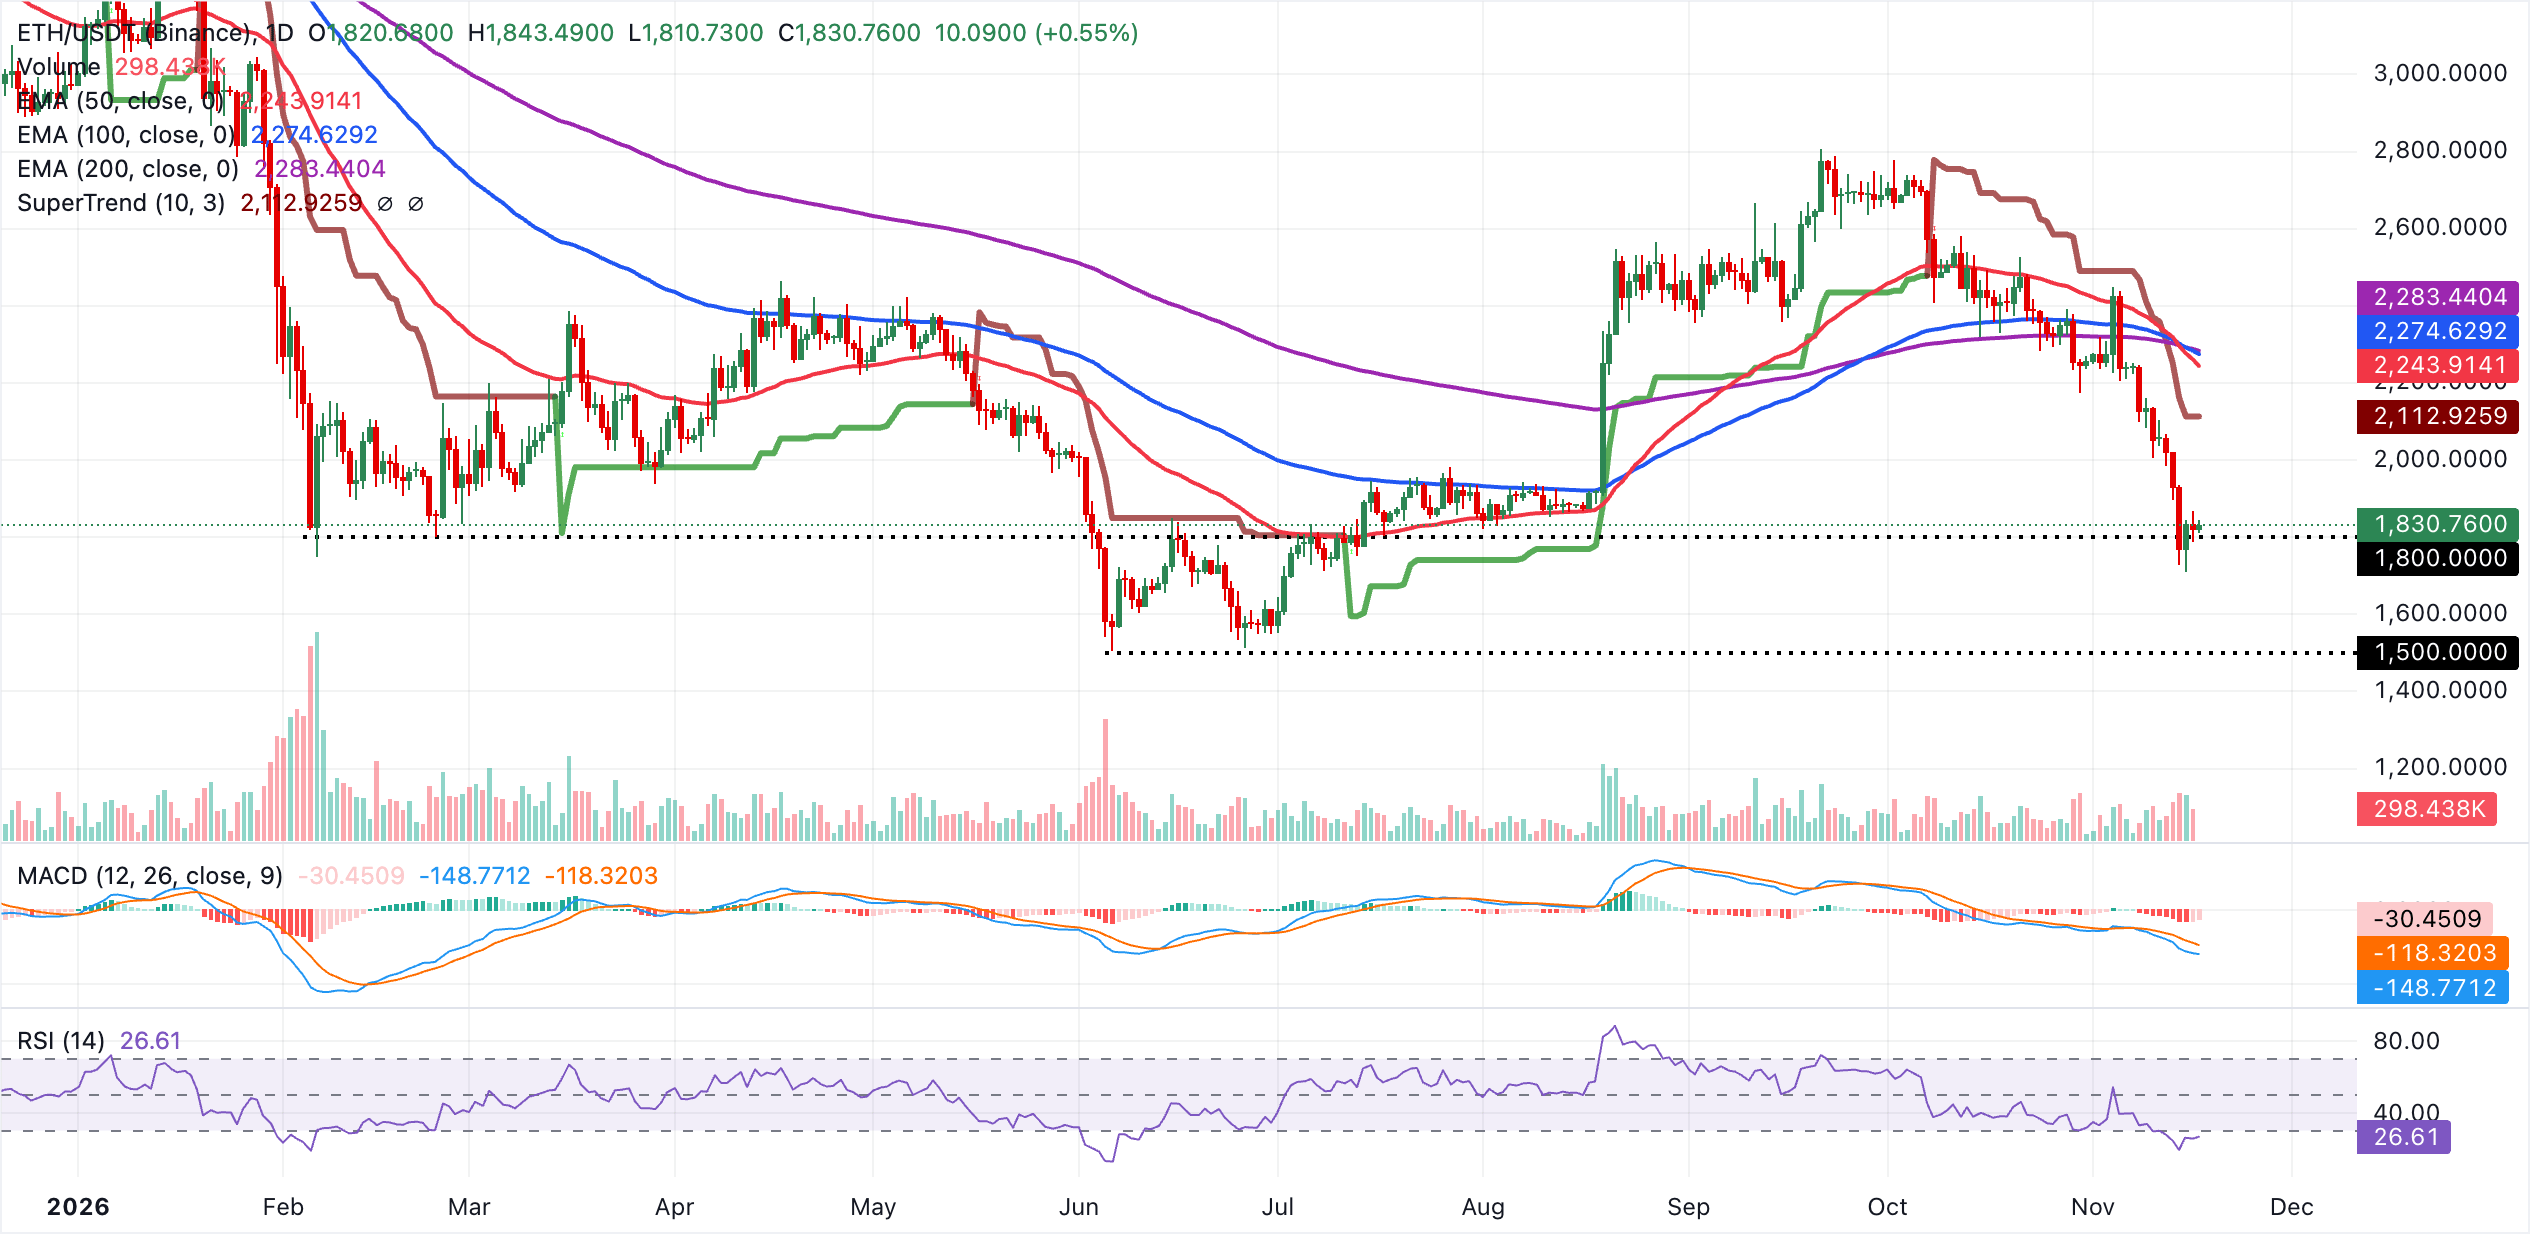
Around $2,244, the 50-day EMA is the first resistance level. The 100-day EMA at $2,275 and the 200-day EMA at $2,283 follow, creating a concentrated barrier that buyers need to regain to moderate the bearish outlook. On the downside, the next notable support is the SuperTrend line at $2,113. A rebound could initiate a corrective recovery. Conversely, a daily close beneath that level would likely leave ETH vulnerable to additional short-term losses.
$0.96: XRP’s technical bias stays bearish as losses narrow
At $0.96, XRP continues to show a bearish near-term bias. Its price remains well beneath the key EMAs and the active SuperTrend line. Overhead resistance comes from the 50-day, 100-day and 200-day EMAs at $1.22, $1.26 and $1.33, respectively. These levels point to a structurally constrained market, even with an RSI of 26 signalling oversold conditions.
Below zero, the MACD continues to indicate weak momentum. While these resistance barriers remain intact, further declines or an extended consolidation remain favoured.
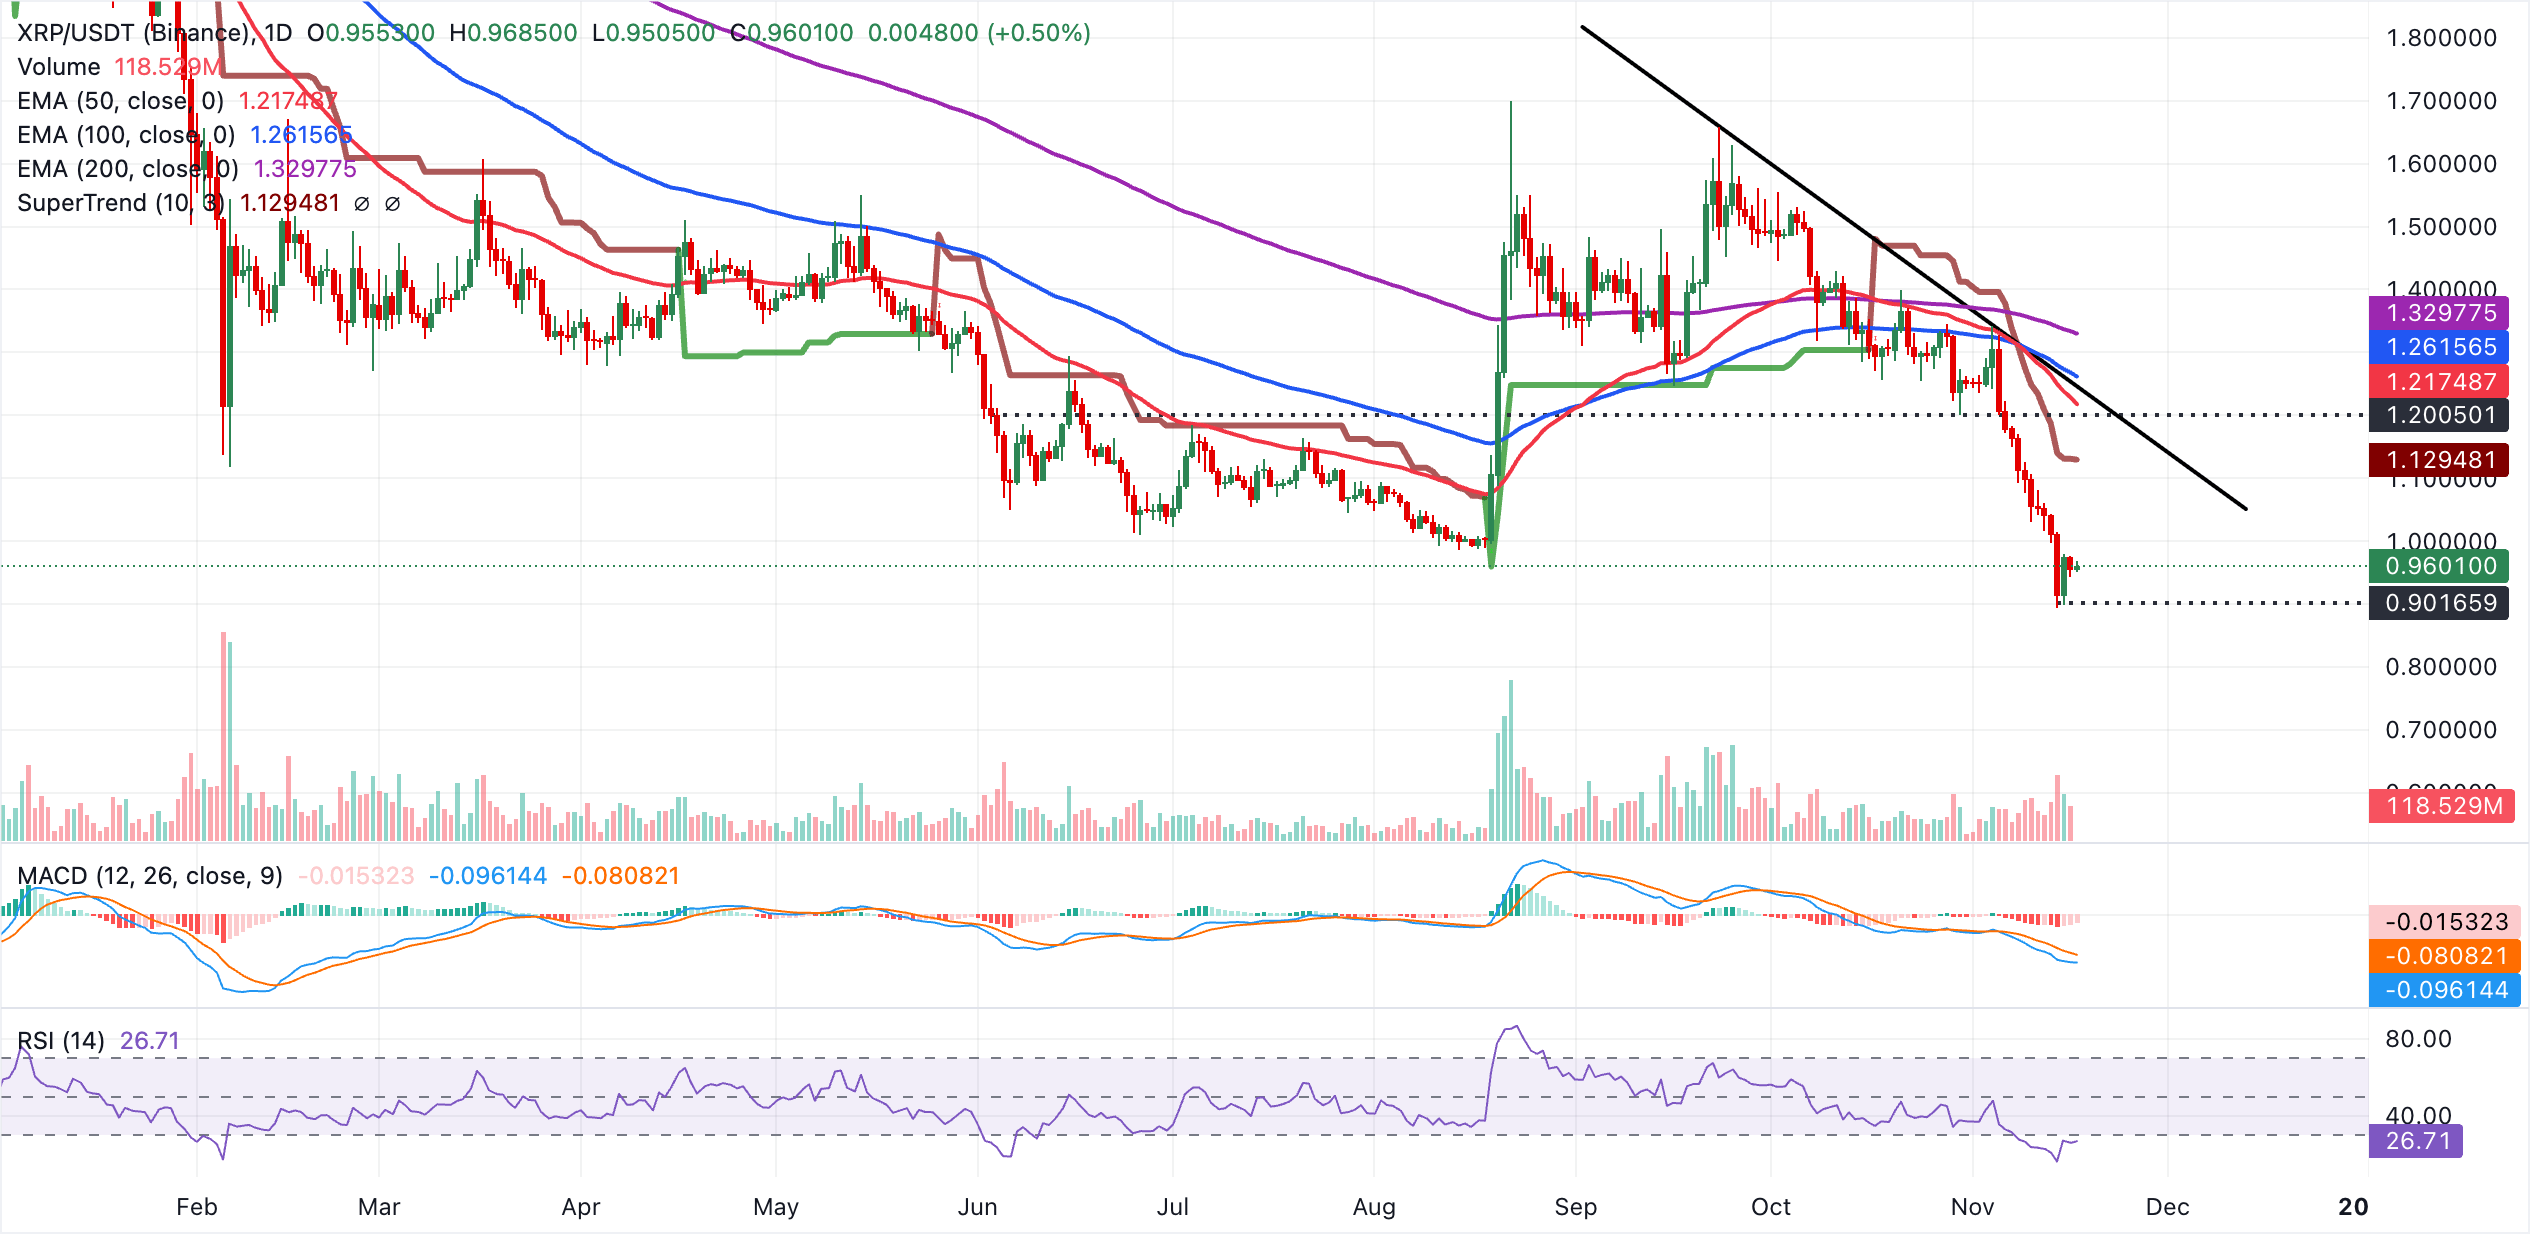
Around $1.13, the SuperTrend line marks initial resistance. Next come the 50-day EMA at $1.22 and descending trendline resistance near 1.2438. Together, they create a dense supply area that could restrain recovery attempts. Further up, the 100-day EMA at $1.26 and the 200-day EMA near $1.33 represent progressively stronger obstacles. Only a sustained break above these levels would alleviate the current bearish pressure and turn the daily outlook more constructive.
(The technical analysis of this story was written with the help of an AI tool. Know more.)
Crypto ETFs: key questions
Tracking the price of an underlying asset, an Exchange-Traded Fund (ETF) is an investment vehicle or an index. Its coverage can extend beyond a single asset to a collection of assets and sectors. A Bitcoin ETF, for instance, follows Bitcoin’s price. Investors use ETFs to obtain exposure to a particular asset.
Yes, Bitcoin futures ETFs have received approval. In October 2021, the first US Bitcoin futures ETF was authorised by the US Securities & Exchange Commission. Seven Bitcoin futures ETFs have secured approval in total, while more than 20 still await regulatory permission. According to the SEC, the cryptocurrency industry is new and vulnerable to manipulation. It cites this as the reason for delaying crypto-related futures ETFs over the past few years.
Yes. In January 2024, several Bitcoin spot Exchange-Traded Funds received SEC approval for listing and trading. The move enabled institutional capital and mainstream investors to trade the leading cryptocurrency. Industry participants welcomed the decision as a game changer.
Exposure without ownership is the principal benefit of crypto ETFs. This reduces the cost and risk of holding a cryptocurrency directly. Investors also face a gentler learning curve and gain greater security, as the ETF takes responsibility for safeguarding the underlying holdings. The central drawback is the absence of direct asset ownership, captured by the crypto expression “not your keys, not your coins.” Active management fees charged by ETFs also raise the costs associated with holding crypto. Finally, while ETFs reduce the risks of holding an asset, fluctuations in the underlying cryptocurrency’s price are still likely to feed through to the investment vehicle.
POPULAR ARTICLES
1Crypto Today: Capital outflows persist as Bitcoin falls, Ethereum and XRP trim losses235.6 in November: Germany ZEW Survey Shows Significant Improvement in Economic Sentiment3December hike odds fall but remain in play: Canadian Dollar – Commerzbank4Near 1.10: Euro holds steady as ECB influence remains limited – ING5Oil prices fall as supply surplus grows – MUFG6British Pound: Pressure mounts on range support against US Dollar – Societe Generale7Silver price today: FXStreet data points to higher silver prices8Bitcoin Price Forecast: Fragile BTC recovery faces tests from Nvidia earnings and Anthropic IPO9Swiss Franc faces persistent downside risks against US Dollar – UOB


Get Started!
Sign up and access the Global Markets in less than 3 minutes

Connect With Us









Contacts
Phone: +61 2 8036 8388
Fax: +61 2 8036 8388
Email: support@tmgm.com



The information provided on this website is of a general nature only and does not constitute personal financial advice. Before acting on any information on this website, you should consider the suitability of the information in relation to your objectives, financial situation and needs. Investing in CFDs and FX Margin Contracts carries significant risks and is not suitable for all investors. You may lose more than your initial deposit. You do not own, or have, any interest in the underlying asset. We recommend that you seek independent advice and ensure you fully understand the risks involved before trading. It is important that you read and consider the disclosure document before you acquire any product listed on the website. The information and advertisements offered on this website are not intended for use by any person in any country or jurisdiction where such use would be contrary to local laws and regulations. The Products and Services offered on this website are not intended for residents of the United States, Malaysia and Thailand.
TMGM is authorized and regulated in various jurisdictions.
Trademax Australia Limited, trading as TMGM, is regulated by the Australian Securities and Investments Commission (ASIC), AFSL no. 436416 and is located at Level 28, One International Tower, 100 Barangaroo Avenue, 2000 Sydney, NSW Australia.
Email: support@tmgm.com.au
Trademax Global Limited, trading as TMGM, is authorized and regulated by the Vanuatu Financial Services Commission (VFSC), registration number 40356 and registered at 1276, Kumul Highway, Port Vila, Vanuatu, Republic of Vanuatu.
Email: support@tmgm.com
Trademax Global Markets (SE) Limited, trading as TMGM, is authorized and regulated by the Financial Services Authority (FSA) of Seychelles, with license number SD224. The company is registered at Office No 13, Providence Estate ABIS Centre, Mahe, Seychelles.
Email: support@tmgm.com
Trademax Global Markets (International) Pty Ltd, trading as TMGM, is authorized and regulated by the Financial Services Commission, Mauritius (FSC) with license no. GB22201012, and registered at 33, Edith Cavell Street C/o IQ EQ Fund Services (Mauritius) Ltd Port Louis, 11324 Mauritius.
Email: support@tmgm.com
Copyright © TMGM. All rights reserved