

Trading
Explore a wide range of markets with competitive pricing, deep liquidity, and advanced trading tools.
Learn More 
Platform
Trade seamlessly with TMGM's powerful platform, built for speed, precision, and a superior trading experience.
Learn More Trading Platform
Academy
Learn the fundamentals of trading with beginner-friendly resources, including guides, webinars, and market insights.
Learn More News & Analysis
Get real-time market updates and expert analysis to stay ahead of trading opportunities
Learn More News & Analysis
About
Learn what sets TMGM apart — our global presence, regulatory strength, and commitment to innovation in trading.
Learn More Why Choose TMGM
Sponsorship
Crypto Today: ETF outflows as selling pressure builds on Bitcoin, Ethereum and XRP
- $65,000 remains out of reach for Bitcoin on Monday. Its corrective trend persists after $1 billion in ETF outflows last week.
- Below $1,800, Ethereum risks further spot losses as sellers strengthen their control.
- Below $0.95, XRP slips further as capital withdrawals and a fragile technical structure weigh on the token.
$65,000 remains above Bitcoin (BTC) as it trades lower on Monday. Mounting risk aversion is amplifying selling across the broader cryptocurrency market. Ethereum (ETH) also faces a bleak outlook, slipping towards $1,800, while Ripple (XRP) holds below $0.95.

At multi-year lows, the remittance token faces overhead conditions that offer buyers little relief. A recovery could prove difficult if the path of least resistance for BTC, ETH and XRP continues to point lower.
$1 billion in Bitcoin ETF outflows extends crypto withdrawals
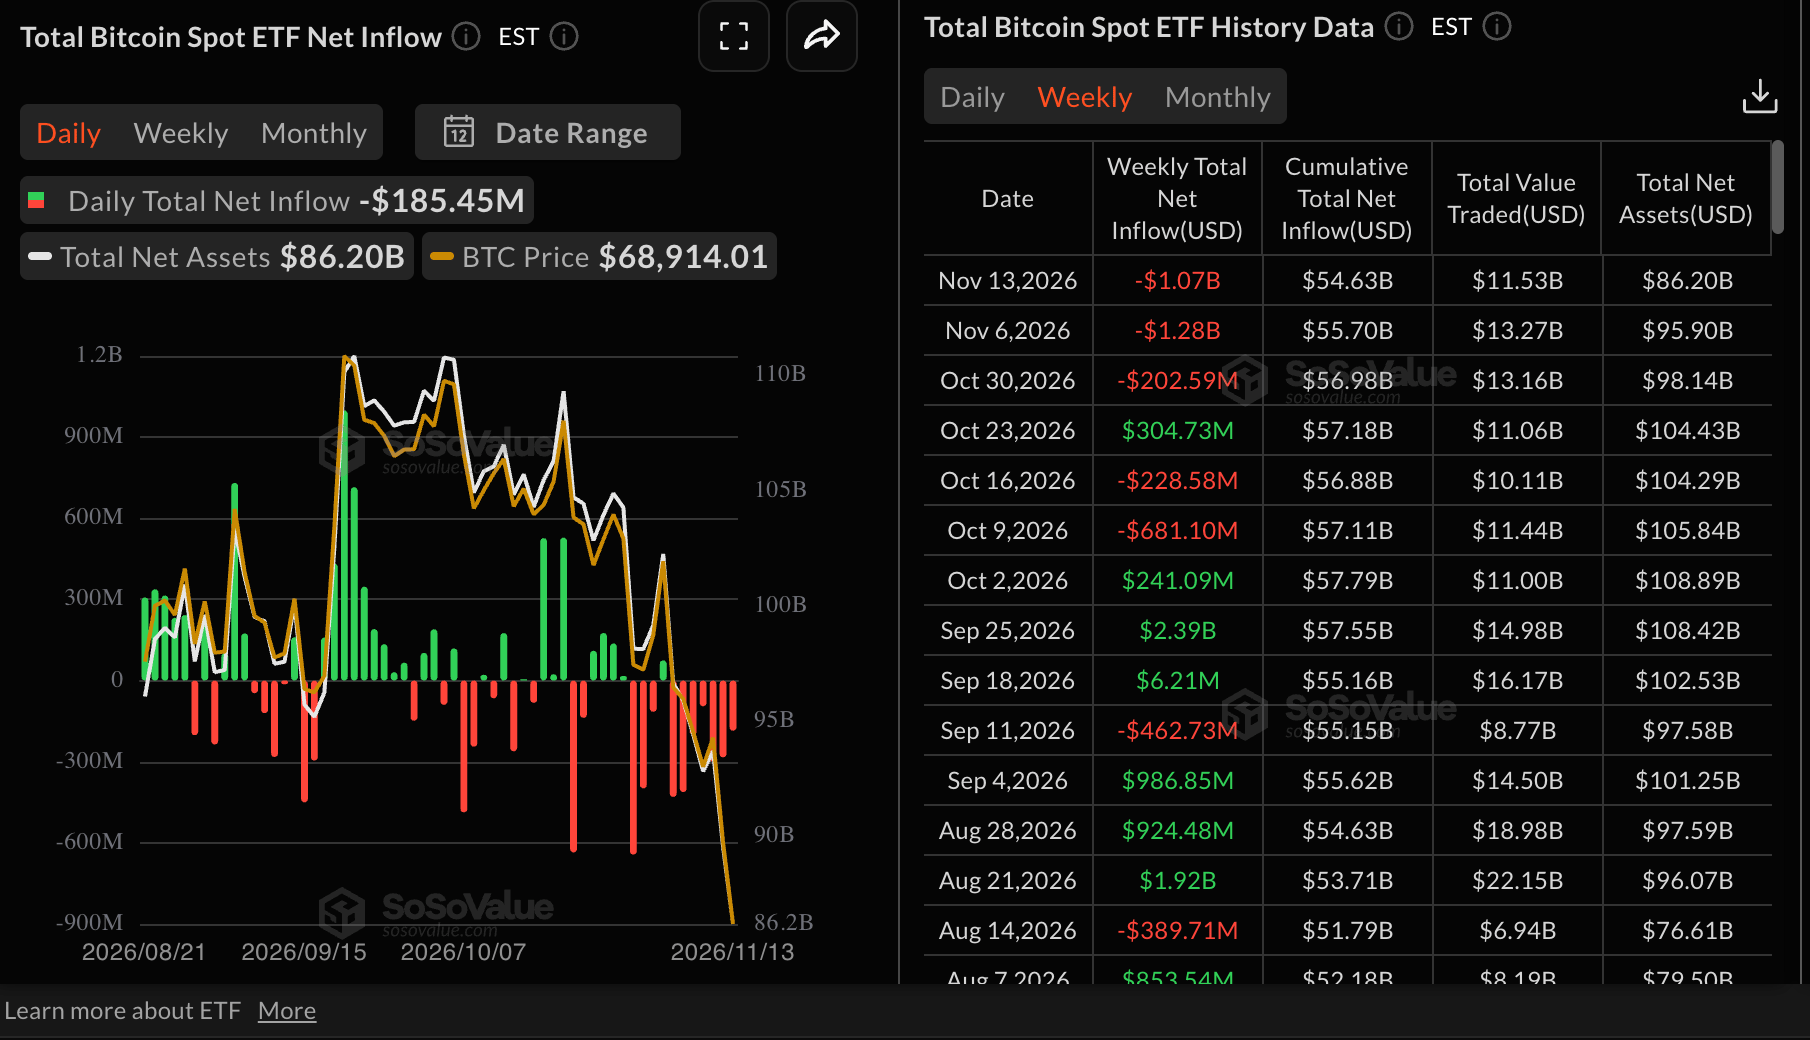
Slightly more than $1 billion left Bitcoin Exchange-Traded Funds (ETFs) last week through Friday, underscoring the deterioration in demand for crypto-linked investment products over recent weeks. A third successive week of withdrawals takes cumulative outflows to $54.6 billion, with net assets under management at $86.2 billion. Continued withdrawals erode the institutional buffer against wider market price pressure and increase the likelihood of a prolonged sell-off.
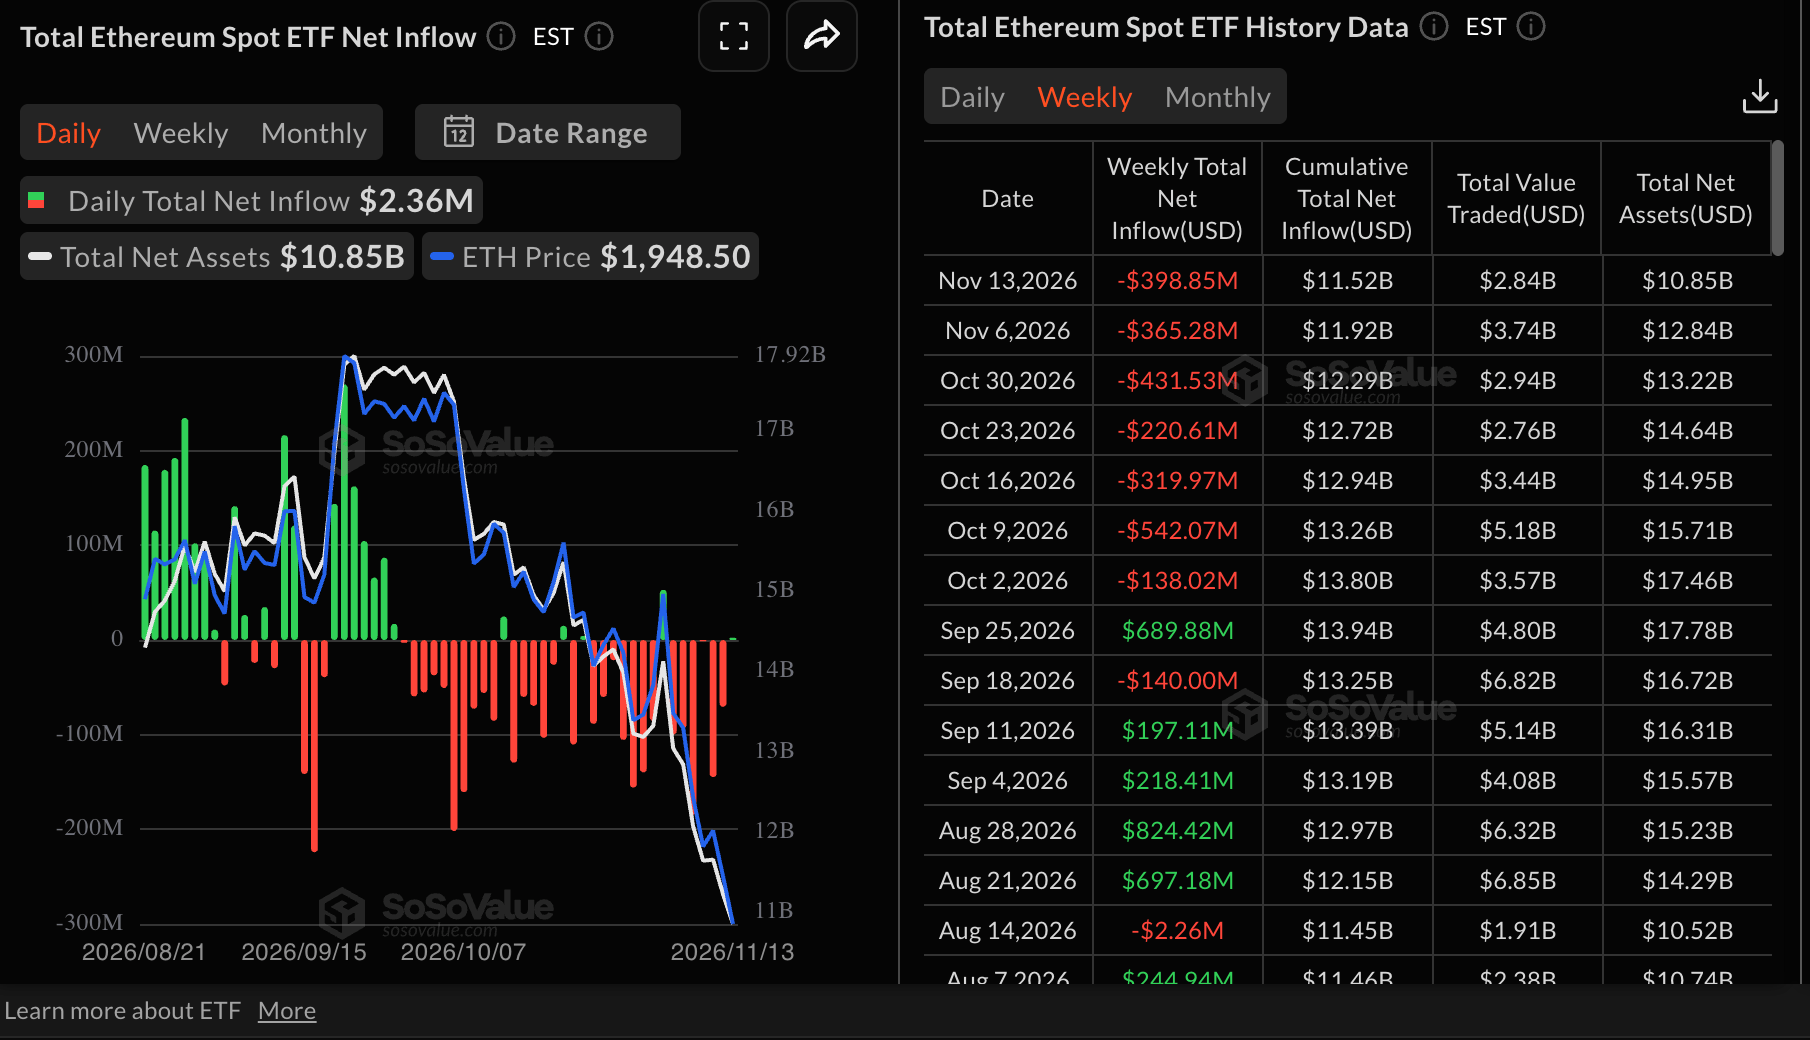
A seventh consecutive week of withdrawals kept Ethereum spot ETFs under bearish pressure. Outflows reached $399 million last week through Friday, according to SoSoValue, reducing cumulative inflows to $11.5 billion and net assets under management to $10.9 billion.
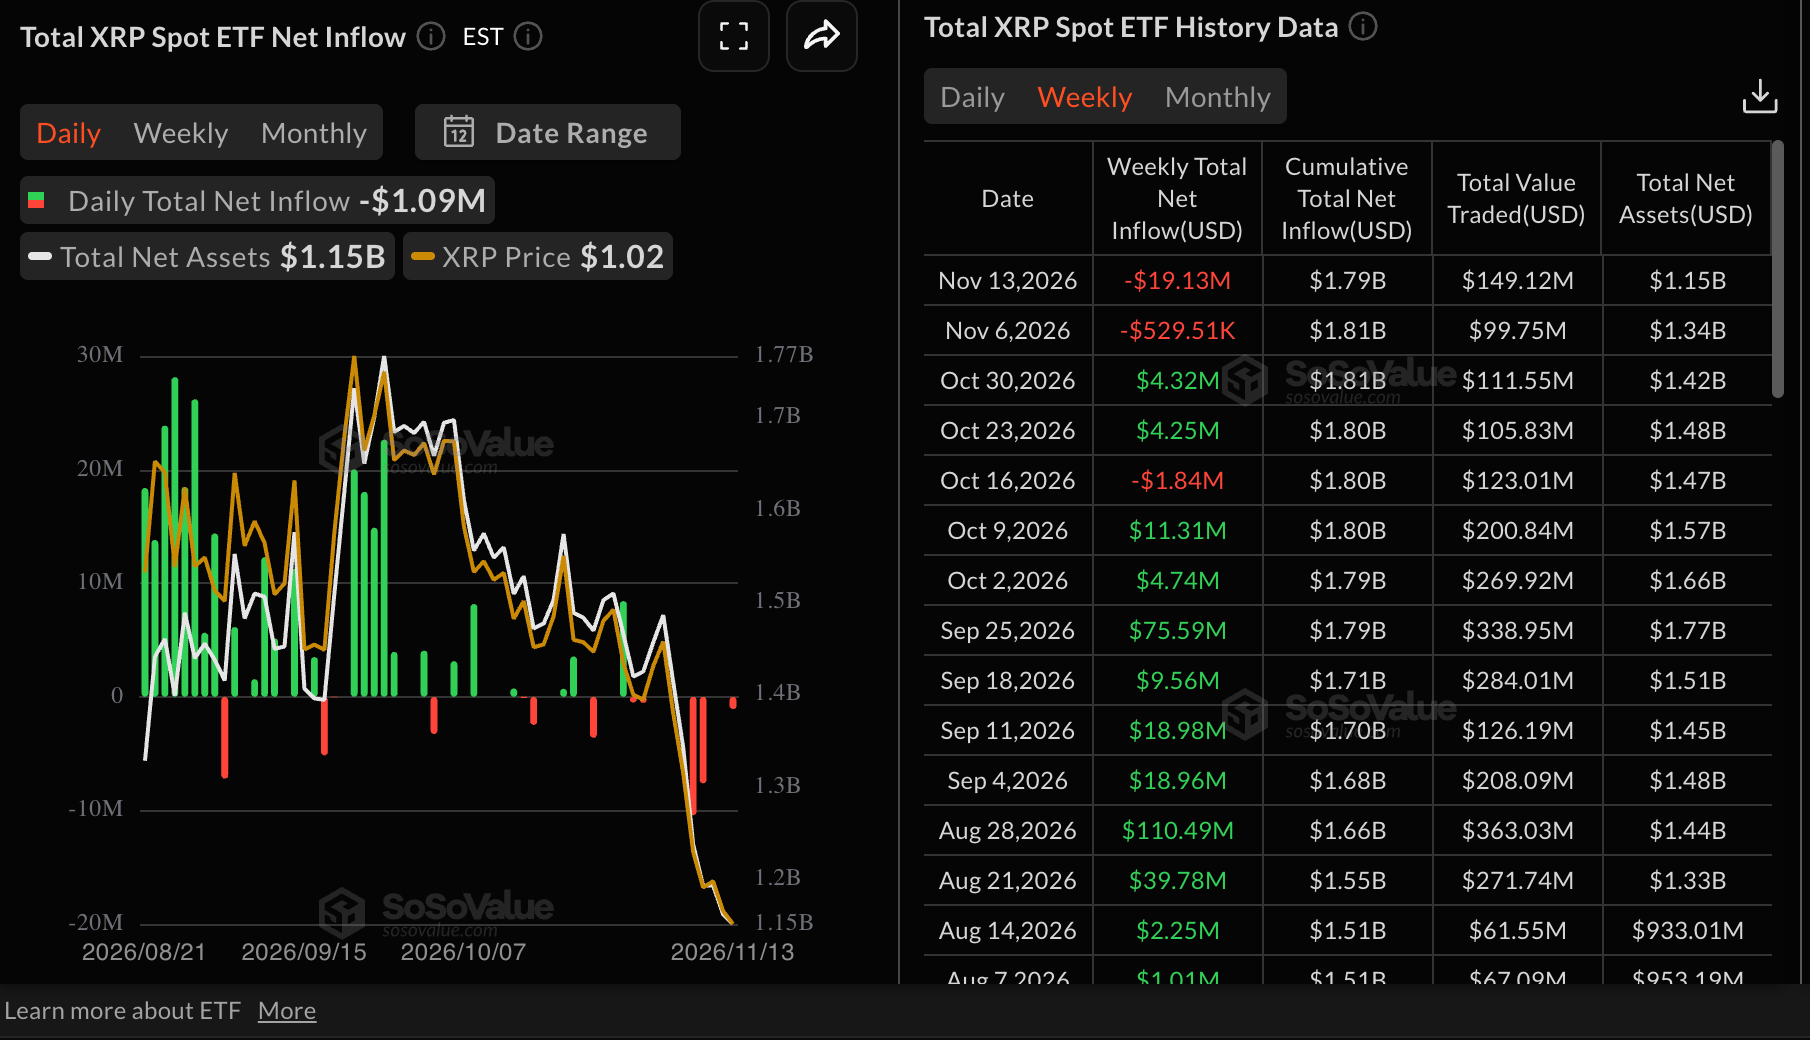
Roughly $19 million flowed out of XRP spot ETFs last week through Friday, a marked increase in withdrawals. It was the second bearish week, following outflows of $530,000 in the week ending 6 November. Nevertheless, cumulative inflows remain at $1.8 billion, alongside net outflows of $1.2 billion, suggesting that investor interest in the underlying token remains positive and long-term.
$64,439 Bitcoin faces mounting selling pressure: Technical analysis
At $64,439, Bitcoin continues to fall well below its key Exponential Moving Averages (EMAs), leaving the short-term outlook bearish. Overhead resistance sits at the 50-day EMA of $76,674, the 100-day EMA of $76,456 and the 200-day EMA of $76,008. These levels suggest limited upside, with successive layers of supply likely to confront any rebound.
An additional, intermediate resistance level comes from the SuperTrend line at $72,754. Meanwhile, the deeply negative MACD and an oversold Relative Strength Index (RSI) reading of 23 suggest that downward momentum still dominates, although a corrective rebound remains possible.
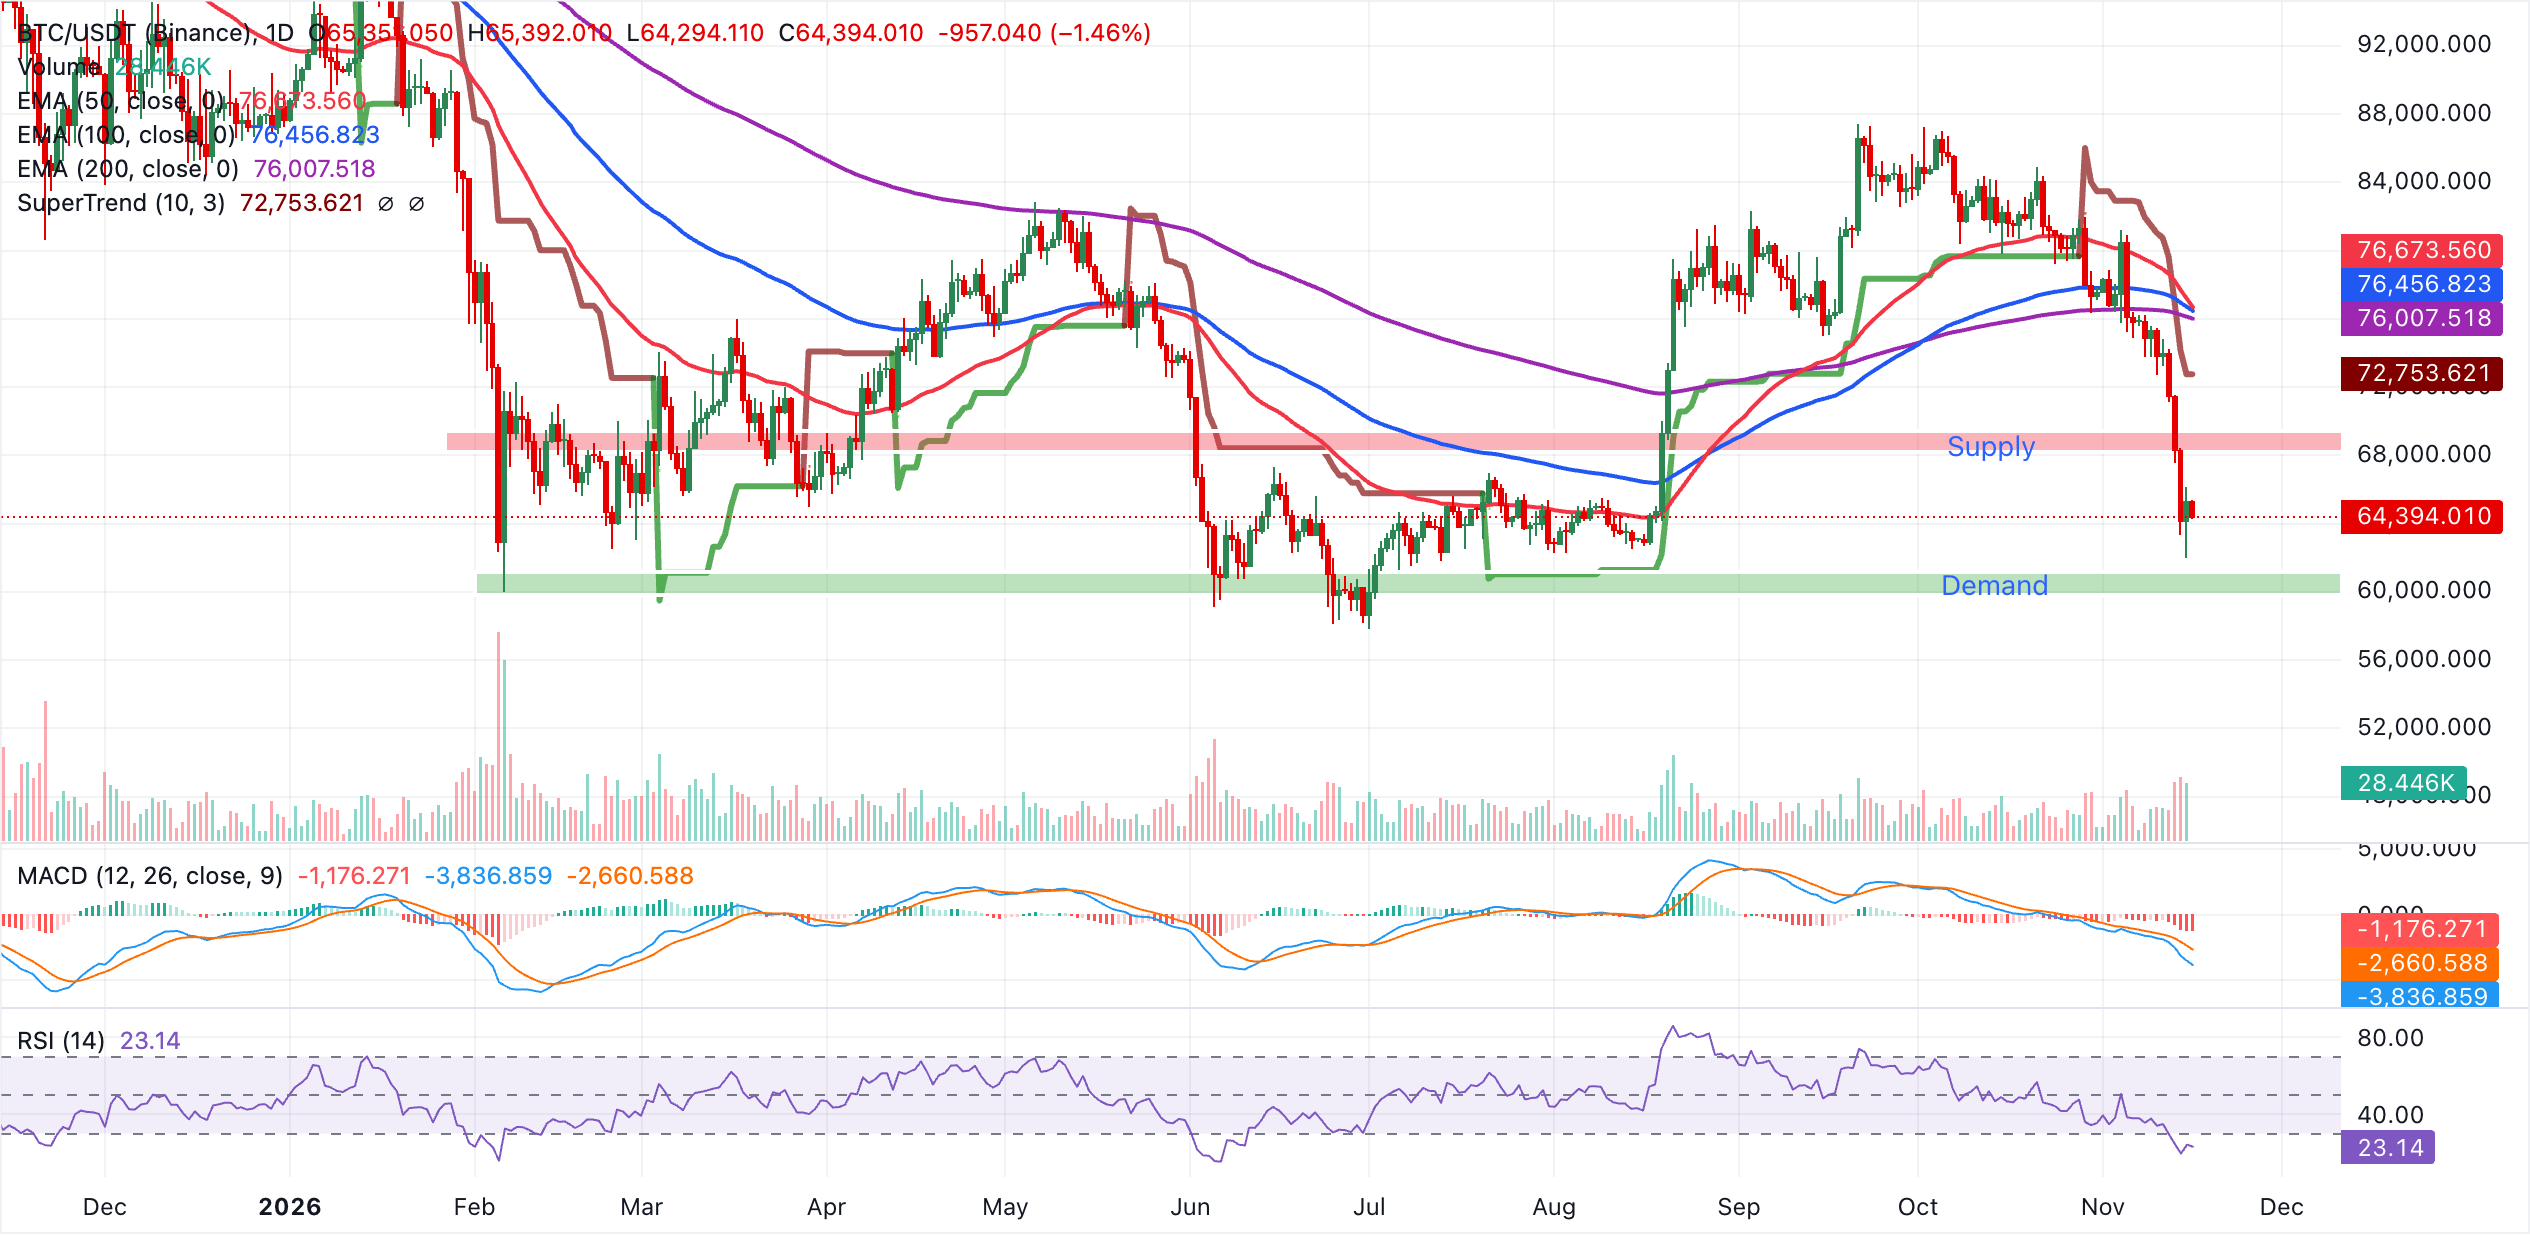
Around $72,754, the SuperTrend would present the first obstacle to an immediate recovery. Beyond that, the 200-day, 100-day and 50-day EMAs form a tightly packed resistance zone between $76,008 and $76,675, defining the broader bearish structure.
Attention remains on Bitcoin's response to these overhead levels, as the daily chart highlights no nearby technical support. Sellers would probably retain control if the price fails to regain them. Easing the prevailing bearish pressure would require sustained daily closes back above both the SuperTrend and the long-term EMAs.
$1,807 Ethereum shows weaker momentum: Technical analysis
At $1,807, Ethereum remains well beneath the 50-day, 100-day and 200-day EMAs concentrated in the $2,260-$2,283 range, preserving a clearly bearish short-term outlook. Despite signs of near-term market exhaustion, downward pressure appears persistent: the MACD remains deeply negative, and the RSI reading of 25 is in oversold territory.
The 50-day EMA around $2,260 provides the nearest resistance, ahead of the 200-day EMA at $2,279 and the 100-day EMA near $2,283. Regaining this concentrated overhead supply zone would be necessary to soften the bearish outlook. On the downside, the next notable support comes from the SuperTrend line around $2,113. A daily close back above that area would be needed to suggest stabilisation rather than a further extension of the recent decline.
Below $0.95, XRP sellers extend control: Technical analysis
Below $0.95, XRP retains a bearish short-term outlook, trading far beneath its main moving averages. The 50-day EMA at $1.23, 100-day EMA at $1.27 and 200-day EMA at $1.33 represent overhead barriers, indicating that the recent decline has left the market's upside constrained.
At $1.13, the SuperTrend indicator adds to the overhead pressure. The RSI remains oversold at around 25, suggesting an extended decline without yet pointing to a clear recovery. A negative MACD below its signal line, accompanied by a muted histogram, further supports the bearish outlook.
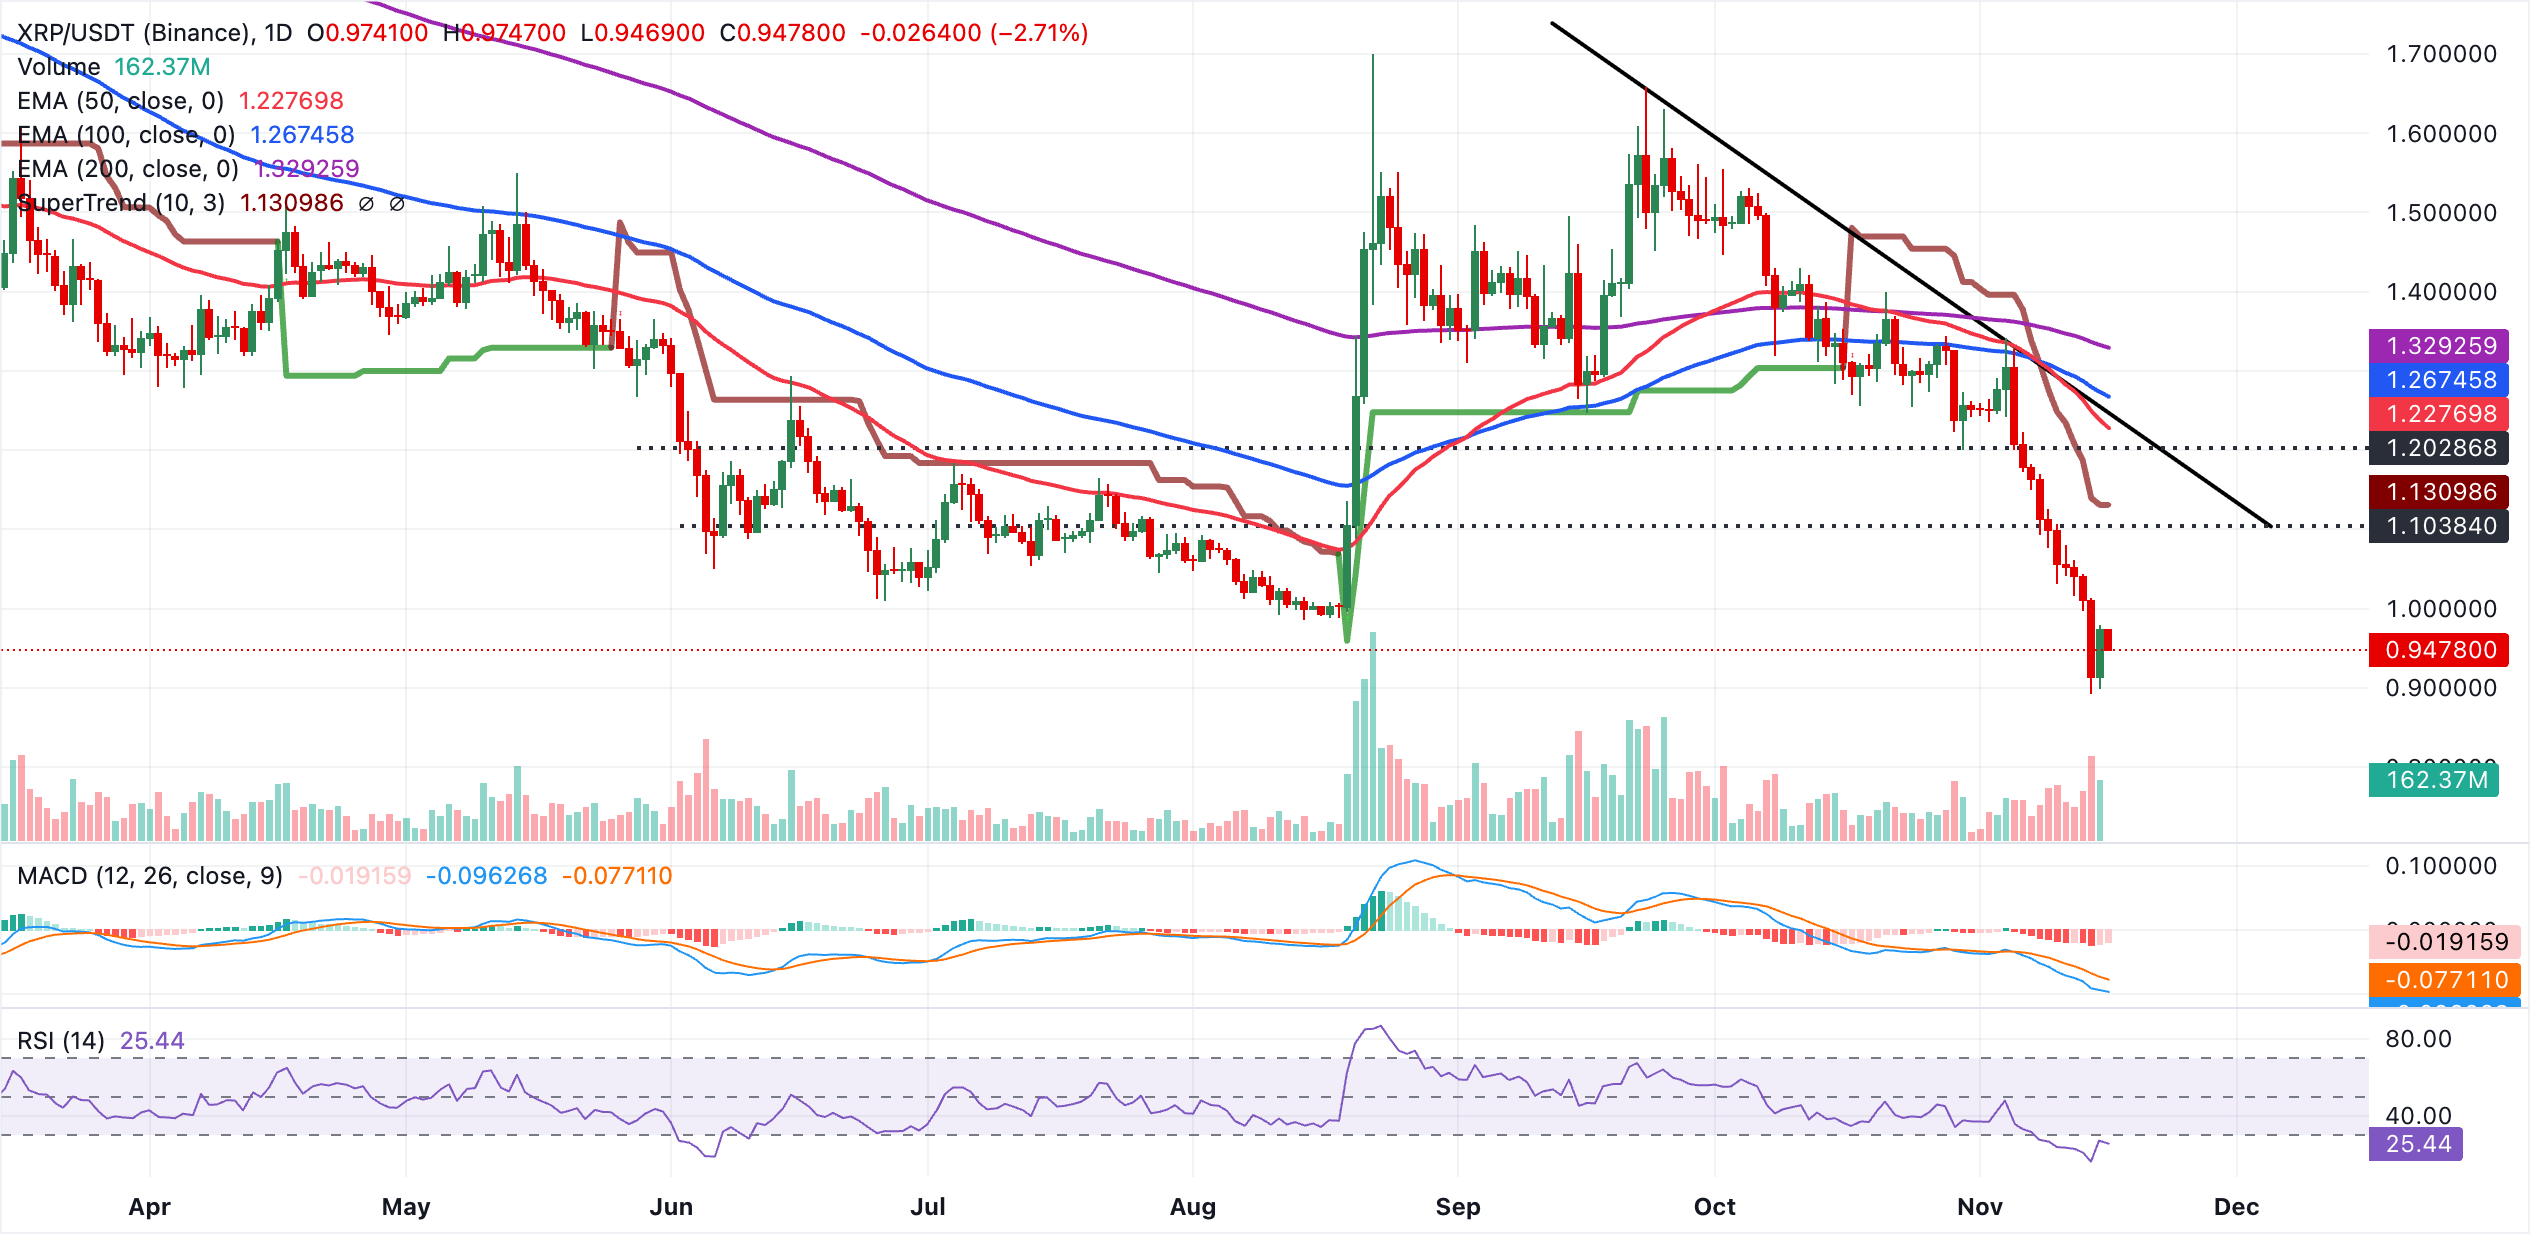
Near $1.13, the SuperTrend provides initial resistance. A more concentrated barrier follows at the 50-day EMA of $1.23 and the descending resistance trendline break price of $1.24. Further up, the 100-day EMA at $1.27 and the 200-day EMA at $1.33 form successive obstacles. These would need to be regained to relieve the broader downward pressure.
The daily chart offers no clear structural support beneath the current price. Traders may therefore keep watching the approach to overhead levels for either rejection, which would extend the downtrend, or a sustained breakout that would challenge the prevailing bearish outlook.
(The technical analysis of this story was written with the help of an AI tool. Know more.)
Crypto ETFs: Key questions
Tracking the price of an underlying asset, an Exchange-Traded Fund (ETF) is an investment vehicle or index. Its scope can cover one asset or a collection of assets and sectors. A Bitcoin ETF, for instance, follows Bitcoin's price. Investors use ETFs to obtain exposure to a particular asset.
Yes. In October 2021, approval for the first US Bitcoin futures ETF came from the US Securities & Exchange Commission. Seven Bitcoin futures ETFs have secured approval in total, while more than 20 still await regulatory permission. According to the SEC, the cryptocurrency industry is new and vulnerable to manipulation. It cites this as the reason for delaying crypto-related futures ETFs over the past few years.
Yes. In January 2024, several Bitcoin spot Exchange-Traded Funds received SEC approval for listing and trading. This opened trading in the leading cryptocurrency to institutional capital and mainstream investors. The industry welcomed the decision as a game-changing development.
Exposure to a cryptocurrency without owning it is the principal benefit of crypto ETFs, reducing the cost and risk of holding the asset. Investors also face a gentler learning curve and benefit from greater security, as responsibility for safeguarding the underlying holdings rests with the ETF. The central drawback is the absence of direct asset ownership, summed up by the crypto saying “not your keys, not your coins.” Active-management fees charged by ETFs also increase the costs associated with holding crypto. Lastly, although ETF investment reduces the risks of holding an asset, fluctuations in the underlying cryptocurrency's price are still likely to feed through to the investment vehicle.
POPULAR ARTICLES
1Above $3,850: XAU/USD rebounds but bearish bias persists | Gold Price Forecast2Crypto Today: ETF outflows as selling pressure builds on Bitcoin, Ethereum and XRP3Gold: Lower projected levels draw closer as downtrend continues – Societe Generale4Euro: Rate support faces fiscal headwinds – Commerzbank5Above $87, WTI Oil Wavers Amid Mounting Geopolitical Fears and Oversupply Warnings6US Dollar: Reversing strong momentum looks tougher – ING70.6755 Test: Australian Dollar Eyes 0.6740 Against US Dollar - UOB8Silver price today: Decline recorded in FXStreet data9Equities: Midterms Sell-Off Gives Way to Balanced Recovery – Danske Bank


Get Started!
Sign up and access the Global Markets in less than 3 minutes

Connect With Us









Contacts
Phone: +61 2 8036 8388
Fax: +61 2 8036 8388
Email: support@tmgm.com



The information provided on this website is of a general nature only and does not constitute personal financial advice. Before acting on any information on this website, you should consider the suitability of the information in relation to your objectives, financial situation and needs. Investing in CFDs and FX Margin Contracts carries significant risks and is not suitable for all investors. You may lose more than your initial deposit. You do not own, or have, any interest in the underlying asset. We recommend that you seek independent advice and ensure you fully understand the risks involved before trading. It is important that you read and consider the disclosure document before you acquire any product listed on the website. The information and advertisements offered on this website are not intended for use by any person in any country or jurisdiction where such use would be contrary to local laws and regulations. The Products and Services offered on this website are not intended for residents of the United States, Malaysia and Thailand.
TMGM is authorized and regulated in various jurisdictions.
Trademax Australia Limited, trading as TMGM, is regulated by the Australian Securities and Investments Commission (ASIC), AFSL no. 436416 and is located at Level 28, One International Tower, 100 Barangaroo Avenue, 2000 Sydney, NSW Australia.
Email: support@tmgm.com.au
Trademax Global Limited, trading as TMGM, is authorized and regulated by the Vanuatu Financial Services Commission (VFSC), registration number 40356 and registered at 1276, Kumul Highway, Port Vila, Vanuatu, Republic of Vanuatu.
Email: support@tmgm.com
Trademax Global Markets (SE) Limited, trading as TMGM, is authorized and regulated by the Financial Services Authority (FSA) of Seychelles, with license number SD224. The company is registered at Office No 13, Providence Estate ABIS Centre, Mahe, Seychelles.
Email: support@tmgm.com
Trademax Global Markets (International) Pty Ltd, trading as TMGM, is authorized and regulated by the Financial Services Commission, Mauritius (FSC) with license no. GB22201012, and registered at 33, Edith Cavell Street C/o IQ EQ Fund Services (Mauritius) Ltd Port Louis, 11324 Mauritius.
Email: support@tmgm.com
Copyright © TMGM. All rights reserved