

Trading
Explore a wide range of markets with competitive pricing, deep liquidity, and advanced trading tools.
Learn More 
Platform
Trade seamlessly with TMGM's powerful platform, built for speed, precision, and a superior trading experience.
Learn More Trading Platform
Academy
Learn the fundamentals of trading with beginner-friendly resources, including guides, webinars, and market insights.
Learn More News & Analysis
Get real-time market updates and expert analysis to stay ahead of trading opportunities
Learn More News & Analysis
About
Learn what sets TMGM apart — our global presence, regulatory strength, and commitment to innovation in trading.
Learn More Why Choose TMGM
Sponsorship
$75 reclaimed by SOL: Solana Price Forecast as ETFs record first inflow in three weeks
- $75 is Solana’s approximate trading level on Wednesday. The price is consolidating after the previous day’s 5% recovery.
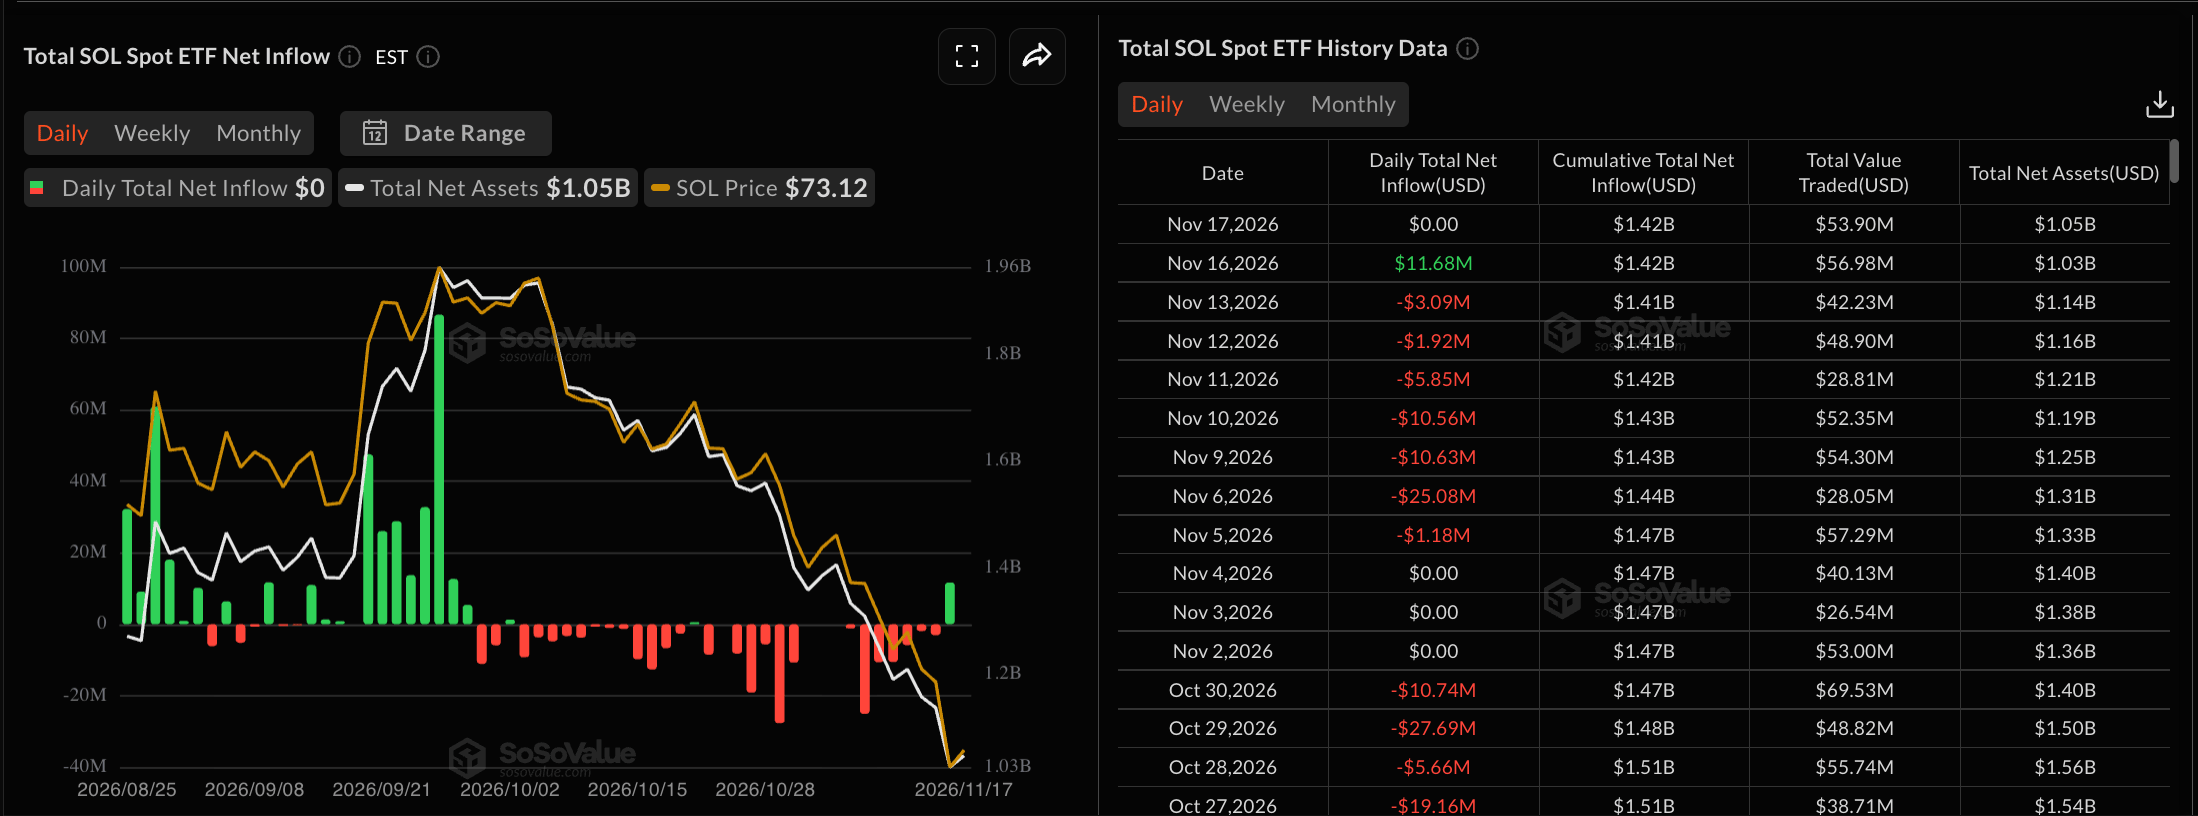
- Nearly $12 million flowed into SOL-focused ETFs on Monday, their first inflow following three weeks of outflows.
- Oversold conditions point to a possible short-term recovery for SOL, but the longer-term downtrend leaves the technical picture mixed.
$75 is the approximate price of Solana (SOL) on Wednesday. The previous day’s 5% recovery coincided with Nvidia's (NVDA) Q3 earnings exceeding market forecasts. Nearly $12 million in inflows, the first in three weeks, signals renewed institutional demand for SOL. Technical signals remain mixed, although oversold conditions suggest scope for a rebound.

5% Solana Recovery Backed by ETF Inflows and Nvidia Earnings
Fresh institutional buying and Nvidia’s (NVDA) better-than-expected earnings helped lift Solana by over 5% on Tuesday. On Monday, SOL-focused exchange-traded funds (ETFs) attracted $11.68 million, their first inflow since October 21. This suggests institutional buying may be establishing a price floor. Tuesday brought zero ETF inflows, however, leaving the response mixed.
Some buying momentum in the crypto market also came from Nvidia’s third-quarter revenue of $115.8 billion, an increase of 103% year on year and 20% over the preceding quarter.
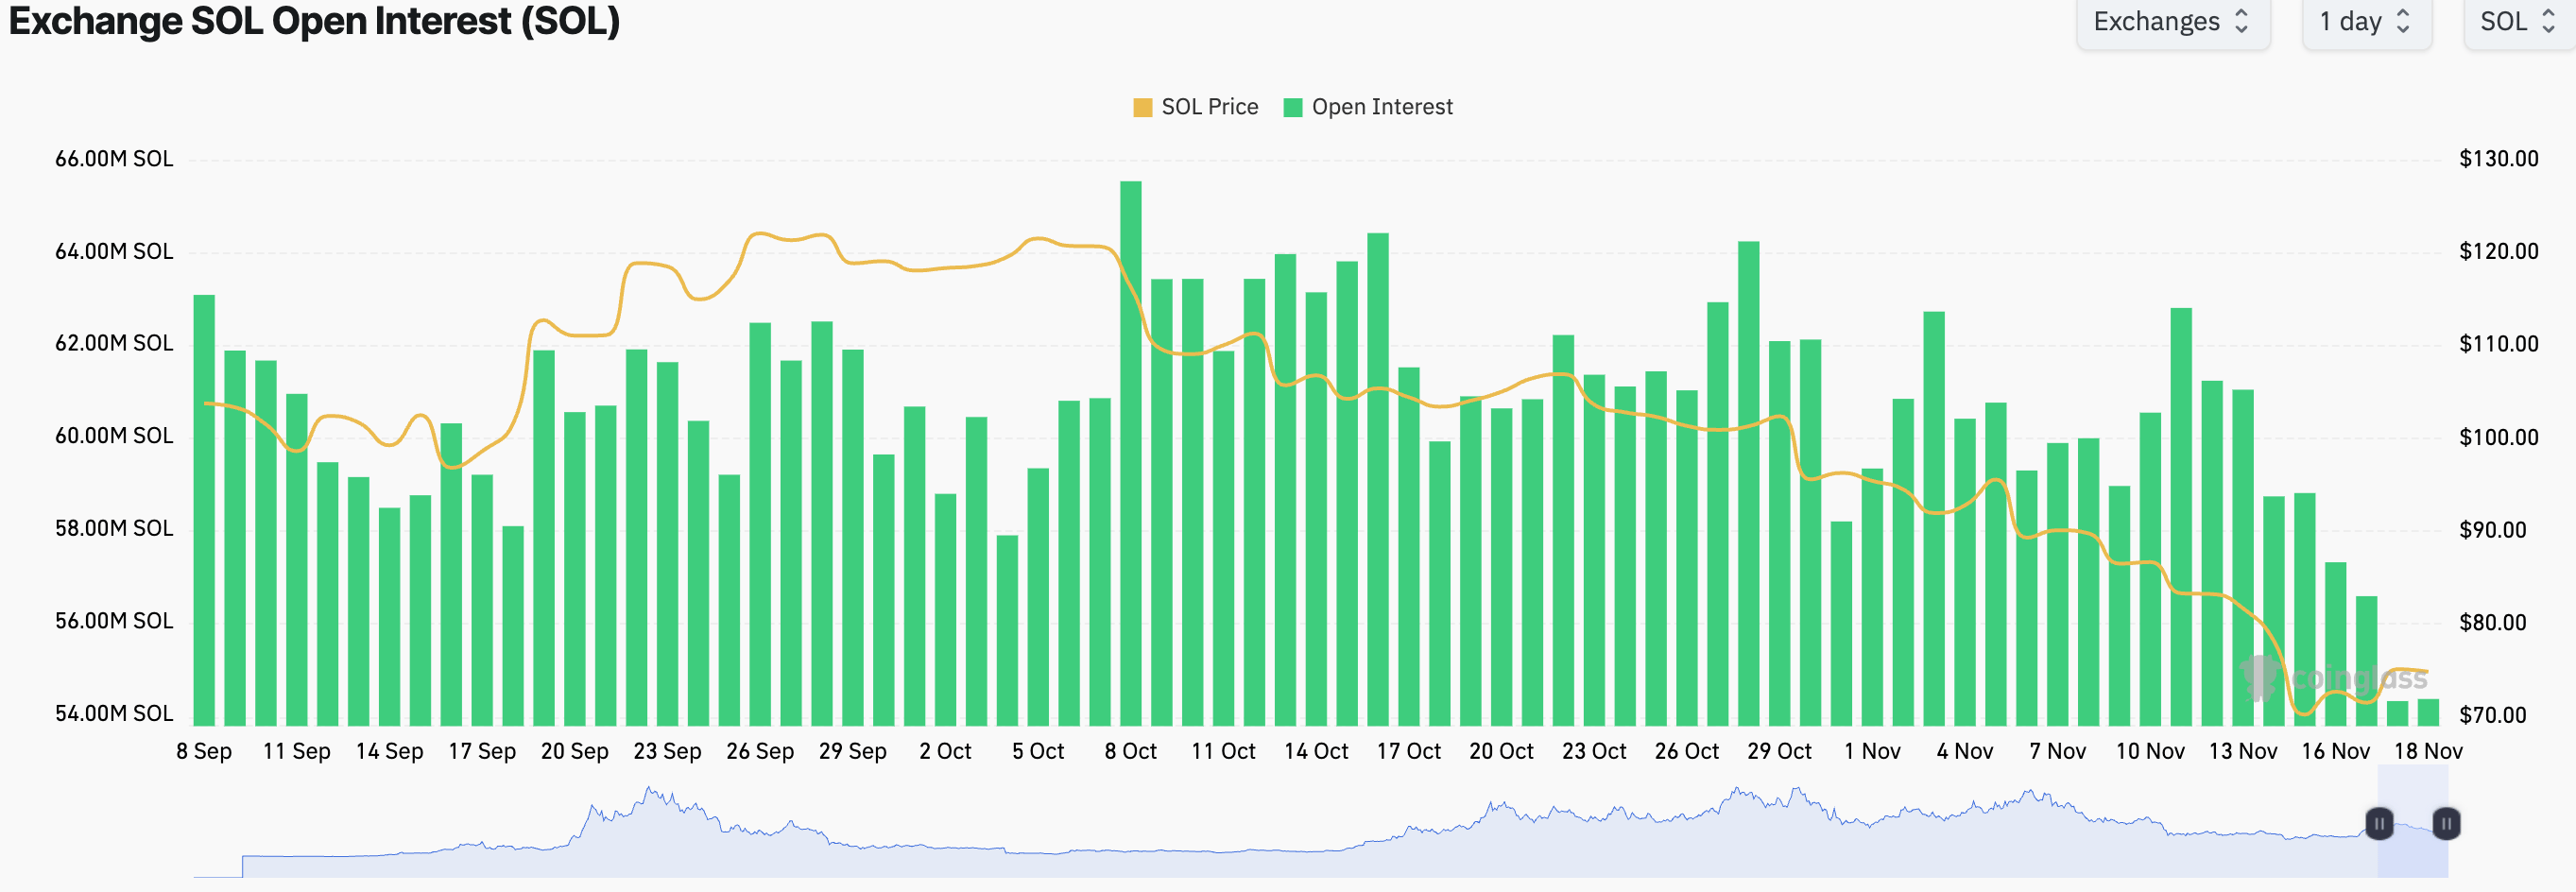
By contrast, activity in Solana’s derivatives market continues to contract. Solana futures Open Interest (OI) has fallen from 62.79 million SOL last week to 54.33 million SOL, according to CoinGlass data, indicating that positions are being wiped out.
Solana remains vulnerable as uneven ETF flows and falling OI offset the short-term lift from NVDA’s earnings. A day of ETF outflows or a wider market correction could prolong SOL’s price decline.
$75.06 SOL: Rebound Faces Longer-Term Downtrend
At the time of writing on Wednesday, Solana is priced at $75.06. Its short-term recovery continues from the $67.50 support floor tested on Sunday. The longer-term trend remains downward, however: last week’s 16% fall delivered a sixth consecutive bearish weekly close.
The downside bias is reinforced by Solana’s position below its 50-day and 200-day Exponential Moving Averages (EMAs), at $93.11 and $96.46 respectively.
An oversold Relative Strength Index (RSI) reading of 28 indicates that the downtrend is overstretched. Selling pressure nevertheless remains dominant, with the Moving Average Convergence Divergence (MACD) line still negative. A weakening negative MACD profile offers a qualification: the decline may be losing pace.
Initial upside resistance stands at $77.60. Additional hurdles lie at $87.46 and $95.82, ahead of the 50-day EMA at $93.11 and the 200-day EMA at $96.46. Together, these levels create a dense supply zone that SOL would need to reclaim to reduce bearish pressure.
Immediate downside support lies at $67.50, with a stronger floor around $60.13 below it. Buyers are likely to defend the broader uptrend there, despite the current corrective conditions.
(The technical analysis of this story was written with the help of an AI tool. Know more.)
POPULAR ARTICLES
1AUD/USD Price Forecast: More downside likely towards 0.666021.0950: Further Euro decline against US Dollar less likely – UOB3$75 reclaimed by SOL: Solana Price Forecast as ETFs record first inflow in three weeks4Below 1.1000: Euro retreats as Fed December hike odds climb; FOMC Minutes in focus51.3200 in Focus: GBP/USD Price Forecast Amid Cautious Trading6US Dollar strength weighs on Swiss Franc ahead of FOMC Meeting Minutes7Sustained foreign inflows into Indian equities fuel further rupee gains8Indonesian Rupiah edges lower as Bank Indonesia interest rate decision nears9KOSPI leads gains as Asian stocks diverge following Nvidia earnings


Get Started!
Sign up and access the Global Markets in less than 3 minutes

Connect With Us









Contacts
Phone: +61 2 8036 8388
Fax: +61 2 8036 8388
Email: support@tmgm.com



The information provided on this website is of a general nature only and does not constitute personal financial advice. Before acting on any information on this website, you should consider the suitability of the information in relation to your objectives, financial situation and needs. Investing in CFDs and FX Margin Contracts carries significant risks and is not suitable for all investors. You may lose more than your initial deposit. You do not own, or have, any interest in the underlying asset. We recommend that you seek independent advice and ensure you fully understand the risks involved before trading. It is important that you read and consider the disclosure document before you acquire any product listed on the website. The information and advertisements offered on this website are not intended for use by any person in any country or jurisdiction where such use would be contrary to local laws and regulations. The Products and Services offered on this website are not intended for residents of the United States, Malaysia and Thailand.
TMGM is authorized and regulated in various jurisdictions.
Trademax Australia Limited, trading as TMGM, is regulated by the Australian Securities and Investments Commission (ASIC), AFSL no. 436416 and is located at Level 28, One International Tower, 100 Barangaroo Avenue, 2000 Sydney, NSW Australia.
Email: support@tmgm.com.au
Trademax Global Limited, trading as TMGM, is authorized and regulated by the Vanuatu Financial Services Commission (VFSC), registration number 40356 and registered at 1276, Kumul Highway, Port Vila, Vanuatu, Republic of Vanuatu.
Email: support@tmgm.com
Trademax Global Markets (SE) Limited, trading as TMGM, is authorized and regulated by the Financial Services Authority (FSA) of Seychelles, with license number SD224. The company is registered at Office No 13, Providence Estate ABIS Centre, Mahe, Seychelles.
Email: support@tmgm.com
Trademax Global Markets (International) Pty Ltd, trading as TMGM, is authorized and regulated by the Financial Services Commission, Mauritius (FSC) with license no. GB22201012, and registered at 33, Edith Cavell Street C/o IQ EQ Fund Services (Mauritius) Ltd Port Louis, 11324 Mauritius.
Email: support@tmgm.com
Copyright © TMGM. All rights reserved