

Trading
Explore a wide range of markets with competitive pricing, deep liquidity, and advanced trading tools.
Learn More 
Platform
Trade seamlessly with TMGM's powerful platform, built for speed, precision, and a superior trading experience.
Learn More Trading Platform
Academy
Learn the fundamentals of trading with beginner-friendly resources, including guides, webinars, and market insights.
Learn More News & Analysis
Get real-time market updates and expert analysis to stay ahead of trading opportunities
Learn More News & Analysis
About
Learn what sets TMGM apart — our global presence, regulatory strength, and commitment to innovation in trading.
Learn More Why Choose TMGM
Sponsorship
3 Top Price Predictions: Bitcoin, Ethereum, Ripple – November opens with BTC, ETH and XRP rebounding after October losses
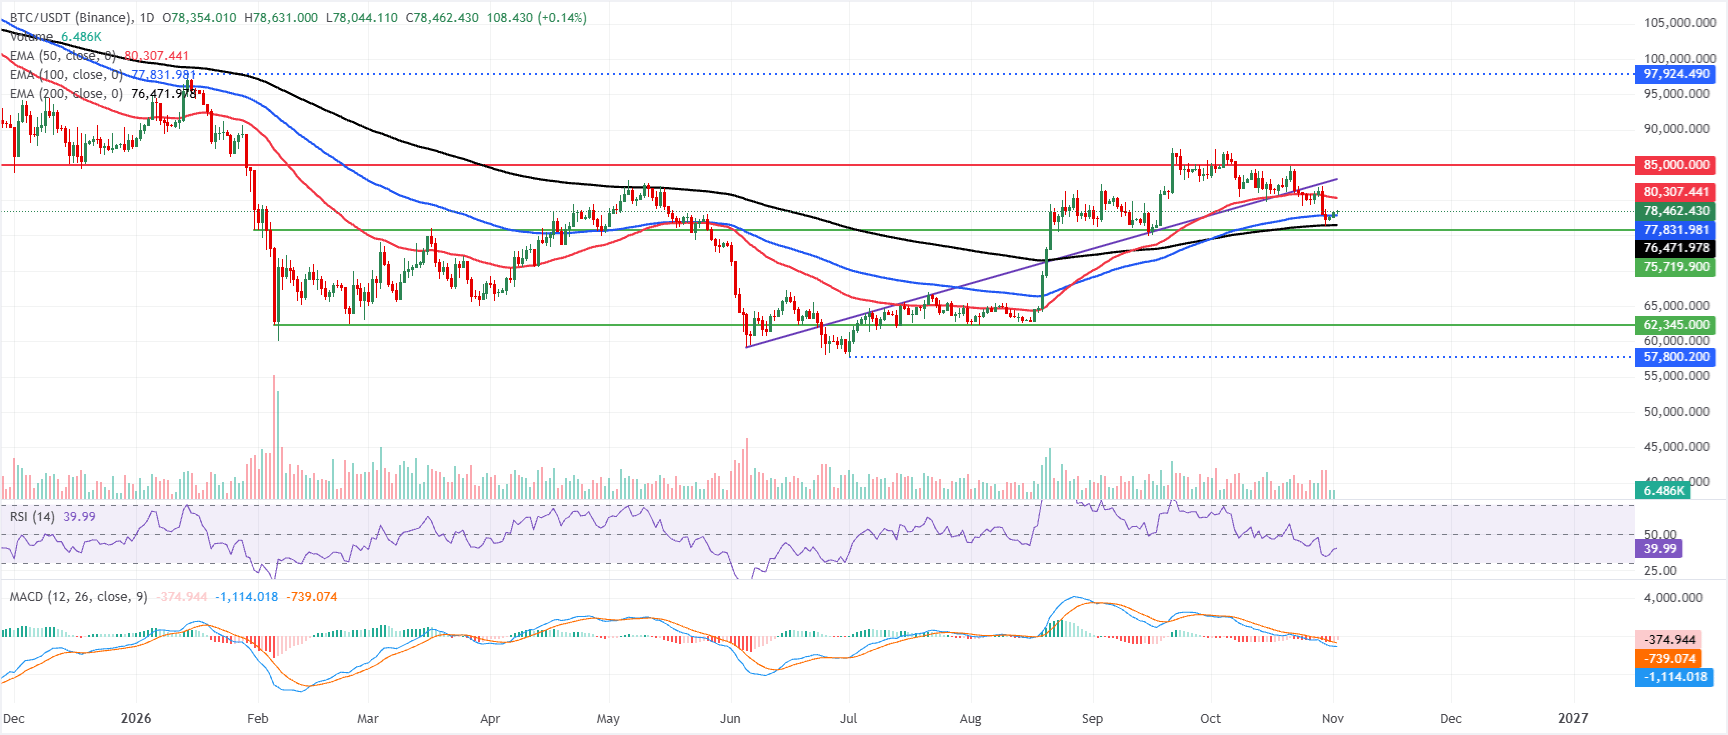
- $78,462 is the level Bitcoin trades above on Monday. Its recovery continues after support emerged around the 100-day and 200-day EMAs.
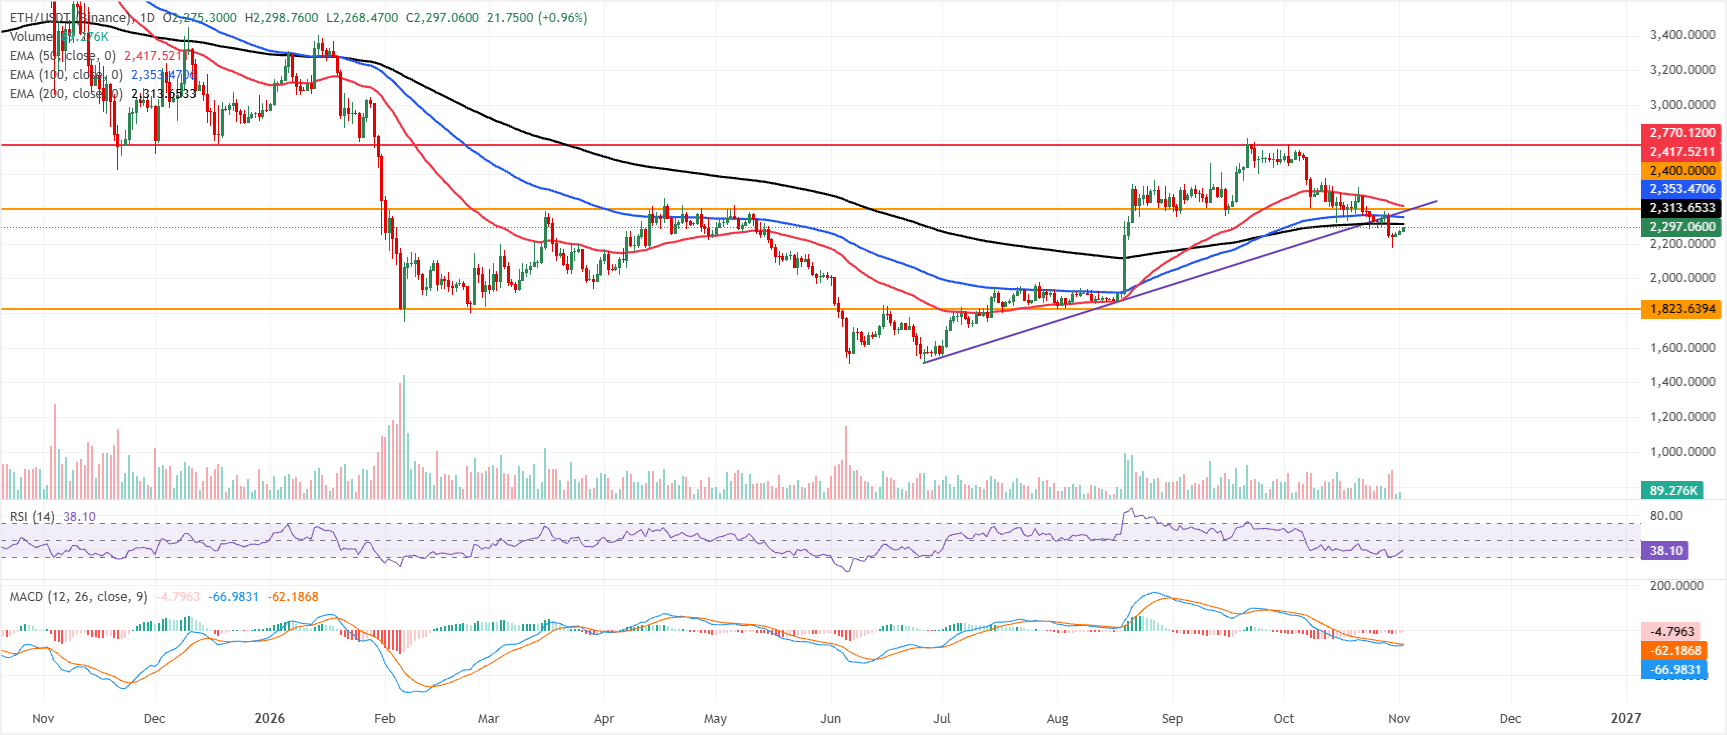
- $2,295 is the level Ethereum's rebound has taken it above. However, trading below key EMAs leaves the near-term outlook bearish.
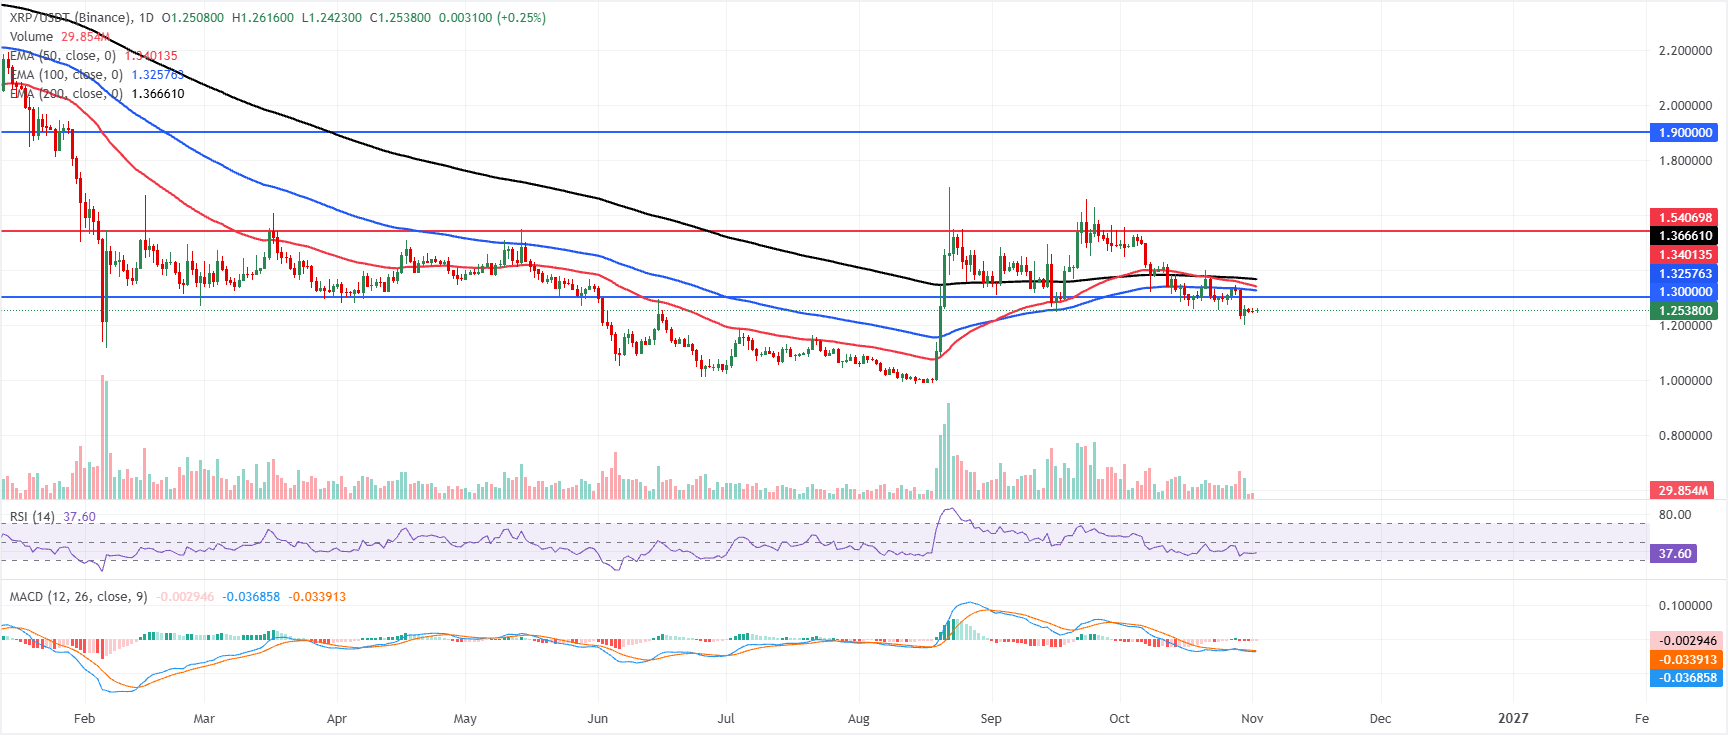
- $1.25 is XRP's approximate trading level on Monday, following a decline of over 3.5% last week.
$78,462 is the level Bitcoin (BTC) climbs above on Monday. Bitcoin, Ethereum and Ripple (XRP) stage modest recoveries after ending October with four consecutive weeks of declines. Support around key zones underpins BTC, while ETH rebounds above $2,295. However, Ethereum remains below key Exponential Moving Averages (EMAs), leaving its short-term outlook bearish. XRP, meanwhile, consolidates around $1.25 after paring losses. Traders are assessing whether the early November recovery can build momentum.

$78,462: Bitcoin supported by key EMAs
$78,462 is Bitcoin's trading price on Monday. Consolidation between key Exponential Moving Averages (EMAs) comes as the short-term bias turns mildly negative. Attempts to revive the previous uptrend face immediate resistance at the 50-day EMA of $80,307. Below the market, the 100-day EMA at $77,831 and the 200-day EMA at $76,471 suggest the broader structure remains constructive.
A Relative Strength Index (RSI) reading near 40 and a negative Moving Average Convergence Divergence (MACD) point to subdued momentum. These signals indicate weakening bullish pressure rather than outright capitulation.
To clear the way for a return towards horizontal resistance at $85,000, Bitcoin would first need to breach the 50-day EMA at $80,307. Sellers recently appeared at that $85,000 level.
Below the market, the 100-day EMA near $77,831 provides the first support. The more significant structural floor follows at the 200-day EMA around $76,471.
Range-bound trading remains likely while BTC stays above the longer-term EMAs but below the 50-day EMA. A daily close under $76,471 would strengthen the case for a deeper correction. Conversely, a sustained advance beyond $80,307 would restore a bullish bias.
$2,295: Ethereum remains beneath key EMAs
$2,295 is Ethereum's trading price on Monday. Its position below key EMAs sustains a bearish short-term bias. Overhead resistance comes from the 200-day EMA at $2,313 and the 100-day EMA at $2,353. The previous ascending trendline breakdown level of $2,385 adds to that pressure.
Although above oversold territory, the RSI remains weak at 37. With the MACD also negative, recovery attempts would likely attract selling near resistance.
The first upside hurdle is the 200-day EMA around $2,313. Next come the 100-day EMA at $2,353 and the broken trendline pivot near $2,385. Further gains would encounter horizontal resistance at $2,400 before the 50-day EMA at $2,417, followed by a more distant ceiling at $2,770.
Should the pullback deepen, the next significant downside support is the horizontal level near $1,823. Buyers would be expected to defend the broader uptrend structure there.
$1.253: XRP consolidates beneath key EMAs
$1.253 is XRP's trading price on Monday. Remaining beneath key EMAs leaves its short-term bias bearish. The 100-day EMA at $1.325, the 50-day EMA at $1.340 and the 200-day EMA at $1.366 all provide overhead resistance, suggesting limited upside following the recent pullback.
An RSI reading near 37 and a marginally negative MACD signal fragile momentum. Sellers appear to retain control even as the decline slows.
Any advance first faces the psychological resistance level of $1.300. Beyond that, the 100-day EMA at $1.325 and the 50-day EMA at $1.340 create a nearby supply zone.
The broader bearish structure is reinforced by the higher 200-day EMA at $1.366. A break above $1.540 would be required to reduce downside pressure and clear a route towards the more distant horizontal resistance at $1.900. With current levels offering no clearly defined support, additional losses would send XRP looking for fresh demand below $1.250 before a sustainable recovery could take shape.
(The technical analysis of this story was written with the help of an AI tool. Know more.)
Cryptocurrency prices: frequently asked questions
Demand and adoption among market participants are influenced by token launches. When an asset is listed on a crypto exchange, its liquidity increases and its network gains new participants. These developments are generally bullish for a digital asset.
During a hack, an attacker uses exploits, bugs or other methods to seize a large quantity of an asset from a DeFi bridge or a hot wallet belonging to an exchange or another crypto platform. The stolen tokens are then moved off exchange platforms, ultimately to be sold or exchanged for other cryptocurrencies or stablecoins. Widespread panic often follows, triggering a sell-off in the affected assets.
The direct effect on the US Dollar is the main channel through which macroeconomic events, such as interest-rate decisions by the US Federal Reserve, influence crypto assets. Higher interest rates generally weigh on Bitcoin and altcoin prices; lower rates tend to have the opposite effect. A decline in the US Dollar index makes risk assets and the associated trading leverage cheaper, which in turn pushes crypto prices higher.
By cutting miners' block rewards in half, halvings restrict an asset's supply and are generally viewed as bullish events. If demand stays constant while supply falls, the asset's price rises.
POPULAR ARTICLES
1USD/JPY Price Forecast: Multiple Tailwinds Fail to Prevent Japanese Yen Underperformance2Cardano Price Forecast: Key support holds for ADA as bearish pressure builds3Solana Price Forecast: ETF outflows hit a peak as SOL drops below key EMAs4Indian Rupee extends gains as oil prices fall sharply51.3400 Area: GBP/USD Price Forecast Retains Bullish Bias Ahead of Wednesday’s BoE Decision6Above 1.1150: Euro gains as Eurozone GDP tops forecasts and US midterm election approaches7176.50 Area: EUR/JPY Holds Above Nine-Day EMA | Price Forecast8Above $3,900: Gold struggles to extend rebound from YTD low as Fed hike bets limit gains9India Gold price today: FXStreet data show prices moving higher

Get Started!
Sign up and access the Global Markets in less than 3 minutes

Connect With Us









Contacts
Phone: +61 2 8036 8388
Fax: +61 2 8036 8388
Email: support@tmgm.com



The information provided on this website is of a general nature only and does not constitute personal financial advice. Before acting on any information on this website, you should consider the suitability of the information in relation to your objectives, financial situation and needs. Investing in CFDs and FX Margin Contracts carries significant risks and is not suitable for all investors. You may lose more than your initial deposit. You do not own, or have, any interest in the underlying asset. We recommend that you seek independent advice and ensure you fully understand the risks involved before trading. It is important that you read and consider the disclosure document before you acquire any product listed on the website. The information and advertisements offered on this website are not intended for use by any person in any country or jurisdiction where such use would be contrary to local laws and regulations. The Products and Services offered on this website are not intended for residents of the United States, Malaysia and Thailand.
TMGM is authorized and regulated in various jurisdictions.
Trademax Australia Limited, trading as TMGM, is regulated by the Australian Securities and Investments Commission (ASIC), AFSL no. 436416 and is located at Level 28, One International Tower, 100 Barangaroo Avenue, 2000 Sydney, NSW Australia.
Email: support@tmgm.com.au
Trademax Global Limited, trading as TMGM, is authorized and regulated by the Vanuatu Financial Services Commission (VFSC), registration number 40356 and registered at 1276, Kumul Highway, Port Vila, Vanuatu, Republic of Vanuatu.
Email: support@tmgm.com
Trademax Global Markets (SE) Limited, trading as TMGM, is authorized and regulated by the Financial Services Authority (FSA) of Seychelles, with license number SD224. The company is registered at Office No 13, Providence Estate ABIS Centre, Mahe, Seychelles.
Email: support@tmgm.com
Trademax Global Markets (International) Pty Ltd, trading as TMGM, is authorized and regulated by the Financial Services Commission, Mauritius (FSC) with license no. GB22201012, and registered at 33, Edith Cavell Street C/o IQ EQ Fund Services (Mauritius) Ltd Port Louis, 11324 Mauritius.
Email: support@tmgm.com
Copyright © TMGM. All rights reserved