
News & AnalysisCareer

US midterm election results point to divided government and a greater risk of political deadlock in Washington, helping Gold (XAU/USD) recover above $4,000 on Wednesday. The metal is rallying, with XAU/USD around $4,041 at the time of writing, a gain of 3% on the day.

With Democrats taking control of both houses of Congress, the Trump administration will require their backing for new legislation, spending packages, additional tax cuts and any increase in the debt ceiling.
As political uncertainty renews demand for gold as a safe haven, it is also putting pressure on the US Dollar, reducing the cost of bullion for holders of other currencies. Near five-week lows, the US Dollar Index (DXY) stands at around 101.40, a daily decline of 0.44%. The index measures the Greenback against a basket of six major currencies.
Elevated energy costs stemming from Middle East tensions continue to fuel inflationary pressure, reinforcing the hawkish stance of the Federal Reserve (Fed) and other major central banks. That backdrop may make gold’s recovery difficult to sustain: higher borrowing costs increase the opportunity cost of owning the non-yielding metal.
Despite the Democrats’ blue wave in the US, strategists at Societe Generale say it “should not change the direction of travel for the Fed, at least not in the short term,” and continue to regard “a 25bp rate increase in December” as “a high probability event.” Ahead of the Treasury’s quarterly refunding announcement later today, they highlight that “futures for June -27 flatten to 55.5bp (-2.5bp)” and “the 2s/10s curve trades flat at 33bp,” in their assessment of markets.
On fiscal policy, however, Societe Generale’s economics team warns that, “with regard to the US fiscal trajectory,” they “see greater risk of government shutdown,” which they suggest “may explain the rebound in Gold to over $4000.”
The CME FedWatch Tool puts the probability of a December rate increase priced in by traders at 82%. Expectations of additional tightening could also help limit losses in the US Dollar.
Upcoming US economic releases will be watched for further indications of the Fed’s policy direction. The ADP Employment Change report and October’s ISM Services PMI are due on Wednesday, with weekly Initial Jobless Claims following on Thursday and Nonfarm Payrolls (NFP) on Friday.
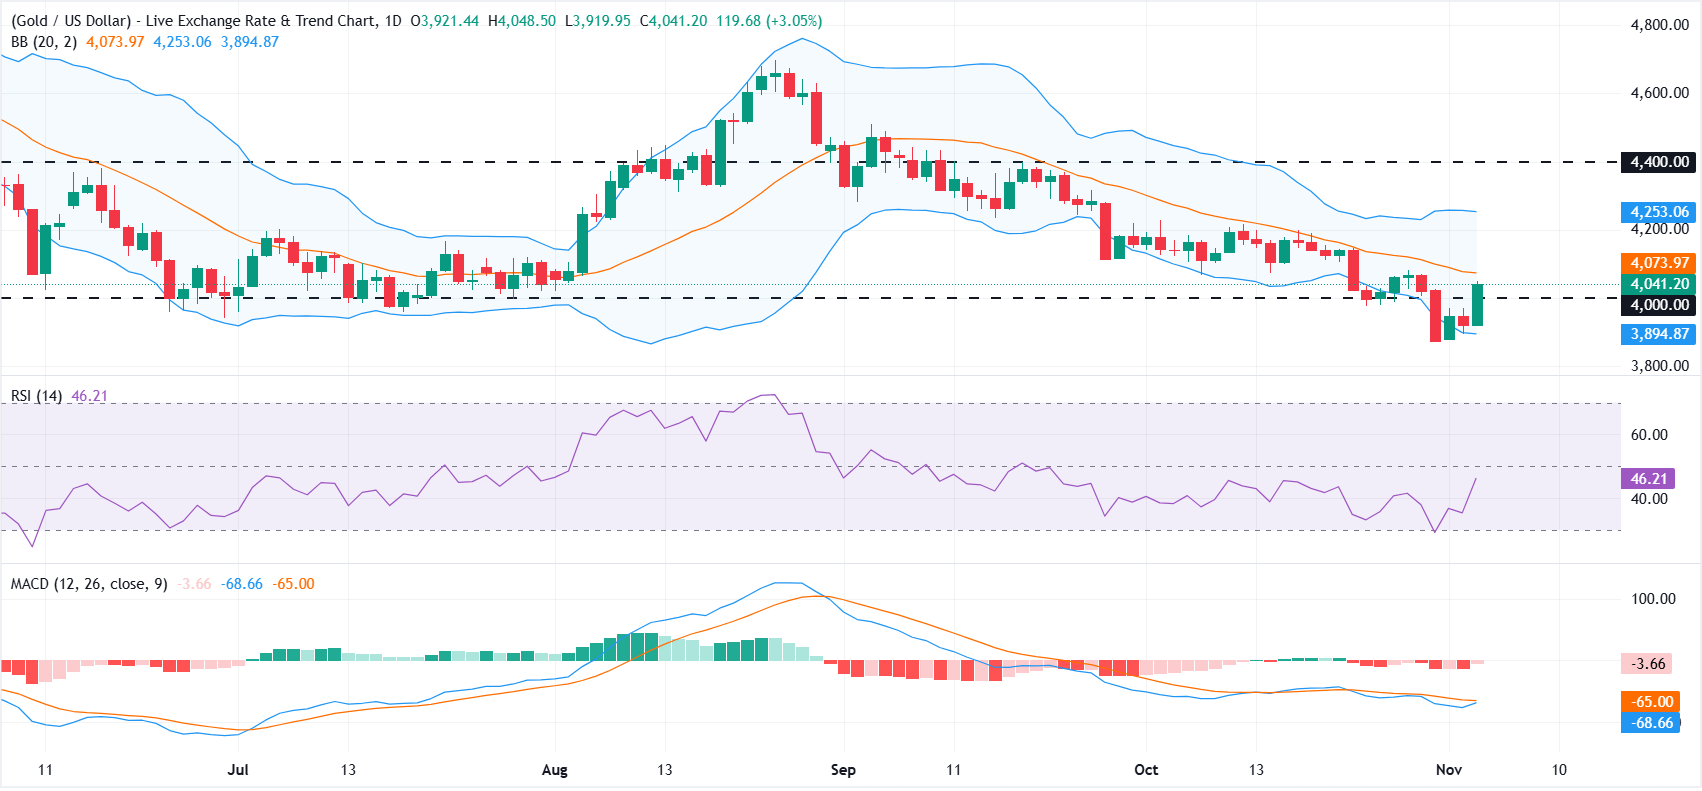
Trading below $4,074, where the 20-day simple moving average (SMA) forms the middle Bollinger band, leaves XAU/USD with a slightly bearish near-term outlook on the daily chart. Resistance at the upper Bollinger band around $4,253 also limits the scope for rallies. Momentum signals remain mixed: the Relative Strength Index (RSI) has recovered to 46 in neutral territory, while the Moving Average Convergence Divergence (MACD) indicator is stabilising but remains negative.
Initial downside support lies at the psychological $4,000 mark. Below that, the lower Bollinger band around $3,894 precedes last week’s yearly low of $3,870. A close above the middle Bollinger band at $4,074 would reduce downward pressure, although the upper band near $4,253 offers firmer resistance, followed by the broader structural barrier at $4,400.
(An AI tool assisted in writing the technical analysis for this article. Find out more.)
Today’s percentage moves in the US Dollar (USD) against the major currencies listed are set out below. The Japanese Yen was the currency against which the US Dollar performed most strongly.
| USD | EUR | GBP | JPY | CAD | AUD | NZD | CHF | |
|---|---|---|---|---|---|---|---|---|
| USD | -0.44% | -0.45% | -0.11% | -0.33% | -0.63% | -0.28% | -0.39% | |
| EUR | 0.44% | -0.01% | 0.32% | 0.10% | -0.20% | 0.15% | 0.05% | |
| GBP | 0.45% | 0.01% | 0.34% | 0.14% | -0.17% | 0.17% | 0.06% | |
| JPY | 0.11% | -0.32% | -0.34% | -0.21% | -0.52% | -0.19% | -0.29% | |
| CAD | 0.33% | -0.10% | -0.14% | 0.21% | -0.31% | 0.03% | -0.08% | |
| AUD | 0.63% | 0.20% | 0.17% | 0.52% | 0.31% | 0.34% | 0.23% | |
| NZD | 0.28% | -0.15% | -0.17% | 0.19% | -0.03% | -0.34% | -0.10% | |
| CHF | 0.39% | -0.05% | -0.06% | 0.29% | 0.08% | -0.23% | 0.10% |
Percentage movements between the major currencies are displayed in the heat map. Select the base currency in the left-hand column and the quote currency in the top row. Choosing the US Dollar on the left and following that row across to the Japanese Yen, for instance, gives the percentage change for USD (base)/JPY (quote) in the corresponding cell.







Phone: +61 2 8036 8388
Fax: +61 2 8036 8388
Email: support@tmgm.com



The information provided on this website is of a general nature only and does not constitute personal financial advice. Before acting on any information on this website, you should consider the suitability of the information in relation to your objectives, financial situation and needs. Investing in CFDs and FX Margin Contracts carries significant risks and is not suitable for all investors. You may lose more than your initial deposit. You do not own, or have, any interest in the underlying asset. We recommend that you seek independent advice and ensure you fully understand the risks involved before trading. It is important that you read and consider the disclosure document before you acquire any product listed on the website. The information and advertisements offered on this website are not intended for use by any person in any country or jurisdiction where such use would be contrary to local laws and regulations. The Products and Services offered on this website are not intended for residents of the United States, Malaysia and Thailand.
TMGM is authorized and regulated in various jurisdictions.
Trademax Australia Limited, trading as TMGM, is regulated by the Australian Securities and Investments Commission (ASIC), AFSL no. 436416 and is located at Level 28, One International Tower, 100 Barangaroo Avenue, 2000 Sydney, NSW Australia.
Email: support@tmgm.com.au
Trademax Global Limited, trading as TMGM, is authorized and regulated by the Vanuatu Financial Services Commission (VFSC), registration number 40356 and registered at 1276, Kumul Highway, Port Vila, Vanuatu, Republic of Vanuatu.
Email: support@tmgm.com
Trademax Global Markets (SE) Limited, trading as TMGM, is authorized and regulated by the Financial Services Authority (FSA) of Seychelles, with license number SD224. The company is registered at Office No 13, Providence Estate ABIS Centre, Mahe, Seychelles.
Email: support@tmgm.com
Trademax Global Markets (International) Pty Ltd, trading as TMGM, is authorized and regulated by the Financial Services Commission, Mauritius (FSC) with license no. GB22201012, and registered at 33, Edith Cavell Street C/o IQ EQ Fund Services (Mauritius) Ltd Port Louis, 11324 Mauritius.
Email: support@tmgm.com
Copyright © TMGM. All rights reserved


