
News & AnalysisCareer

At $0.95 on Monday, Ripple (XRP) edges lower, with sellers retaining much of the control. In keeping with the wider crypto market, bullish efforts to regain the upper hand have met with increasing failure over recent weeks.

Levels last recorded in November 2024 are again in view for XRP, underscoring substantial and sustained overhead pressure. Reflecting the wider sell-off, perpetual futures Open Interest (OI) has declined from 2.13 billion XRP the previous day to approximately 2.06 billion XRP on Monday.
The notional value of XRP futures positions still open and unsettled in the derivatives market is measured by OI. Put another way, it indicates how much money is currently exposed to XRP price movements through futures and options contracts.
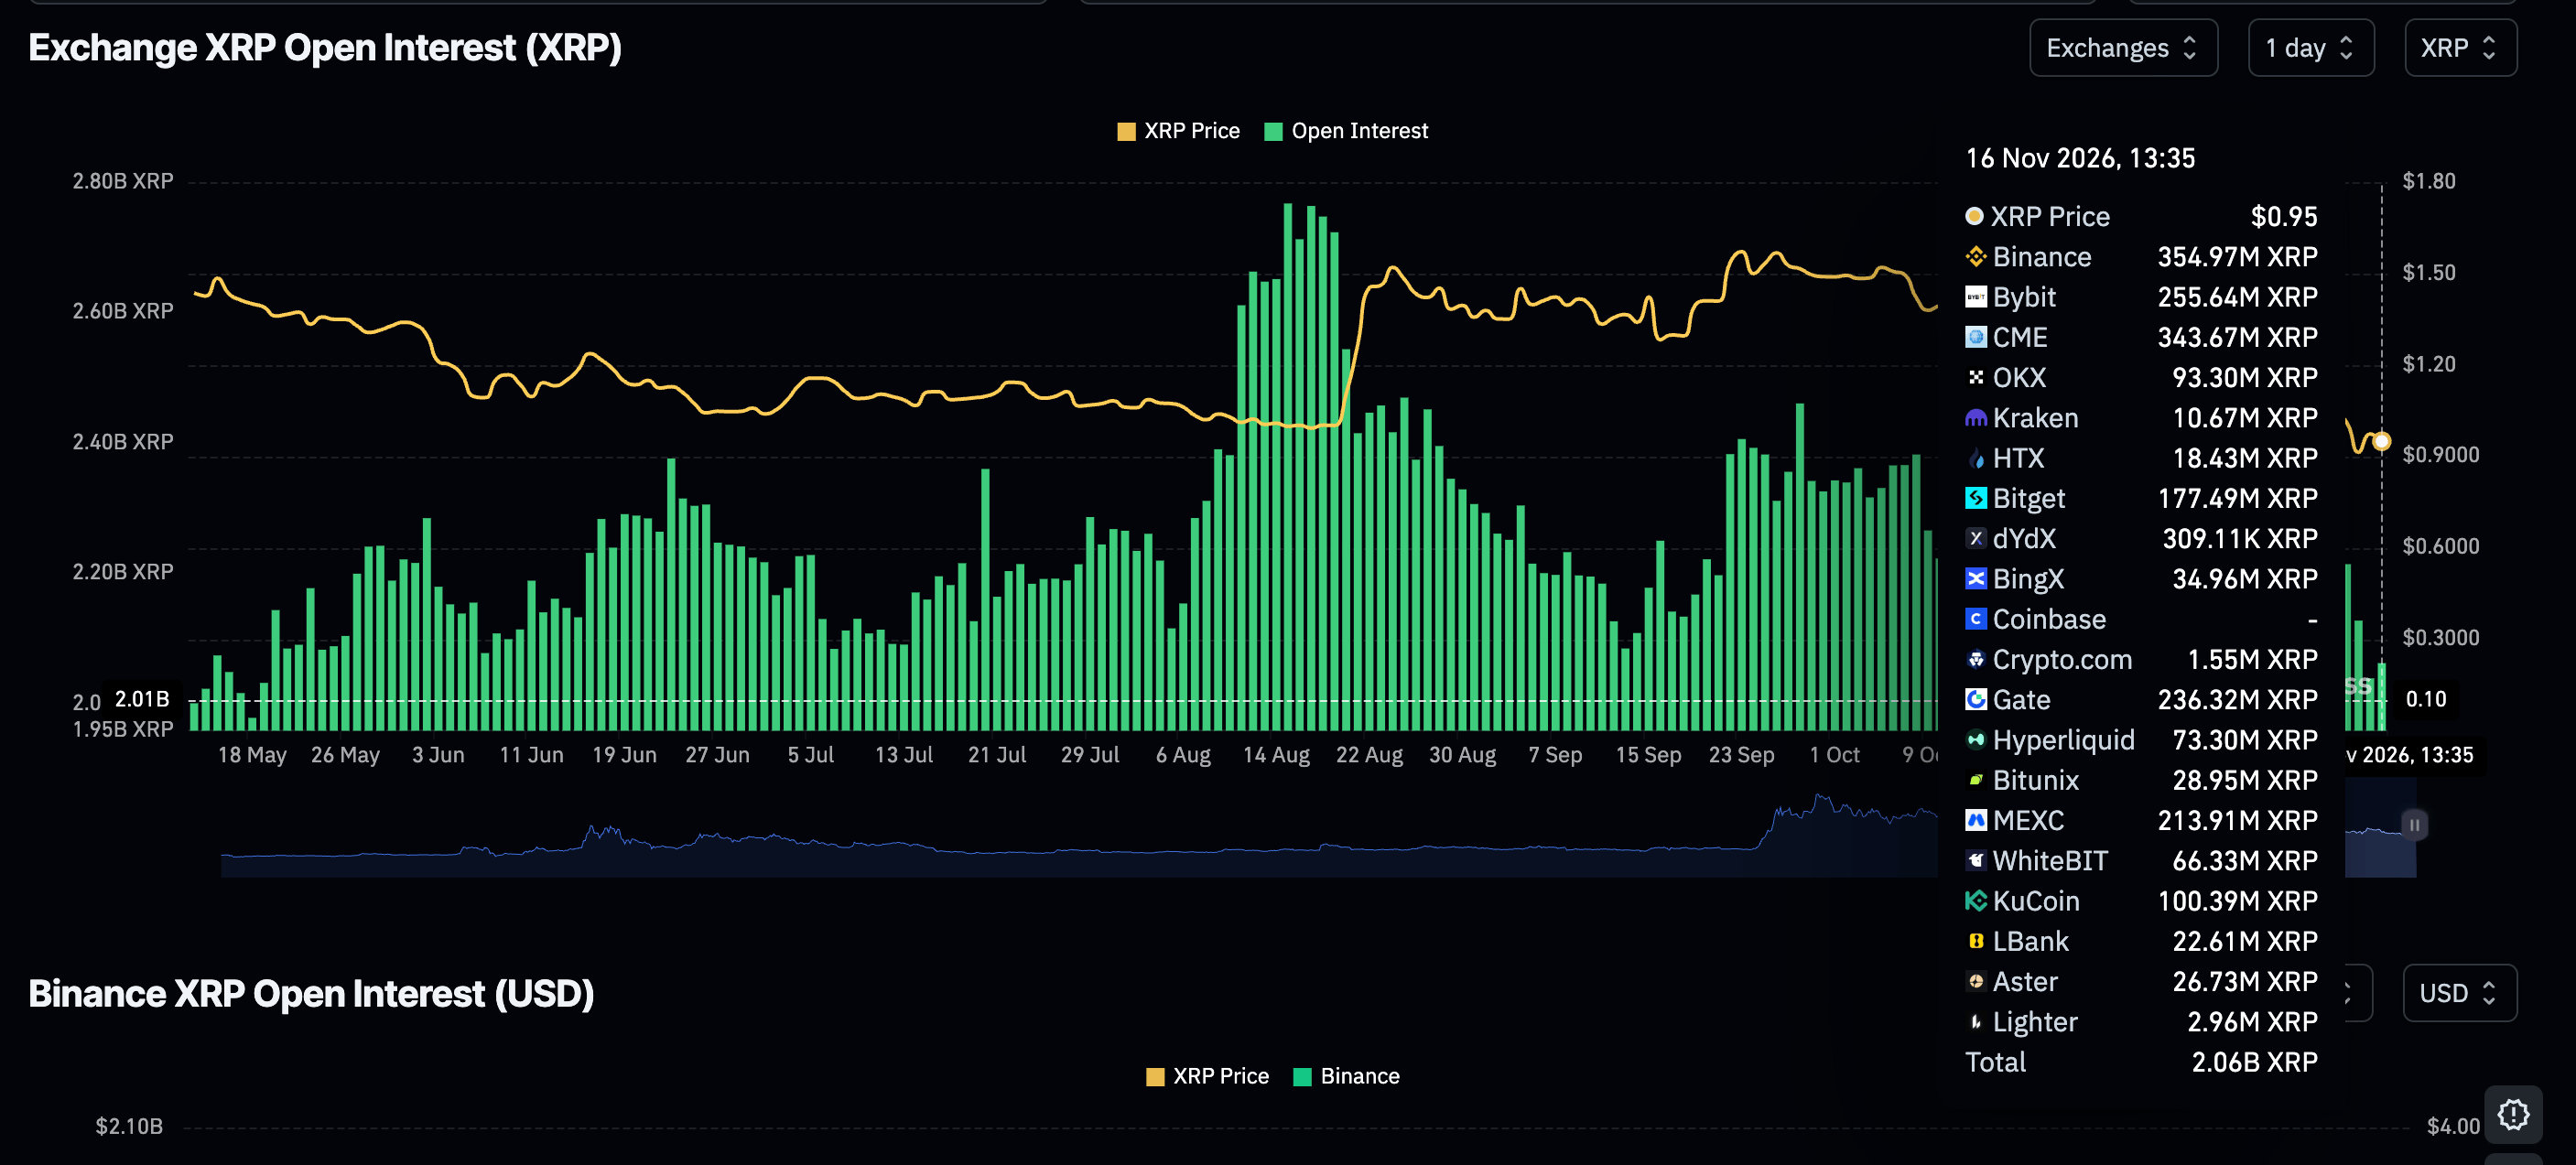
Weaker retail participation is implied by the persistent softness in derivatives activity. This often weighs on prices, particularly when more traders are taking short positions and liquidations of long positions are increasing. According to CoinGlass, roughly $2.45 million in long positions have been liquidated, against $1.18 million in short positions.
At $0.95, XRP retains a bearish short-term bias, trading well below the 50-day, 100-day and 200-day Exponential Moving Averages (EMAs), which are grouped between approximately $1.23 and $1.33.
Further overhead resistance comes from the SuperTrend line at $1.13, keeping the price constrained even as momentum shows some signs of stabilisation. The Relative Strength Index (RSI) remains close to 25 in oversold territory, while a slightly less negative Moving Average Convergence Divergence (MACD) histogram points to easing selling pressure rather than confirmation of a reversal.
The SuperTrend level near $1.13 provides the first resistance hurdle. Beyond it sit the 50-day EMA at $1.23 and the break point of the descending resistance trendline at around $1.24.
Further up, a wider supply zone is marked by the 100-day EMA at $1.27 and the 200-day EMA at $1.33. Reclaiming this area would be necessary to temper the prevailing bearish outlook. On the downside, no nearby support levels have been mapped, leaving the pair exposed to fresh lows should selling pressure return.
(The technical analysis of this story was written with the help of an AI tool. Know more.)
An increase in Open Interest is linked to greater liquidity and fresh capital entering the market. It is viewed as an improvement in efficiency, with the prevailing trend continuing. Conversely, falling Open Interest is regarded as evidence of market liquidation: investors are withdrawing and aggregate demand for an asset is weakening, reinforcing bearish sentiment.
By raising the liquidation risks traders face, funding fees narrow the gap between an asset's spot price and its futures contract prices. When a funding rate remains high and positive, it suggests that market participants are bullish and anticipate a price increase. A persistently negative rate, by contrast, signals bearish sentiment: traders expect the cryptocurrency's price to decline, and a bearish trend reversal is likely.







Phone: +61 2 8036 8388
Fax: +61 2 8036 8388
Email: support@tmgm.com



The information provided on this website is of a general nature only and does not constitute personal financial advice. Before acting on any information on this website, you should consider the suitability of the information in relation to your objectives, financial situation and needs. Investing in CFDs and FX Margin Contracts carries significant risks and is not suitable for all investors. You may lose more than your initial deposit. You do not own, or have, any interest in the underlying asset. We recommend that you seek independent advice and ensure you fully understand the risks involved before trading. It is important that you read and consider the disclosure document before you acquire any product listed on the website. The information and advertisements offered on this website are not intended for use by any person in any country or jurisdiction where such use would be contrary to local laws and regulations. The Products and Services offered on this website are not intended for residents of the United States, Malaysia and Thailand.
TMGM is authorized and regulated in various jurisdictions.
Trademax Australia Limited, trading as TMGM, is regulated by the Australian Securities and Investments Commission (ASIC), AFSL no. 436416 and is located at Level 28, One International Tower, 100 Barangaroo Avenue, 2000 Sydney, NSW Australia.
Email: support@tmgm.com.au
Trademax Global Limited, trading as TMGM, is authorized and regulated by the Vanuatu Financial Services Commission (VFSC), registration number 40356 and registered at 1276, Kumul Highway, Port Vila, Vanuatu, Republic of Vanuatu.
Email: support@tmgm.com
Trademax Global Markets (SE) Limited, trading as TMGM, is authorized and regulated by the Financial Services Authority (FSA) of Seychelles, with license number SD224. The company is registered at Office No 13, Providence Estate ABIS Centre, Mahe, Seychelles.
Email: support@tmgm.com
Trademax Global Markets (International) Pty Ltd, trading as TMGM, is authorized and regulated by the Financial Services Commission, Mauritius (FSC) with license no. GB22201012, and registered at 33, Edith Cavell Street C/o IQ EQ Fund Services (Mauritius) Ltd Port Louis, 11324 Mauritius.
Email: support@tmgm.com
Copyright © TMGM. All rights reserved


