

USD/CHF Price Forecast: Attempts to reclaim 0.8000 after defending the 100-day SMA
- USD/CHF rebounds after falling to its lowest level since June 17.
- The pair’s technical structure weakens following a break below the 50-day SMA.
- Buyers defend the area around the 100-day SMA at 0.7975.
USD/CHF regains ground on Thursday as the US Dollar (USD) stabilises following the previous day’s broad weakness, which pushed the pair below the 0.8000 psychological mark and to its lowest level since June 17, weakening the near-term bullish structure. At the time of writing, USD/CHF trades around 0.7998 after bouncing from an intraday low of 0.7949.

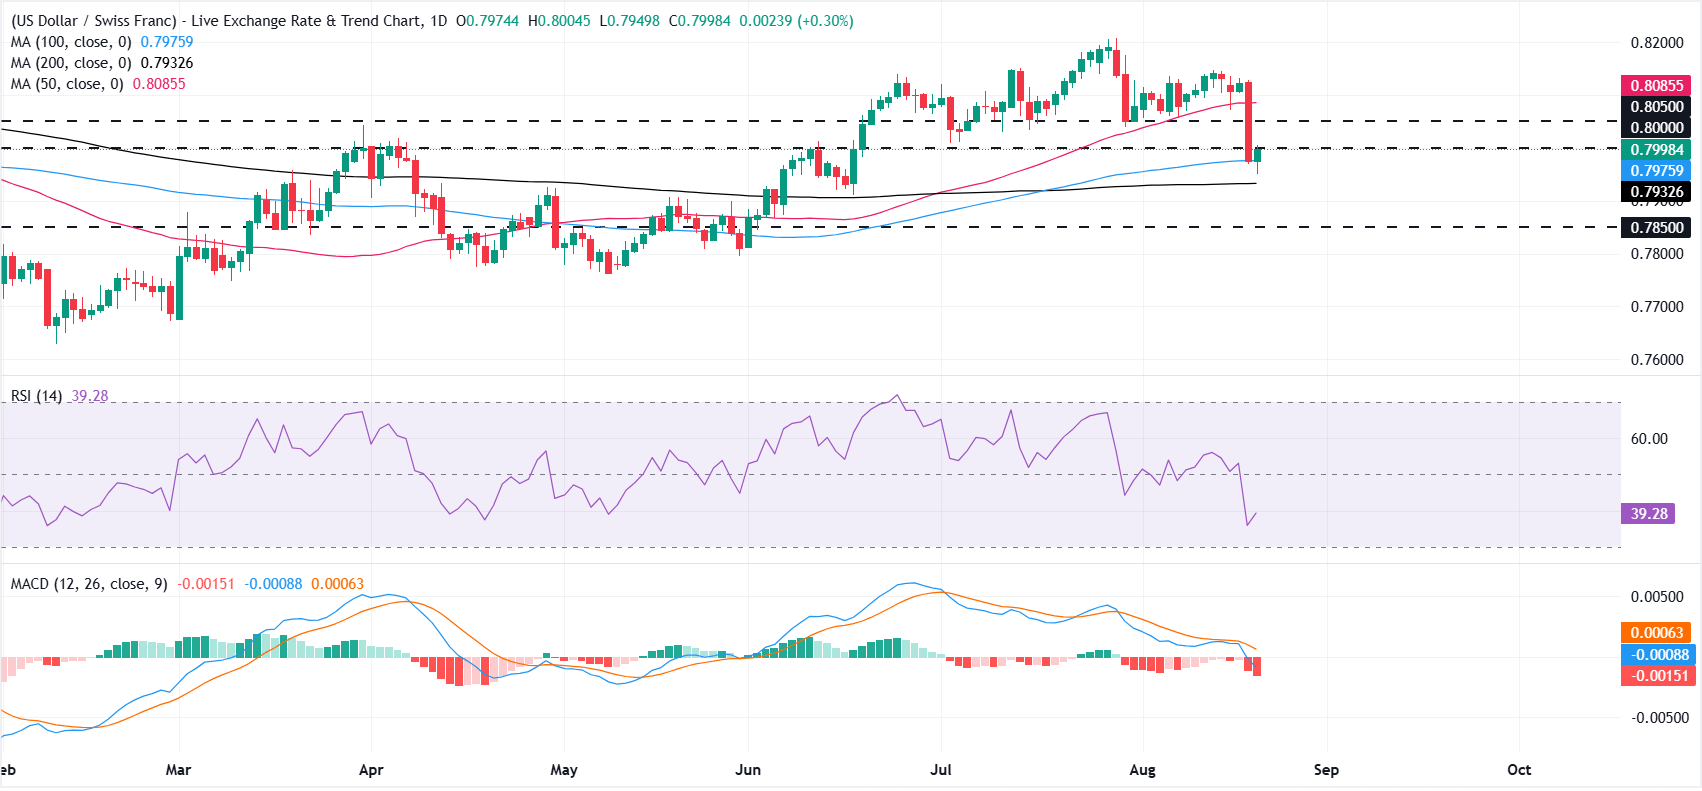
The pair lost 1.83% on Wednesday and slipped below the 50-day Simple Moving Average (SMA) at 0.8085 for the first time since June 2. However, buyers re-emerged after a brief dip below the 100-day SMA at 0.7975, helping the pair regain ground.
USD/CHF is hovering just below the 0.8000 horizontal barrier. Momentum remains fragile, with the Relative Strength Index (RSI) at 38.2 and the Moving Average Convergence Divergence (MACD) holding below zero, suggesting that recovery attempts could struggle against nearby resistance.
On the topside, initial resistance emerges at the 0.8000 mark, followed by the support-turned-resistance zone near 0.8050 and the 50-day SMA at 0.8085. On the downside, the 100-day SMA at 0.7975 offers immediate support, ahead of the 200-day SMA at 0.7933. A deeper decline could expose the horizontal floor at 0.7850.
US Dollar Price Today
The table below shows the percentage change of US Dollar (USD) against listed major currencies today. US Dollar was the strongest against the Japanese Yen.
| USD | EUR | GBP | JPY | CAD | AUD | NZD | CHF | |
|---|---|---|---|---|---|---|---|---|
| USD | -0.03% | -0.23% | 0.44% | -0.22% | 0.05% | -0.24% | 0.29% | |
| EUR | 0.03% | -0.21% | 0.48% | -0.18% | 0.06% | -0.23% | 0.31% | |
| GBP | 0.23% | 0.21% | 0.69% | 0.01% | 0.27% | -0.01% | 0.51% | |
| JPY | -0.44% | -0.48% | -0.69% | -0.66% | -0.39% | -0.70% | -0.16% | |
| CAD | 0.22% | 0.18% | -0.01% | 0.66% | 0.28% | -0.02% | 0.50% | |
| AUD | -0.05% | -0.06% | -0.27% | 0.39% | -0.28% | -0.28% | 0.23% | |
| NZD | 0.24% | 0.23% | 0.00% | 0.70% | 0.02% | 0.28% | 0.55% | |
| CHF | -0.29% | -0.31% | -0.51% | 0.16% | -0.50% | -0.23% | -0.55% |
The heat map shows percentage changes of major currencies against each other. The base currency is picked from the left column, while the quote currency is picked from the top row. For example, if you pick the US Dollar from the left column and move along the horizontal line to the Japanese Yen, the percentage change displayed in the box will represent USD (base)/JPY (quote).










