


Introduction
An ascending triangle is a bullish continuation chart pattern indicating a potential upward breakout while a descending triangle is a bearish continuation chart pattern used in technical analysis to signal a potential breakdown, usually occurring during a downtrend. Both are continuation patterns that compress volatility before explosive moves.
Understanding Ascending & Descending Triangle Chart Patterns
Triangle patterns form when price starts to compress inside a tightening range. That compression shows balance is narrowing and a directional move may follow.
These patterns matter because one side keeps defending a flat level while the other side pushes price closer to that boundary. The result is a breakout setup with a clear invalidation point.
Three triangle types exist: ascending, descending, and symmetrical. Ascending and descending triangles predict breakout direction based on which boundary remains flat. The flat line represents a strong support or resistance level that will nurture a breakout once momentum builds.
What Is an Ascending Triangle Pattern?
An ascending triangle forms when buyers repeatedly push price to the same resistance level while refusing to sell. The horizontal resistance shows sellers defending a specific price. The rising support reveals weakening selling pressure.
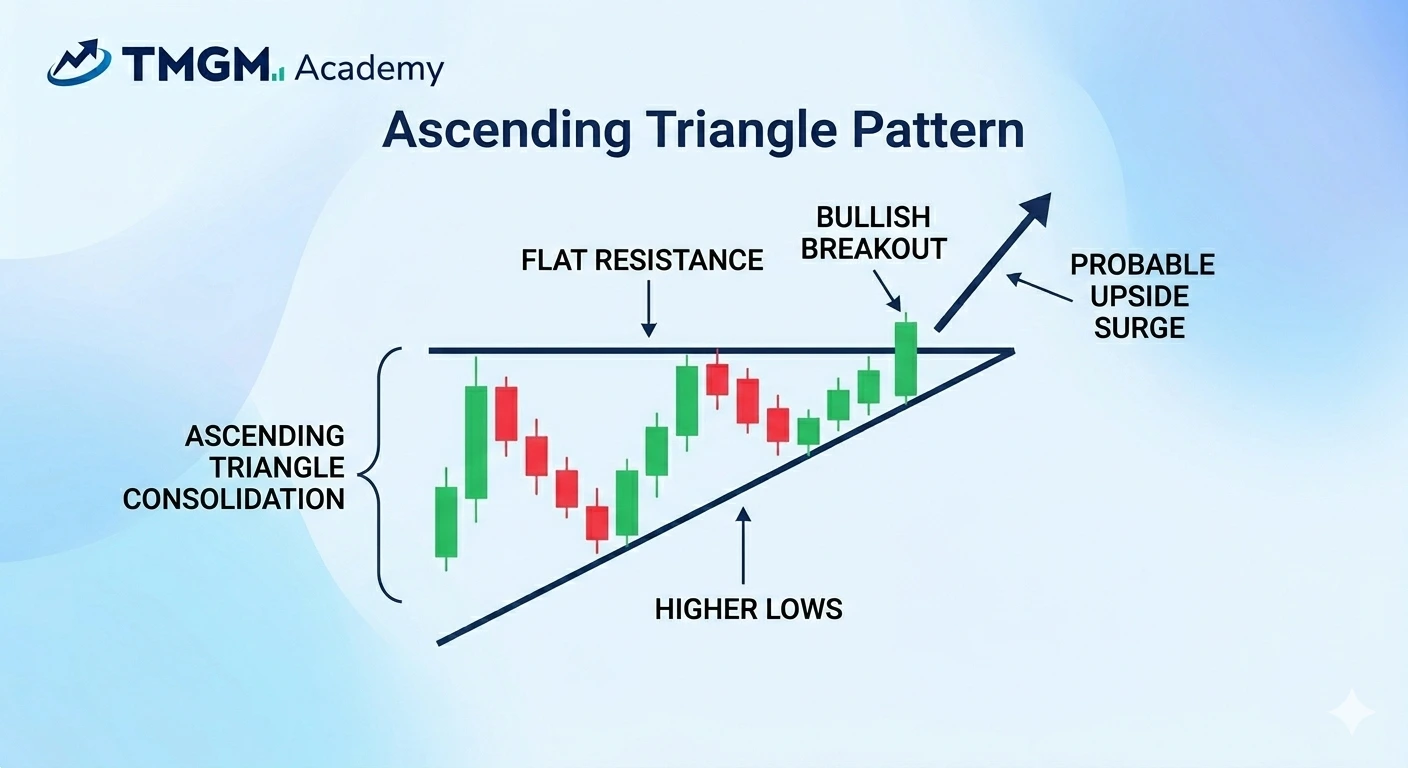
Pro Tip: A retest of broken resistance can offer a cleaner entry than chasing the breakout candle.
What Is a Descending Triangle Pattern?
A descending triangle forms when price makes lower highs into a flat support line. Sellers keep pressing lower while buyers defend one price floor.
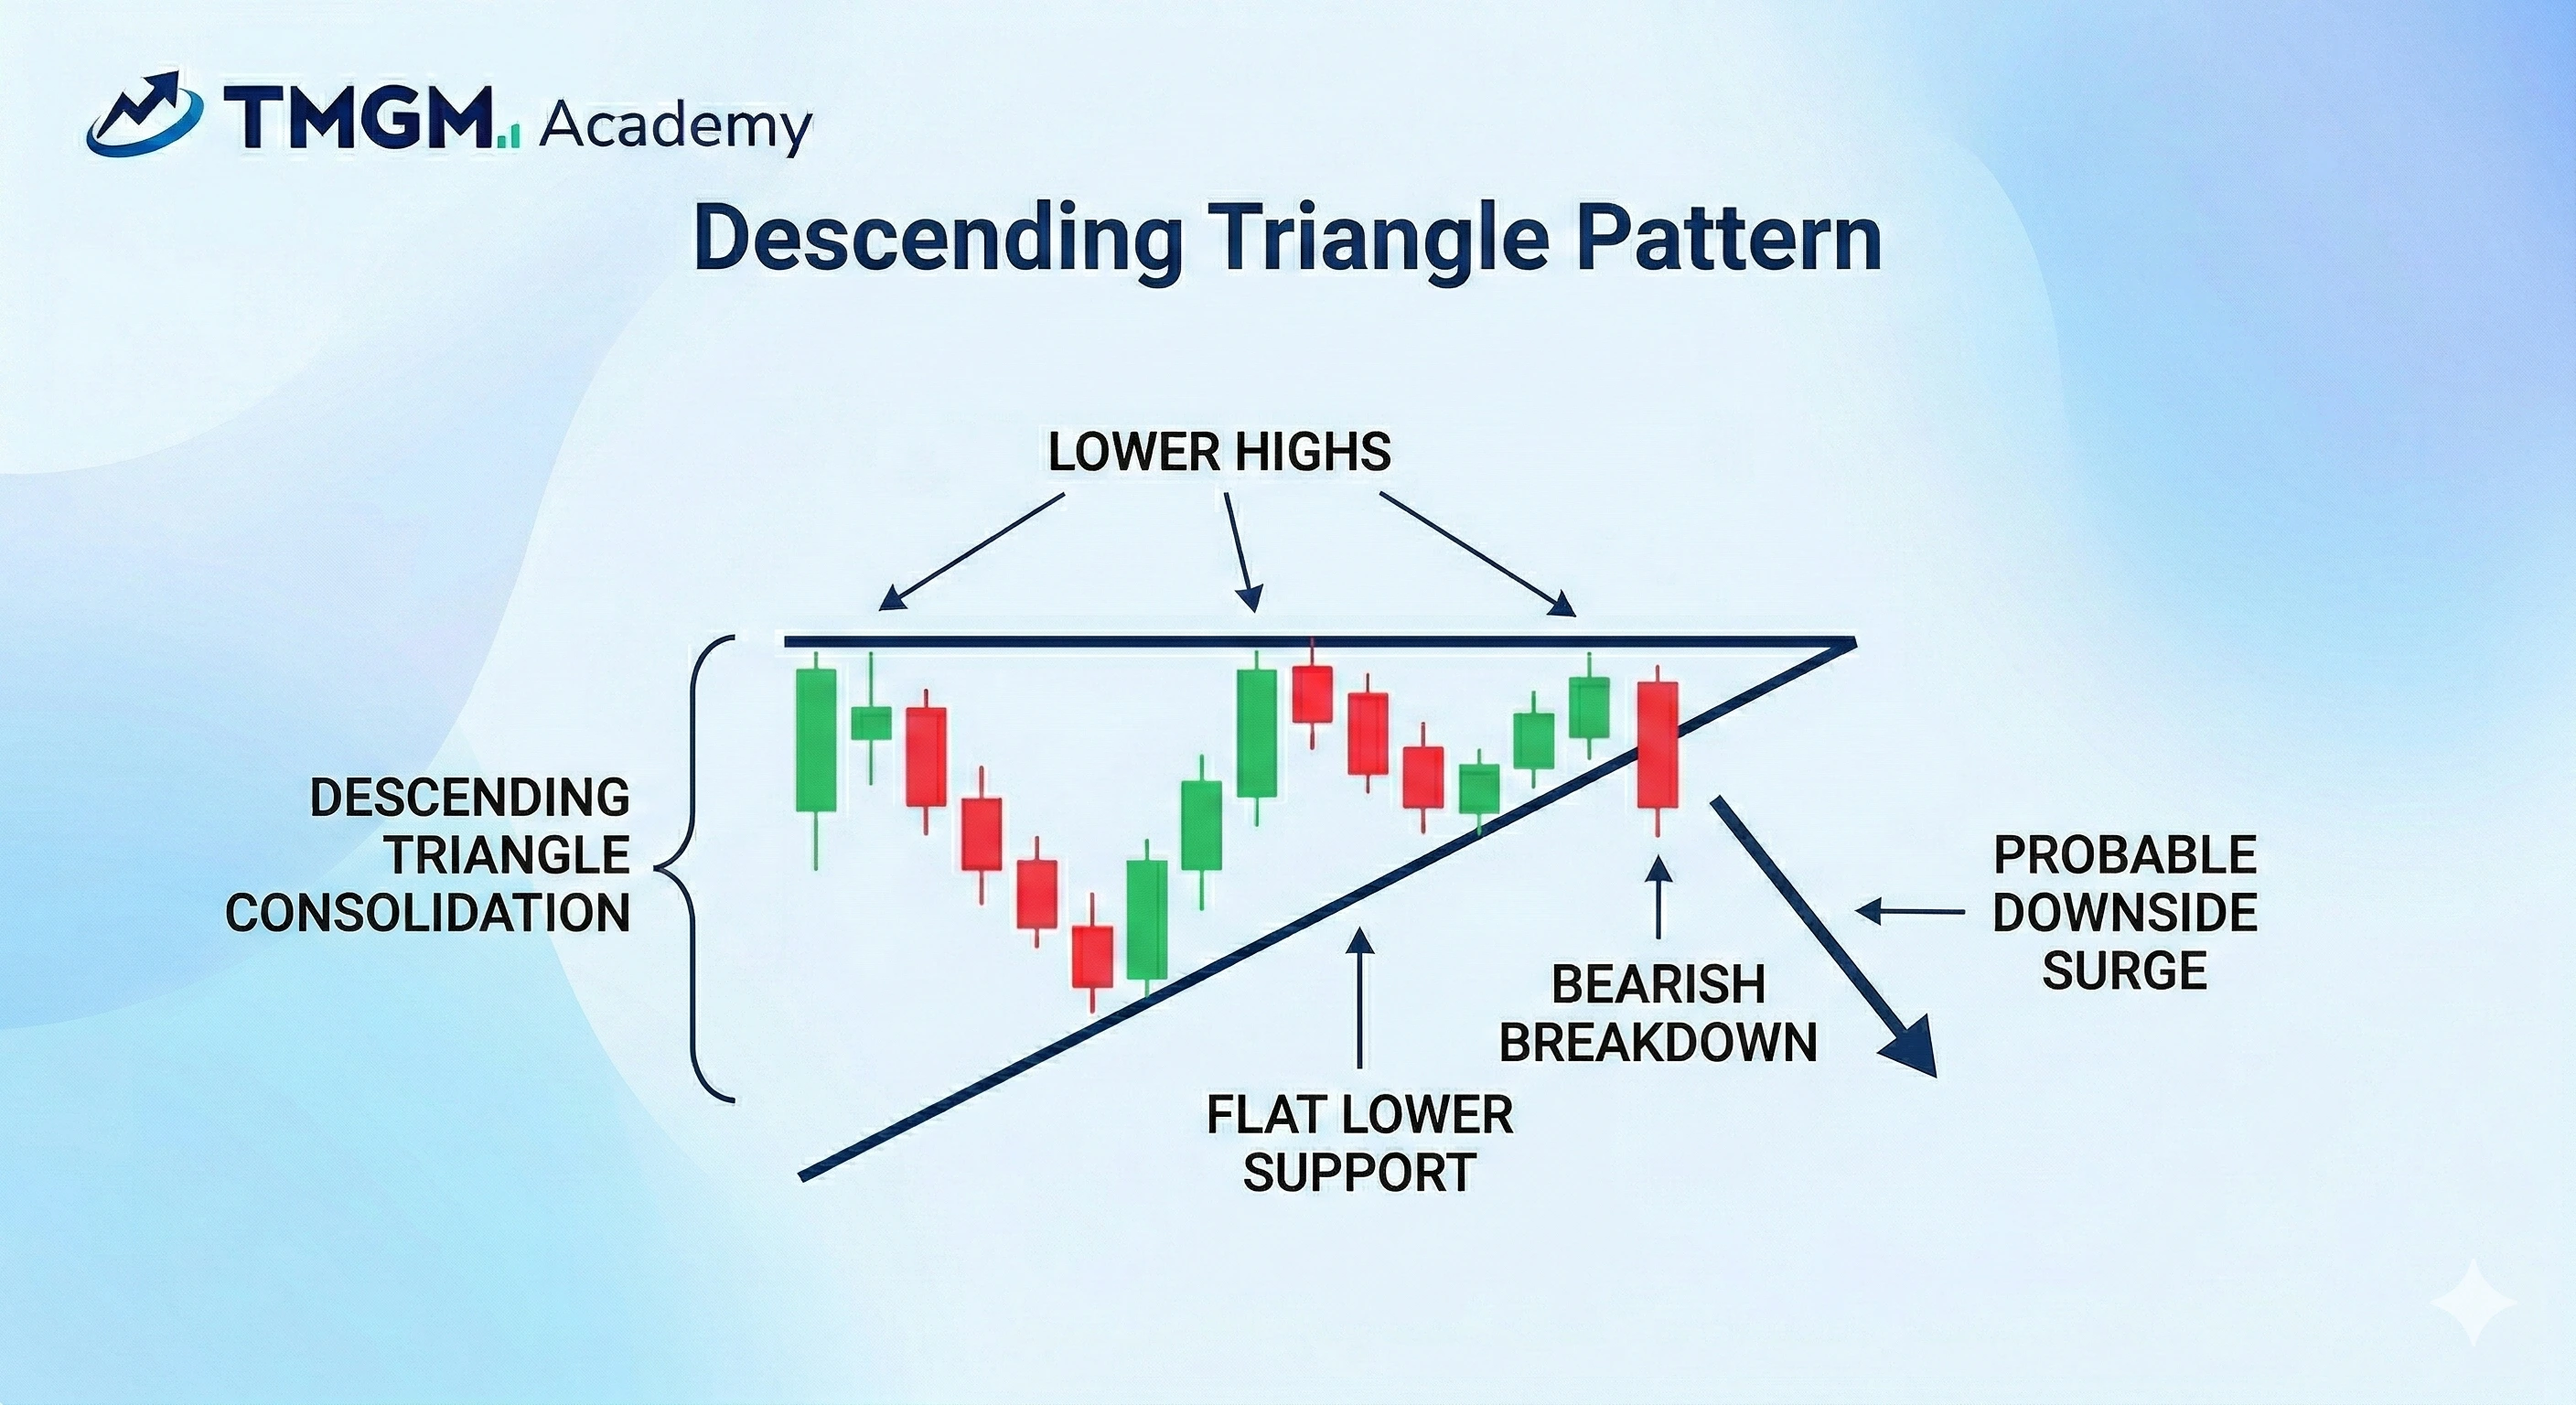
This pattern usually carries more weight when it appears after a downtrend or a weak rebound. The key confirmation is a close below support, not a brief move through it.
Key Differences: Ascending vs Descending Triangles
The structure is the main difference. In an ascending triangle, buyers tighten price under resistance. In a descending triangle, sellers tighten price above support.
How to Identify Ascending & Descending Triangle Patterns
Start with at least two touches on each boundary. The trendlines should narrow as the pattern develops, and the structure should become visibly tighter over time.
Volume often contracts during the formation and expands on the breakout. A triangle that stays wide, breaks too close to the apex, or lacks clear compression is easier to misread.
Check one higher timeframe before acting. A clean pattern on the trading chart is less useful if the breakout runs straight into major higher timeframe resistance or support.
Important: A boundary touch is not confirmation. The trade idea starts only after price closes beyond the pattern.
When Triangle Patterns Work Best
Triangle patterns work best when they pause an existing trend instead of fighting it. The broader trend gives the breakout a clearer directional backdrop.
Context matters as much as shape. Market structure, nearby support or resistance, and overall volatility all affect whether a breakout has room to continue.
Ascending Triangle Pattern Trade in Real-World Example
On this BTCUSD 4 hour chart from around February 2024, price formed an ascending triangle after a strong prior advance. Resistance stayed almost flat across multiple tests, while each pullback held at a higher low. That structure showed buyers were becoming more aggressive even though sellers kept defending the same ceiling.
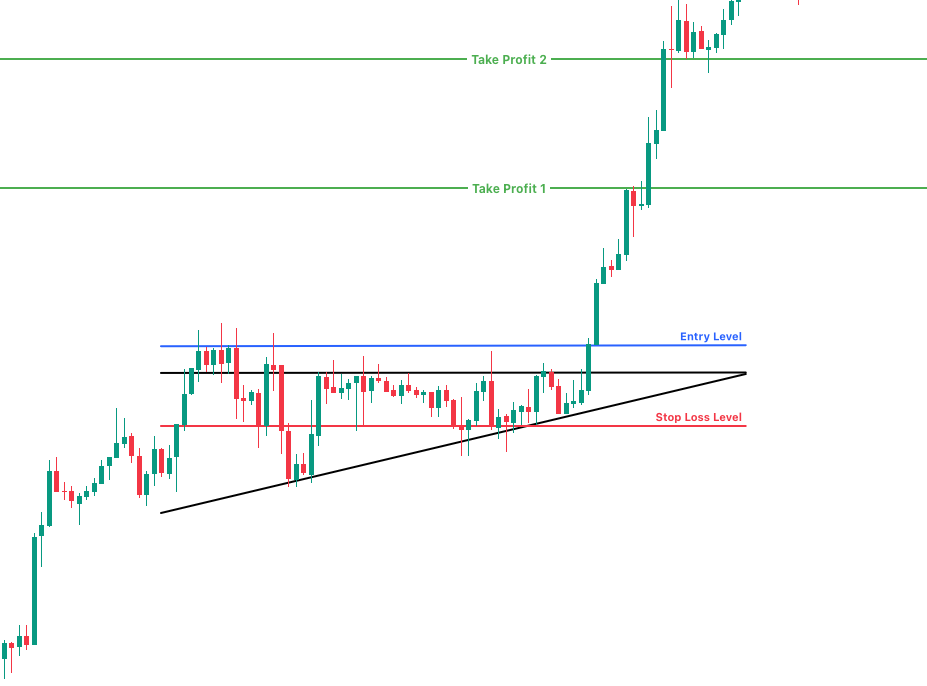
The trade idea was built around confirmation, not anticipation. Entry was placed above the resistance line, while the stop loss sat below the rising support structure and the nearby swing low area. Once BTCUSD closed above the pattern, momentum expanded immediately and price moved through the first take profit level before extending into the second target.
This example shows what a strong ascending triangle looks like in practice. The pattern had repeated resistance tests, rising lows, clear compression, and a breakout candle that left the range with conviction.
It also shows an important execution detail: some valid breakouts do not return for a clean retest, so sometimes, waiting only for a pullback can mean missing the move.
Trading Strategies for Ascending Triangles
Many traders wait for a candle close above resistance before entering. That reduces the chance of buying a breakout that quickly fades.
A common stop goes below the most recent swing low or below the rising support line. A common target projects the height of the pattern from the breakout point.
Some traders use the first breakout. Others wait for a retest of broken resistance that holds as new support. The retest can offer clearer risk placement.
Trading Descending Triangles
Many traders wait for a candle close below support before entering. That reduces the chance of selling a breakdown that snaps back into the range.
A common stop goes above the most recent swing high or above the falling resistance line. A common target projects the height of the pattern below the breakdown point.
Some traders enter on the first break. Others wait for a retest of broken support that fails as new resistance. That retest can improve trade location.
What Mistakes Cause Triangle Trades to Fail?
There are quite a few common mistakes that beginners make when trying to trade this pattern, including:
Entering before the breakout candle closes
Treating any narrowing range as a valid triangle
Ignoring volume and higher timeframe context
Placing stops inside the pattern where normal noise can hit them
Chasing a breakout after most of the move is already gone
A triangle is not useful just because two lines can be drawn around price. The structure must be clear, the context must support it, and the trade must have a logical invalidation point.
What Warning Signs Suggest Pattern Failure?
Rising volume during the formation can be a warning sign because triangles usually tighten as participation fades. Repeated failed breaks can also weaken the pattern by showing hesitation around the boundary.
Momentum divergence can add caution when price keeps pressing toward the breakout side but momentum does not confirm it. Conflict with major higher timeframe structure is another warning sign, especially when the breakout runs directly into a strong barrier.
Ascending and Descending Triangle Pattern FAQs
What is the main difference between ascending and descending triangles?
The main difference is the structure. An ascending triangle has flat resistance and rising support, while a descending triangle has flat support and falling resistance.
How long does it take for a triangle pattern to form?
The answer depends on the timeframe. Intraday triangles can form within hours, while daily and weekly triangles can take days or weeks.
Can triangle patterns fail after breakout?
Yes. A breakout can fail if it lacks conviction, runs into higher timeframe structure, or quickly returns inside the pattern.


