Key Takeaways
Anatomy: The real body displays the open-to-close range, while wicks reveal intra-session price rejections.
Clarity of Control: More candles and stronger closes reduce ambiguity; a single doji signals hesitation, while a three-candle morning star confirms rotation.
Context is King: A pattern is not an automatic signal; it is evidence that requires directional and structural confirmation near key support or resistance.
Strict Execution: Never front-run the close; wait for the candle to print fully before executing based on trading candlestick patterns.
What is Candlestick Pattern?
Candlesticks aka japanese candlestick is a compact record of the open, high, low, and close, designed to show who won the session by where price closes. On a candlestick chart, the close is the “vote” that matters most because it reveals whether buyers or sellers could actually keep control.
Key Components of a Candlestick
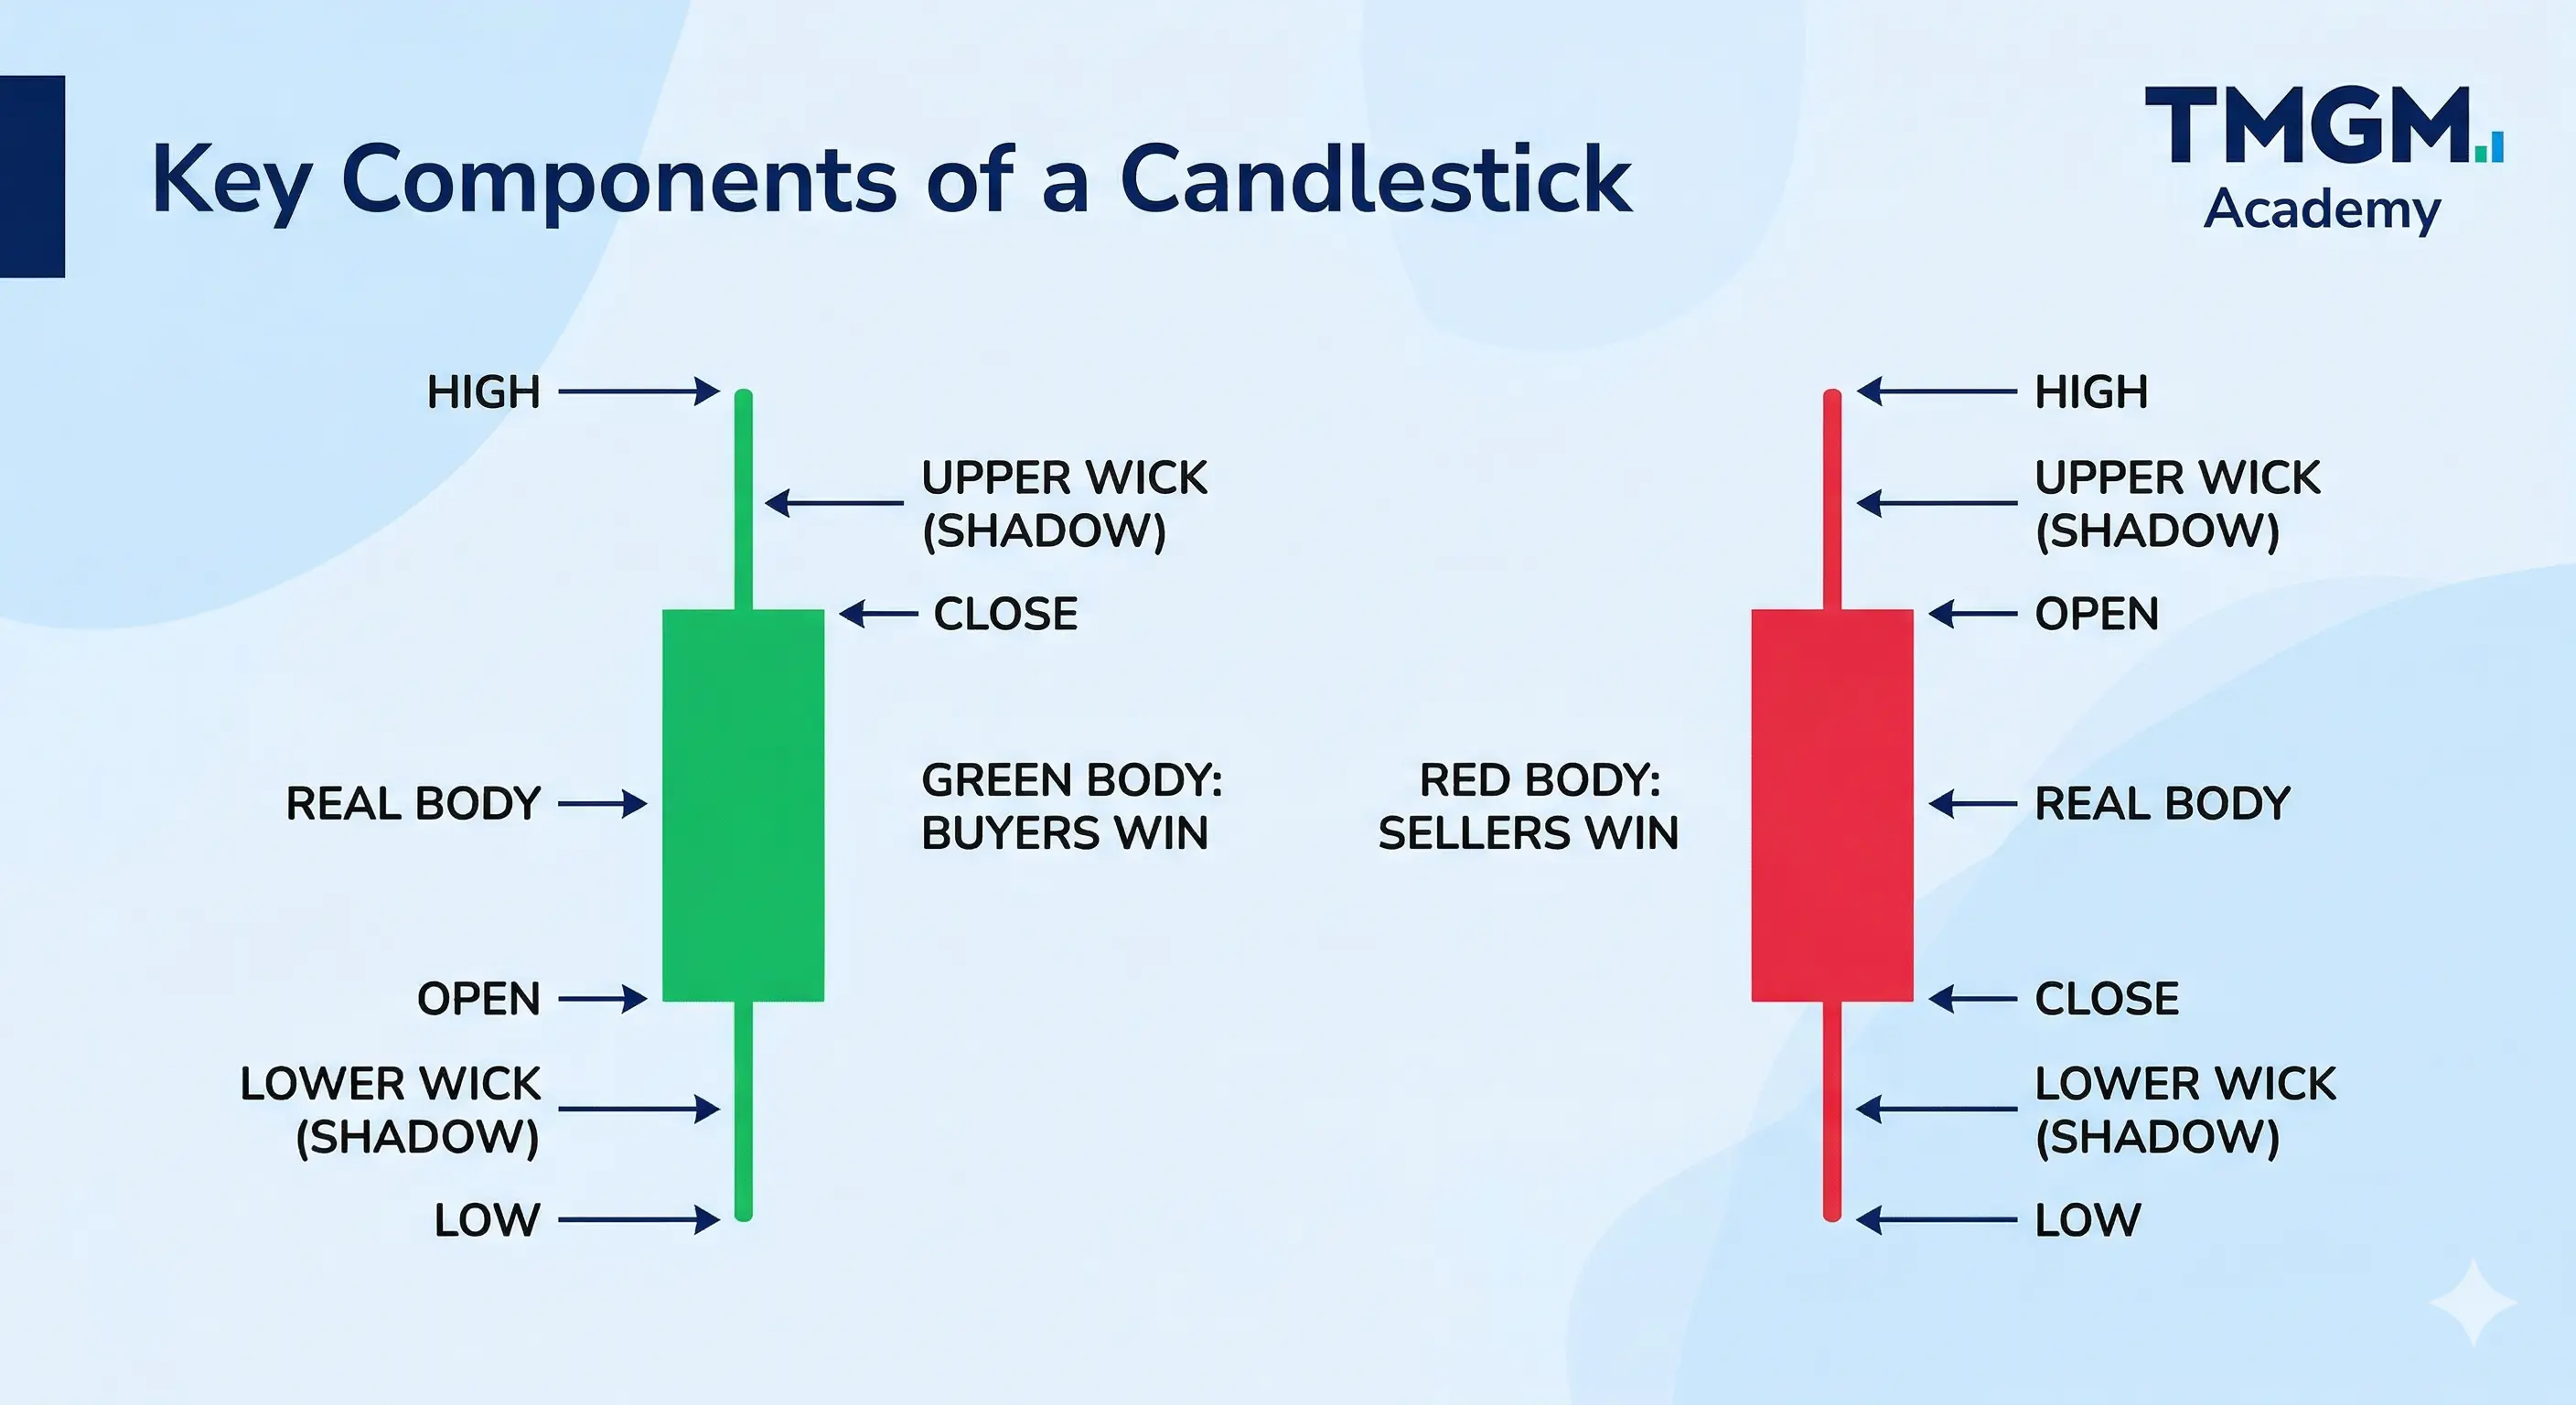
Candlestick Body (Real Body)
The real body of a candlestick represents the true price distance between the session's open and close. A large body indicates intense buying or selling momentum (pressure), showing buy side (green) or sell side (red) dominance. Conversely, a small body reflects a tight balance and deep market indecision.
Candlestick Wicks (Shadows)
Candle wicks, or shadows, represent the extreme highs and lows of prices reached during the session before the market closes. Long wicks can often hint at a reversal, indicating significant price rejection (or pushback from the opposite force) but they are only suggestive and must be confirmed by the next close.
Candlestick Color
Candlestick color tells you the definitive directional close of the session. A green (or white) body confirms buyers successfully closed the price higher than the open price. A red (or black) body confirms sellers forced a lower closing price.
Where Did Candlestick Charts Come From?
Candlestick charting was developed by 18th-century Japanese rice traders — most famously Munehisa Homma, a merchant from Sakata — and was introduced to Western markets by Steve Nison in Japanese Candlestick Charting Techniques. The same open-high-low-close logic that priced rice in the Dojima market now prices forex, stocks and crypto.
Candlestick Charts vs Line Charts
A candle shows all four OHLC prices and market sentiment (body + wicks) for each period, where a line chart shows only closing price. Frame around why candles are preferred for pattern reading. A small 2-column table works here.
How to Read Candlestick Pattern?
These candlestick chart patterns are among the most widely used chart patterns in technical analysis, and learning the main types of candlesticks and their meaning is the foundation for reading any candle pattern chart.
Traders read the size of the candle body, the length of the wicks, and the closing position to understand whether buyers or sellers had more control. The first step is learning the difference between bullish and bearish candles. After that, traders can group patterns into single, double, and triple candlestick formations based on how many candles are needed to form the signal.
Bullish Candlestick Patterns
A bullish candlestick forms when the closing price is higher than the opening price. This shows that buyers were stronger than sellers during that period. On most charts, bullish candles appear green or white, although the color can vary depending on the platform settings.
The body of the candle shows the distance between the open and the close. A larger body usually means stronger buying pressure. The wicks show the highest and lowest prices reached before the candle closed. When a bullish candle closes near its high, it often suggests buyers stayed in control into the end of the session.
Bearish Candlestick Patterns
A bearish candlestick forms when the closing price is lower than the opening price. This shows that sellers had more control during that period. On many charts, bearish candles appear red or black, but the colors may differ depending on chart settings.
Like a bullish candle, the body shows the gap between the open and the close, while the wicks show the price extremes. A long bearish body usually reflects stronger selling pressure. If the candle closes near its low, it often suggests sellers remained in control at the close.
Continuation Candlestick Patterns
Not every pattern signals a reversal. Continuation patterns show the market pausing before resuming the existing trend. On candlesticks these appear as strong trend candles (a marubozu) or as a brief three-candle pullback that fails to reverse (rising three methods in an uptrend, falling three methods in a downtrend). Read them as "the trend is resting," not "the trend is turning."
Single Candlestick Patterns, Double Candlestick Patterns, Triple Candlestick Patterns
Candlestick patterns are grouped by how many candles it takes to complete the signal: single, double, and triple. A single candlestick pattern (such as a doji or hammer) is the earliest warning that momentum may be shifting — read from body size and wick length — but one candle rarely confirms a move on its own. A double candlestick pattern reads two candles together, with the second confirming or rejecting the first, which makes it better at separating a real shift in control from a simple pause. A triple candlestick pattern adds a third session, giving the most structure and the clearest reversal-or-continuation story of the three. The rule of thumb: more candles and stronger closes mean less ambiguity. Each group's individual patterns are broken down below.
Single candlestick patterns
Single candlestick chart formations are the earliest indicators of shifting momentum. They are ranked below by clarity of control, not guaranteed accuracy. A single candle can warn you early, but it cannot prove follow through by itself, so confirmation is mandatory especially for reversal candlestick patterns.
Doji Candlestick Pattern
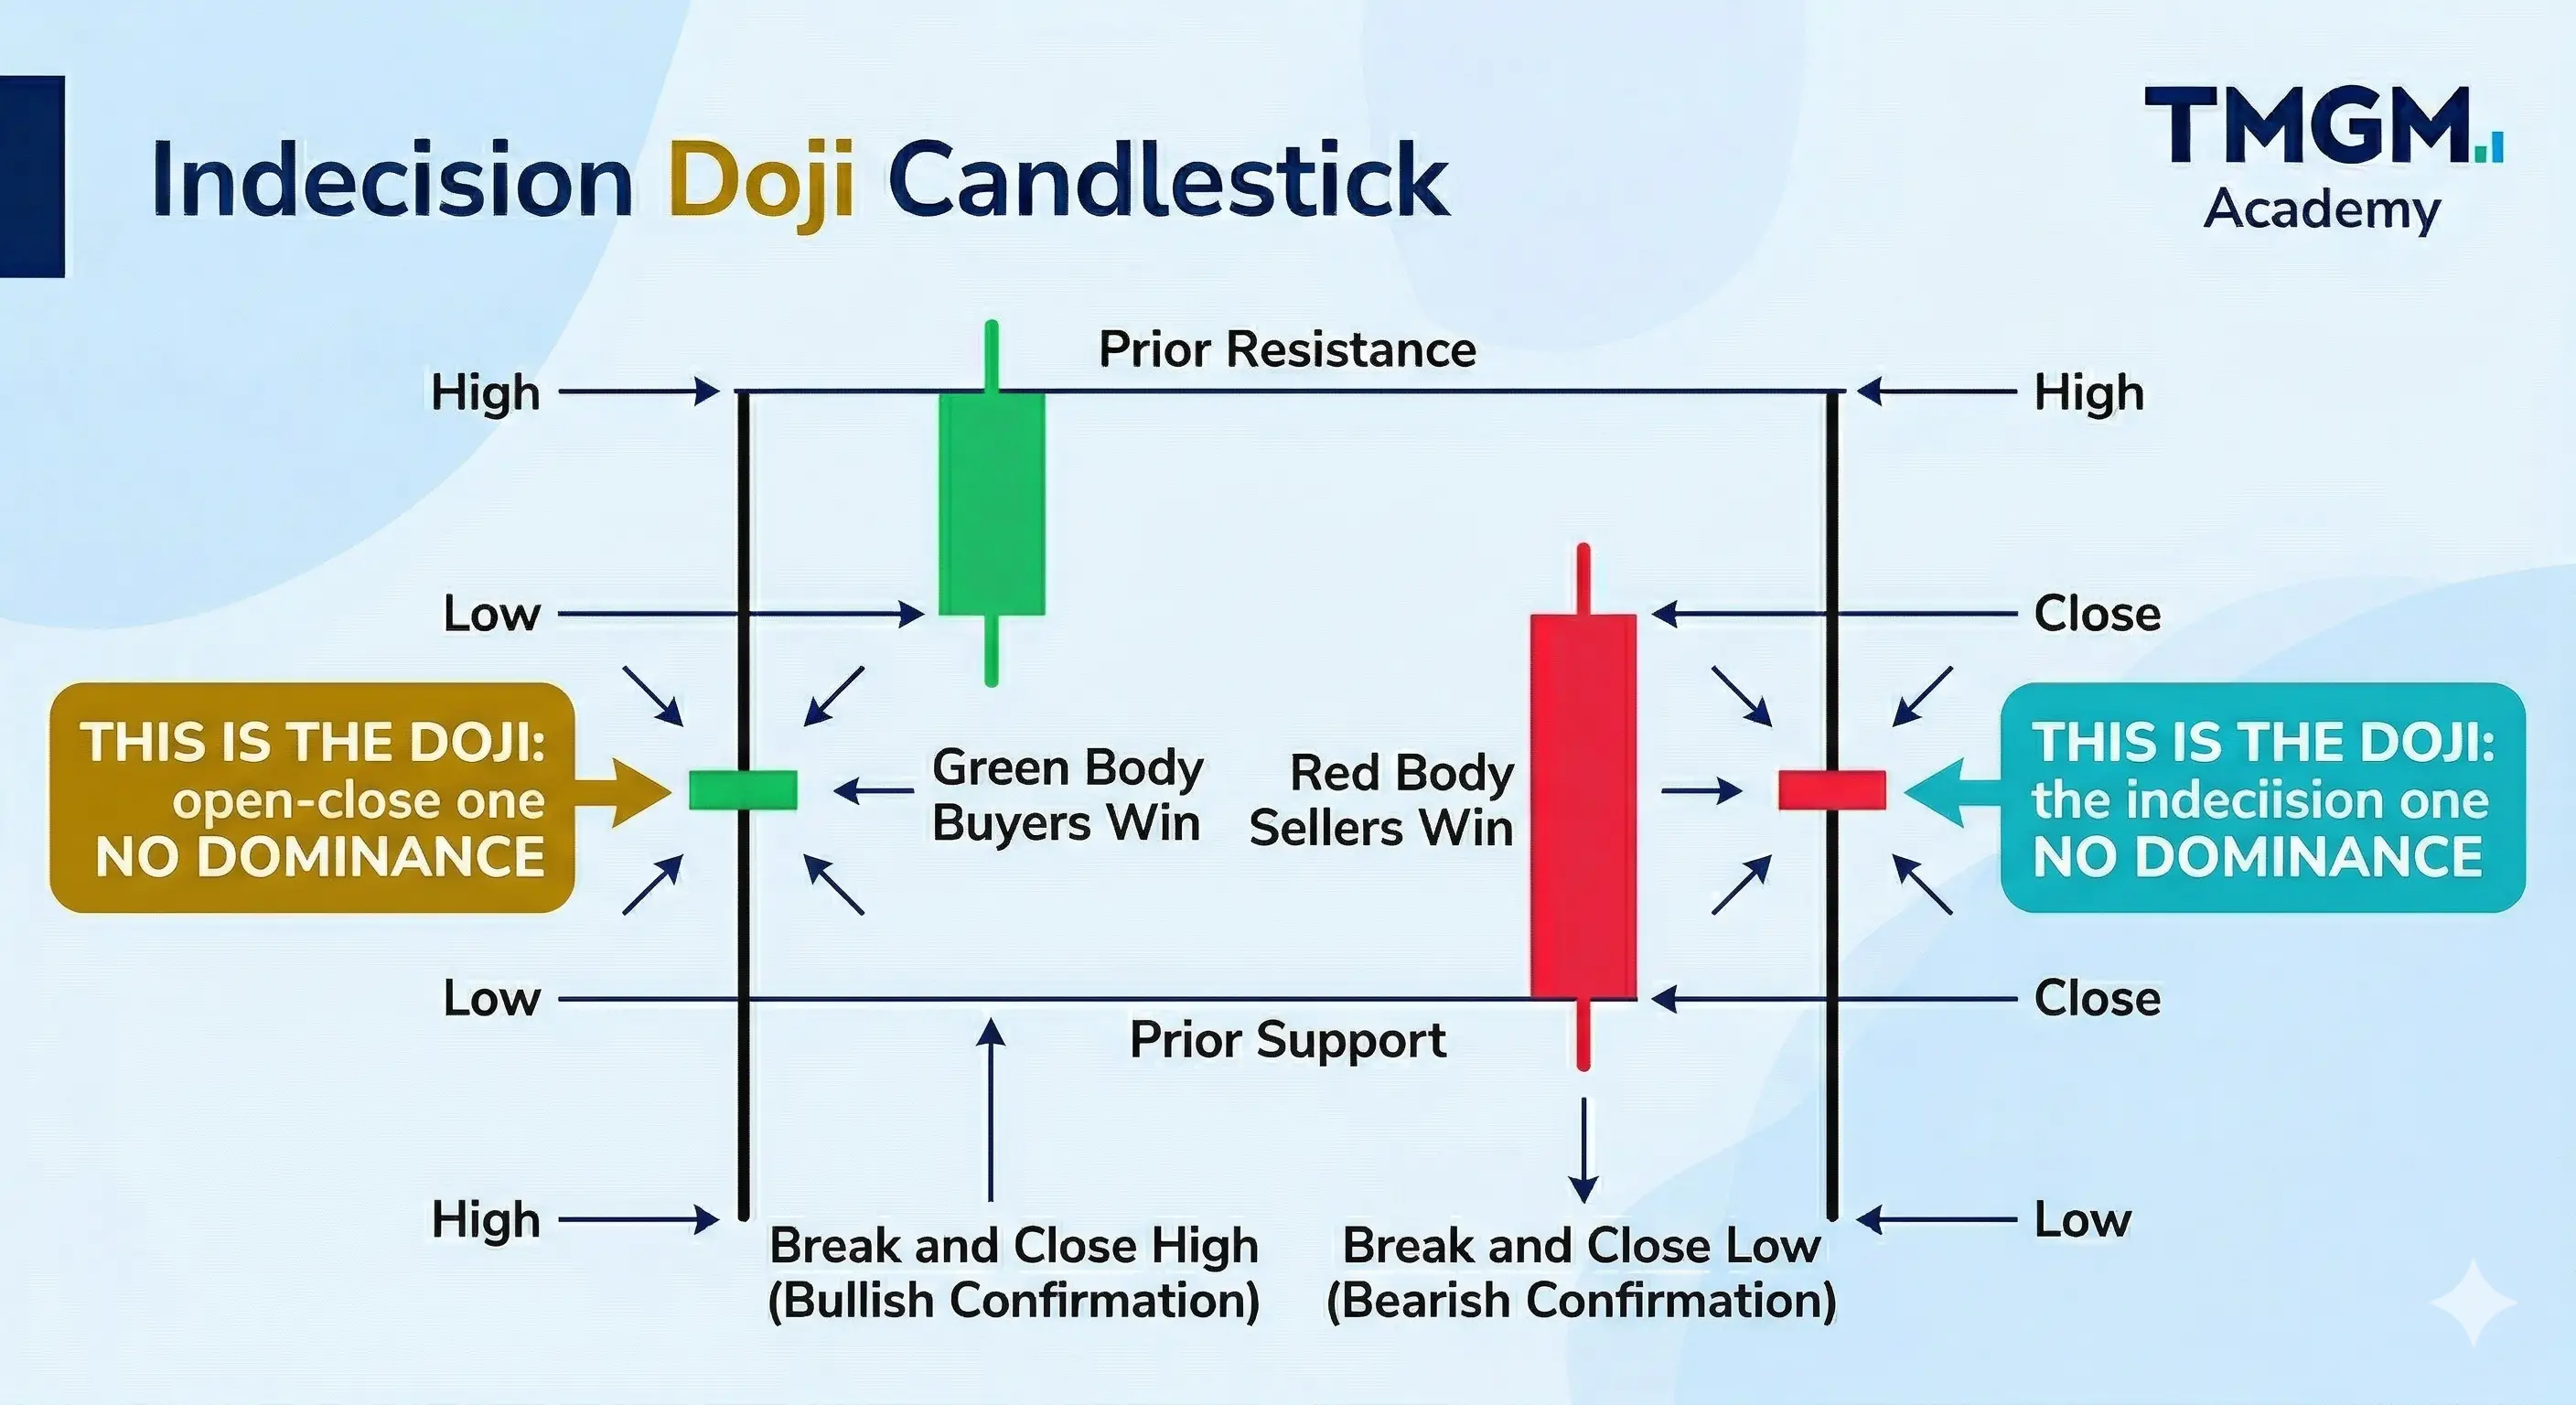
The Classic Doji Candlestick Pattern is an indecision candlestick pattern, both buy side and sell side momentum did not win. It prints with a very small real body and often noticeable wicks, which means neither side could hold control into the close and momentum is unstable. It works best after an extended move or at clear support or resistance where a shift in control would matter. It is confirmed when the next candle closes decisively in one direction, ideally breaking and closing beyond the doji high or low.
Doji Candlestick Variations:
Long legged doji
A doji with long upper and lower shadows (wicks) of similar length and a very small body near the middle, showing maximum indecision — both buyers and sellers pushed hard but neither held control into the close. On its own it is non-directional; it matters most after an extended move or at a key support or resistance level, where it warns that the prevailing momentum is breaking down. It is confirmed by the direction of the next candle's close, ideally breaking beyond the doji's high or low.
Dragonfly doji candlestick
A doji with a long lower shadow (wick) and little to no upper shadow, where the open, high, and close all sit near the session high. It reads as lower-price rejection — sellers drove price down but buyers reclaimed the level into the close. It is most reliable after a downtrend or at support, and still needs confirmation: a higher close on the next candle.
Gravestone doji
A doji with a long upper shadow (wick) and little to no lower shadow, where the open, low, and close all sit near the session low. It reads as higher-price rejection — buyers pushed higher but sellers reclaimed control into the close. It is most reliable after an uptrend or at resistance, and is confirmed by a lower close on the next candle.
Hammer Candlestick Pattern
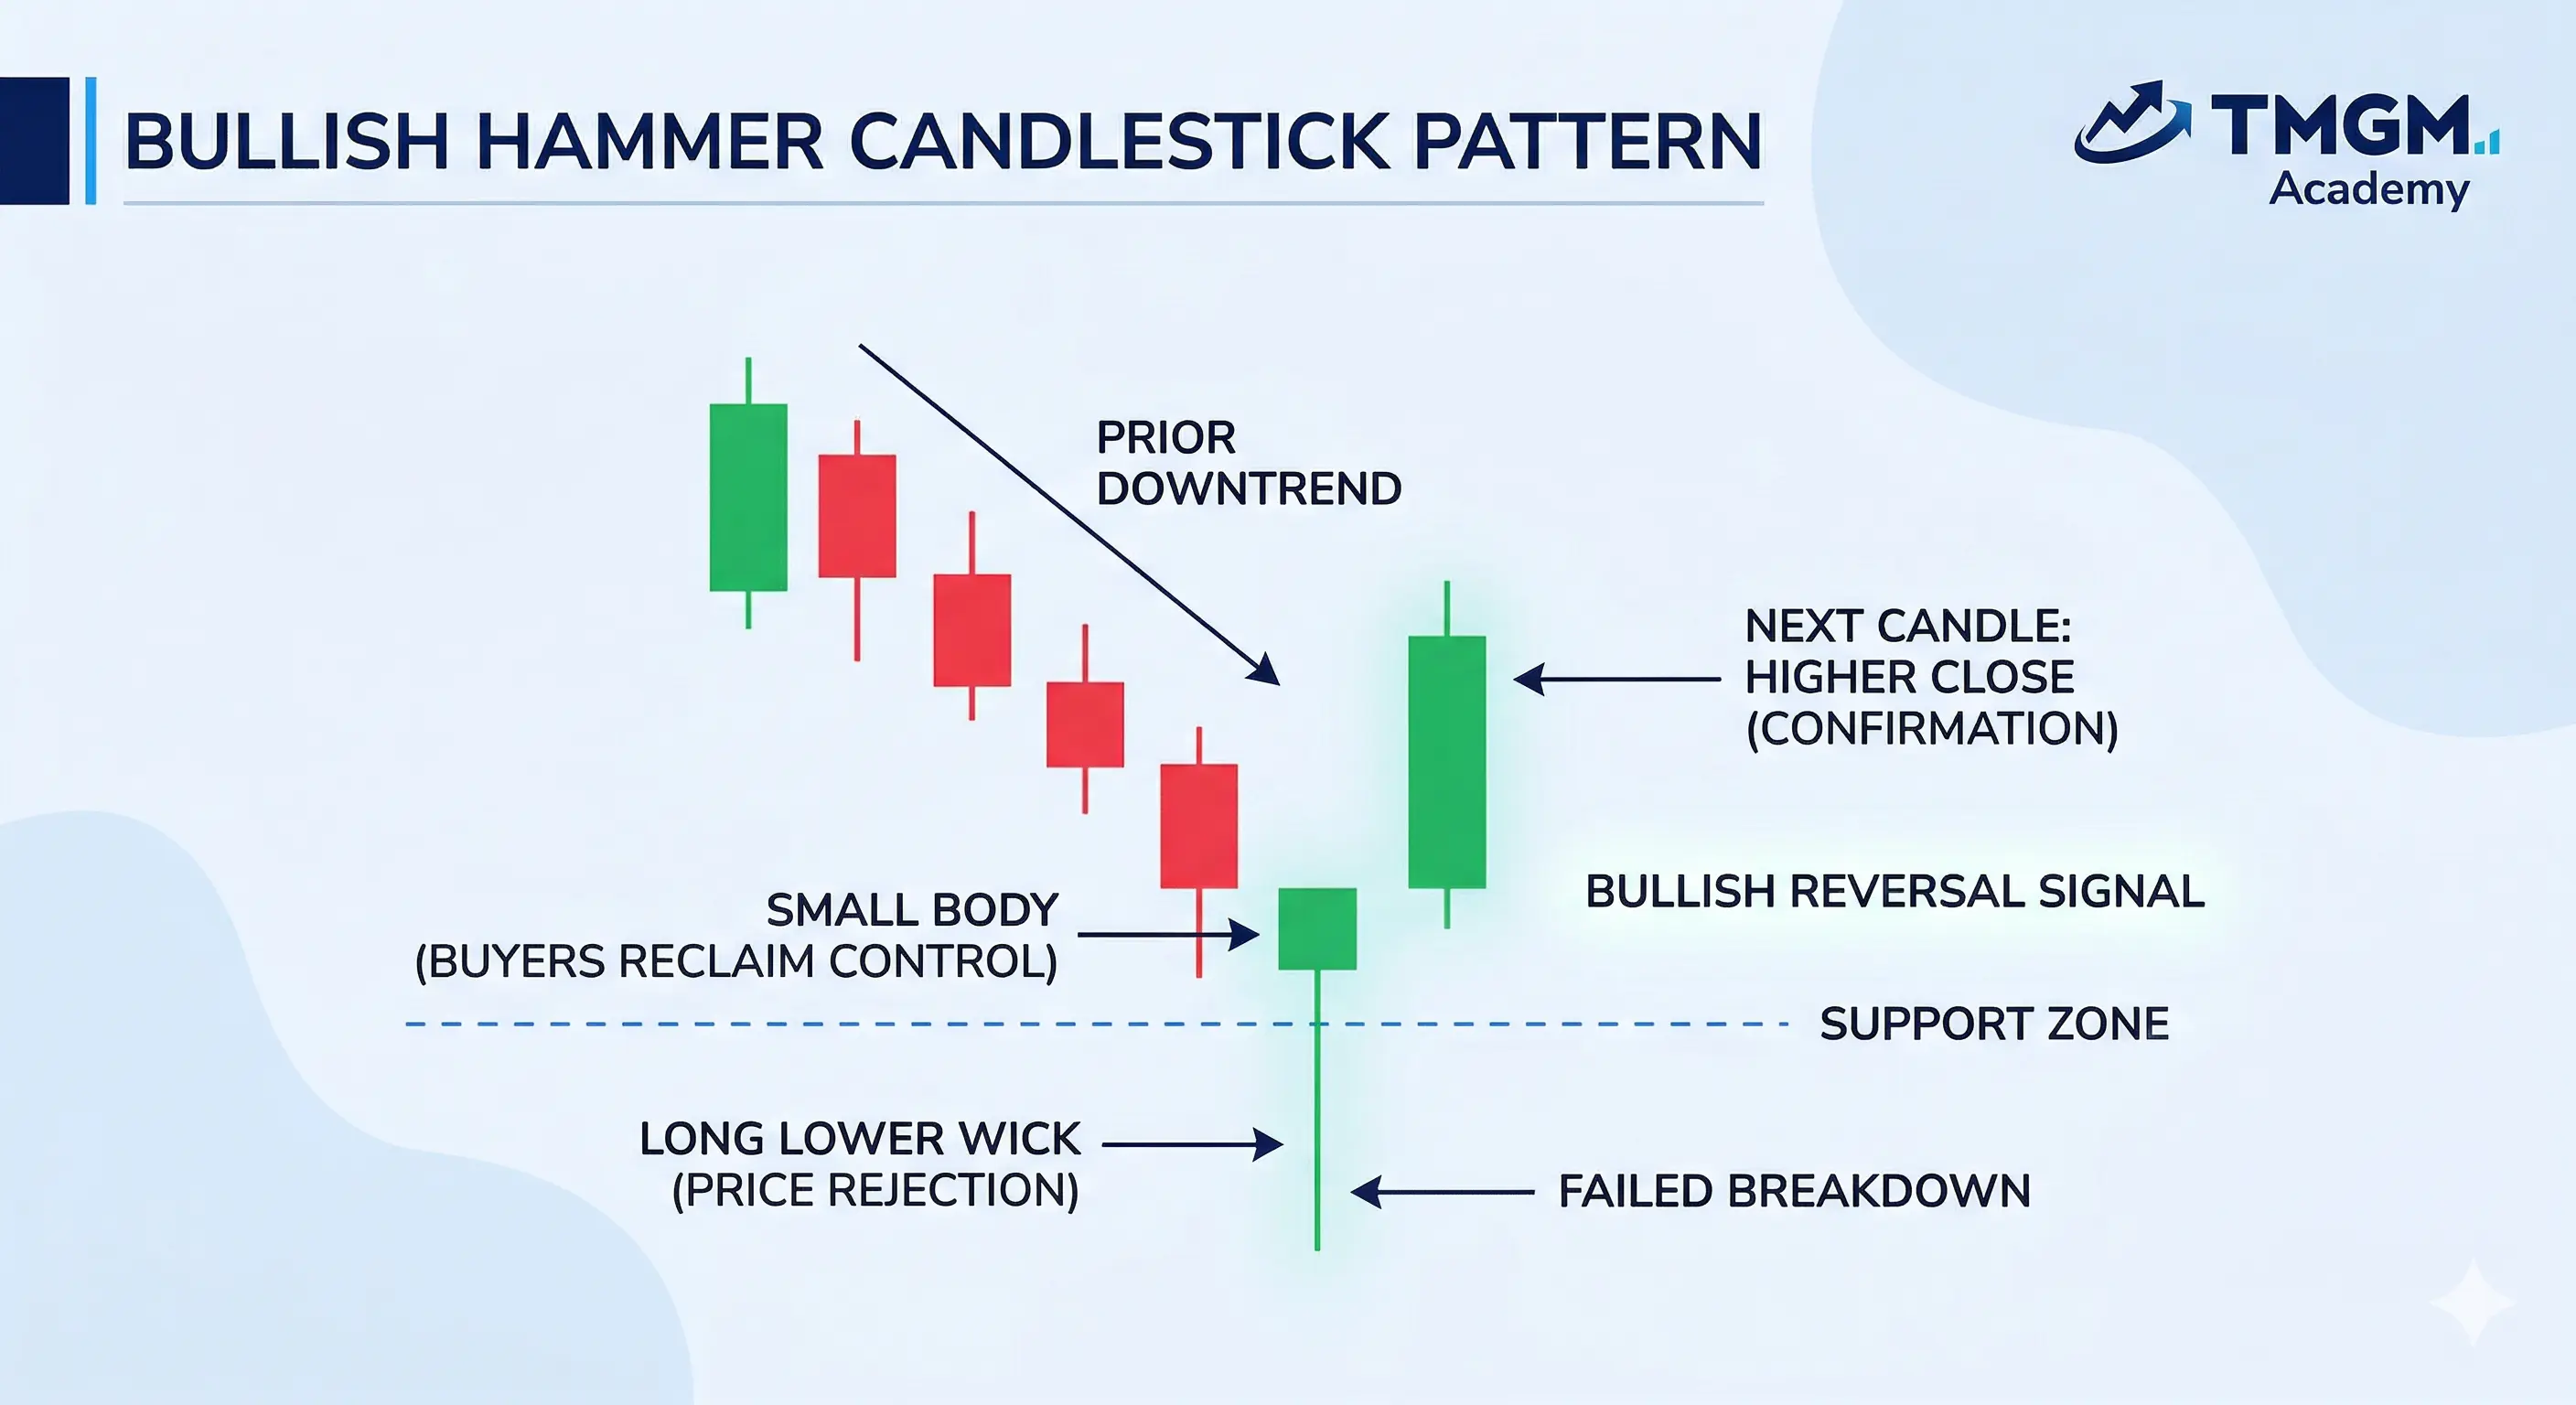
Hammer Candlestick Pattern is a bullish reversal candlestick pattern.
As a rule of thumb, the lower wick should be at least twice the length of the real body — that ratio is what confirms sellers were rejected rather than merely paused. It is most reliable after a decline and near support, where a failed breakdown can trap late sellers. It is confirmed when the next candle closes higher, ideally breaking and closing above the hammer high.
Hammer Candlestick Variations
Inverted Hammer Candlestick Pattern
Can be bullish after a downtrend because it shows buyers forcing an upside probe and rejection from below, even if confirmation is still require
Hanging Man Candlestick Pattern
Same shape as a hammer, but becomes a bearish warning after an uptrend because it shows sellers could press price lower intraday, even if buyers recovered some ground by the close.
Shooting Star Candlestick Pattern
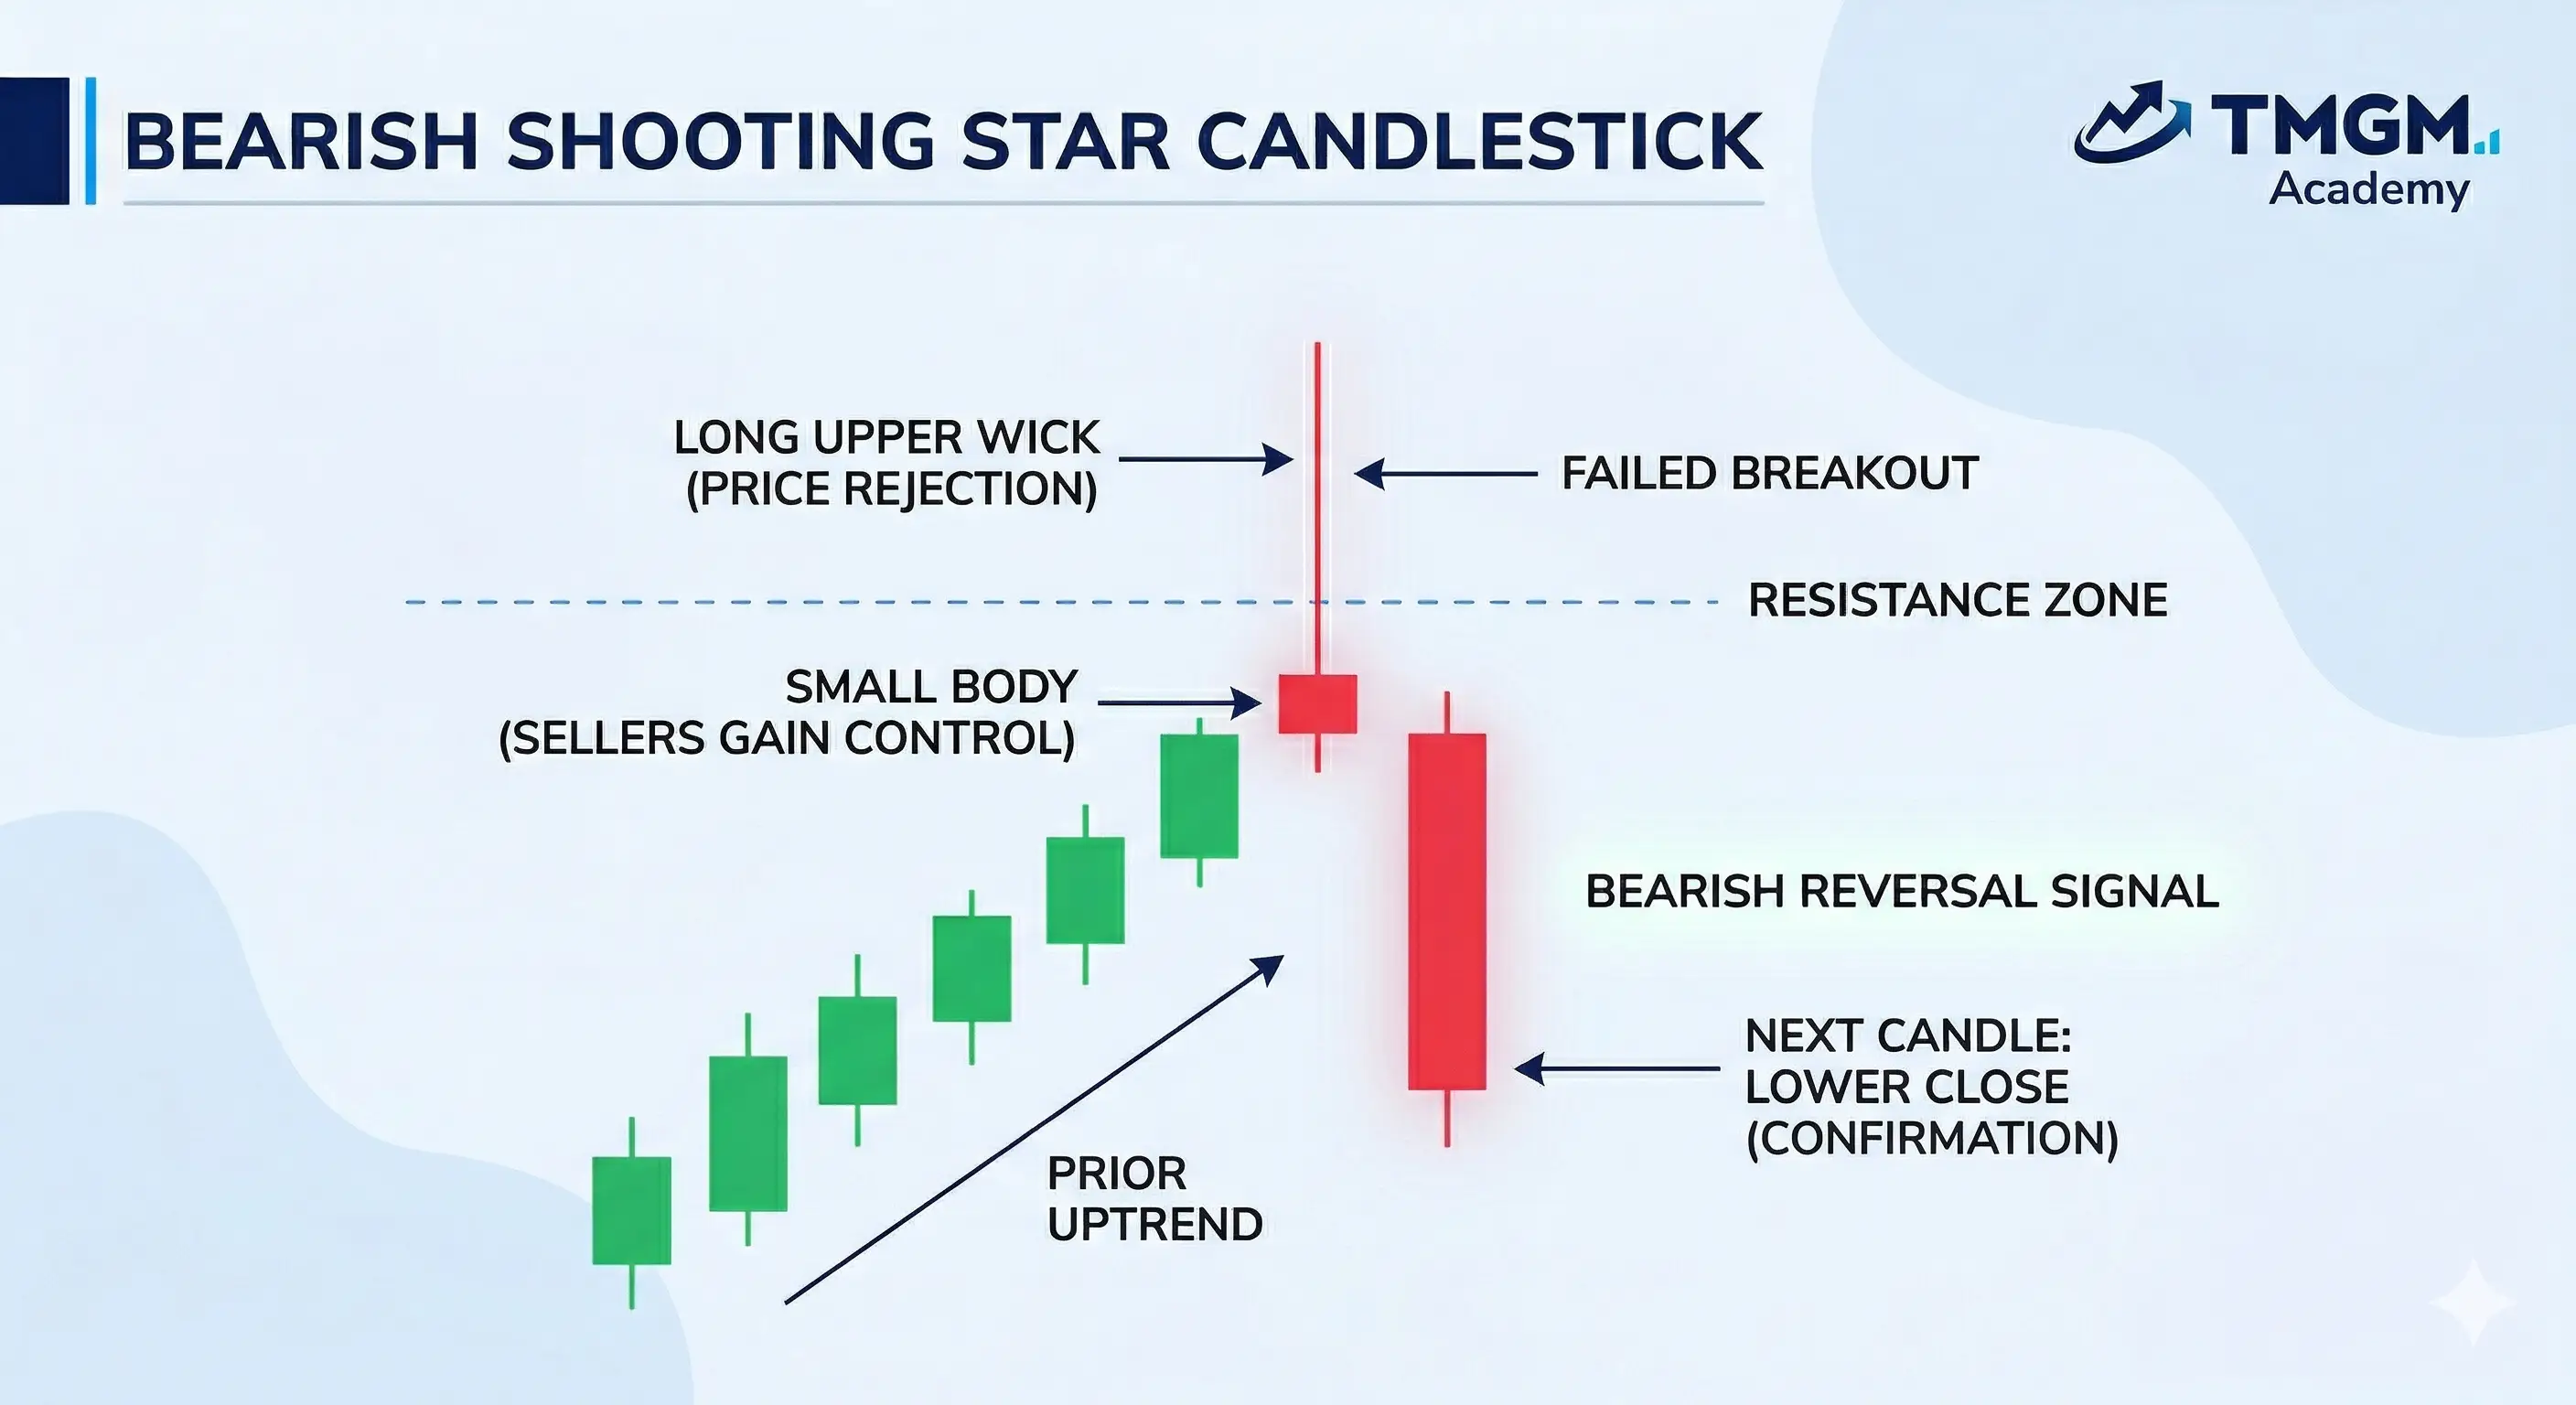
Shooting Star Candlestick is a bearish reversal candlestick pattern. It forms with a small body near the low and a long upper wick, showing buyers pushed higher but sellers rejected the high and forced a weak close. It is most reliable after an uptrend and near resistance, especially after a fast run up. It is confirmed when the next candle closes lower, ideally breaking and closing below the shooting star low.
The shooting star candlestick pattern is strongest when it forms after an uptrend because it shows buyers losing the ability to keep control into the close. A shooting star in the middle of chop is often just noise and should be treated as indecision, not a reversal.
Marubozu Candlestick Pattern
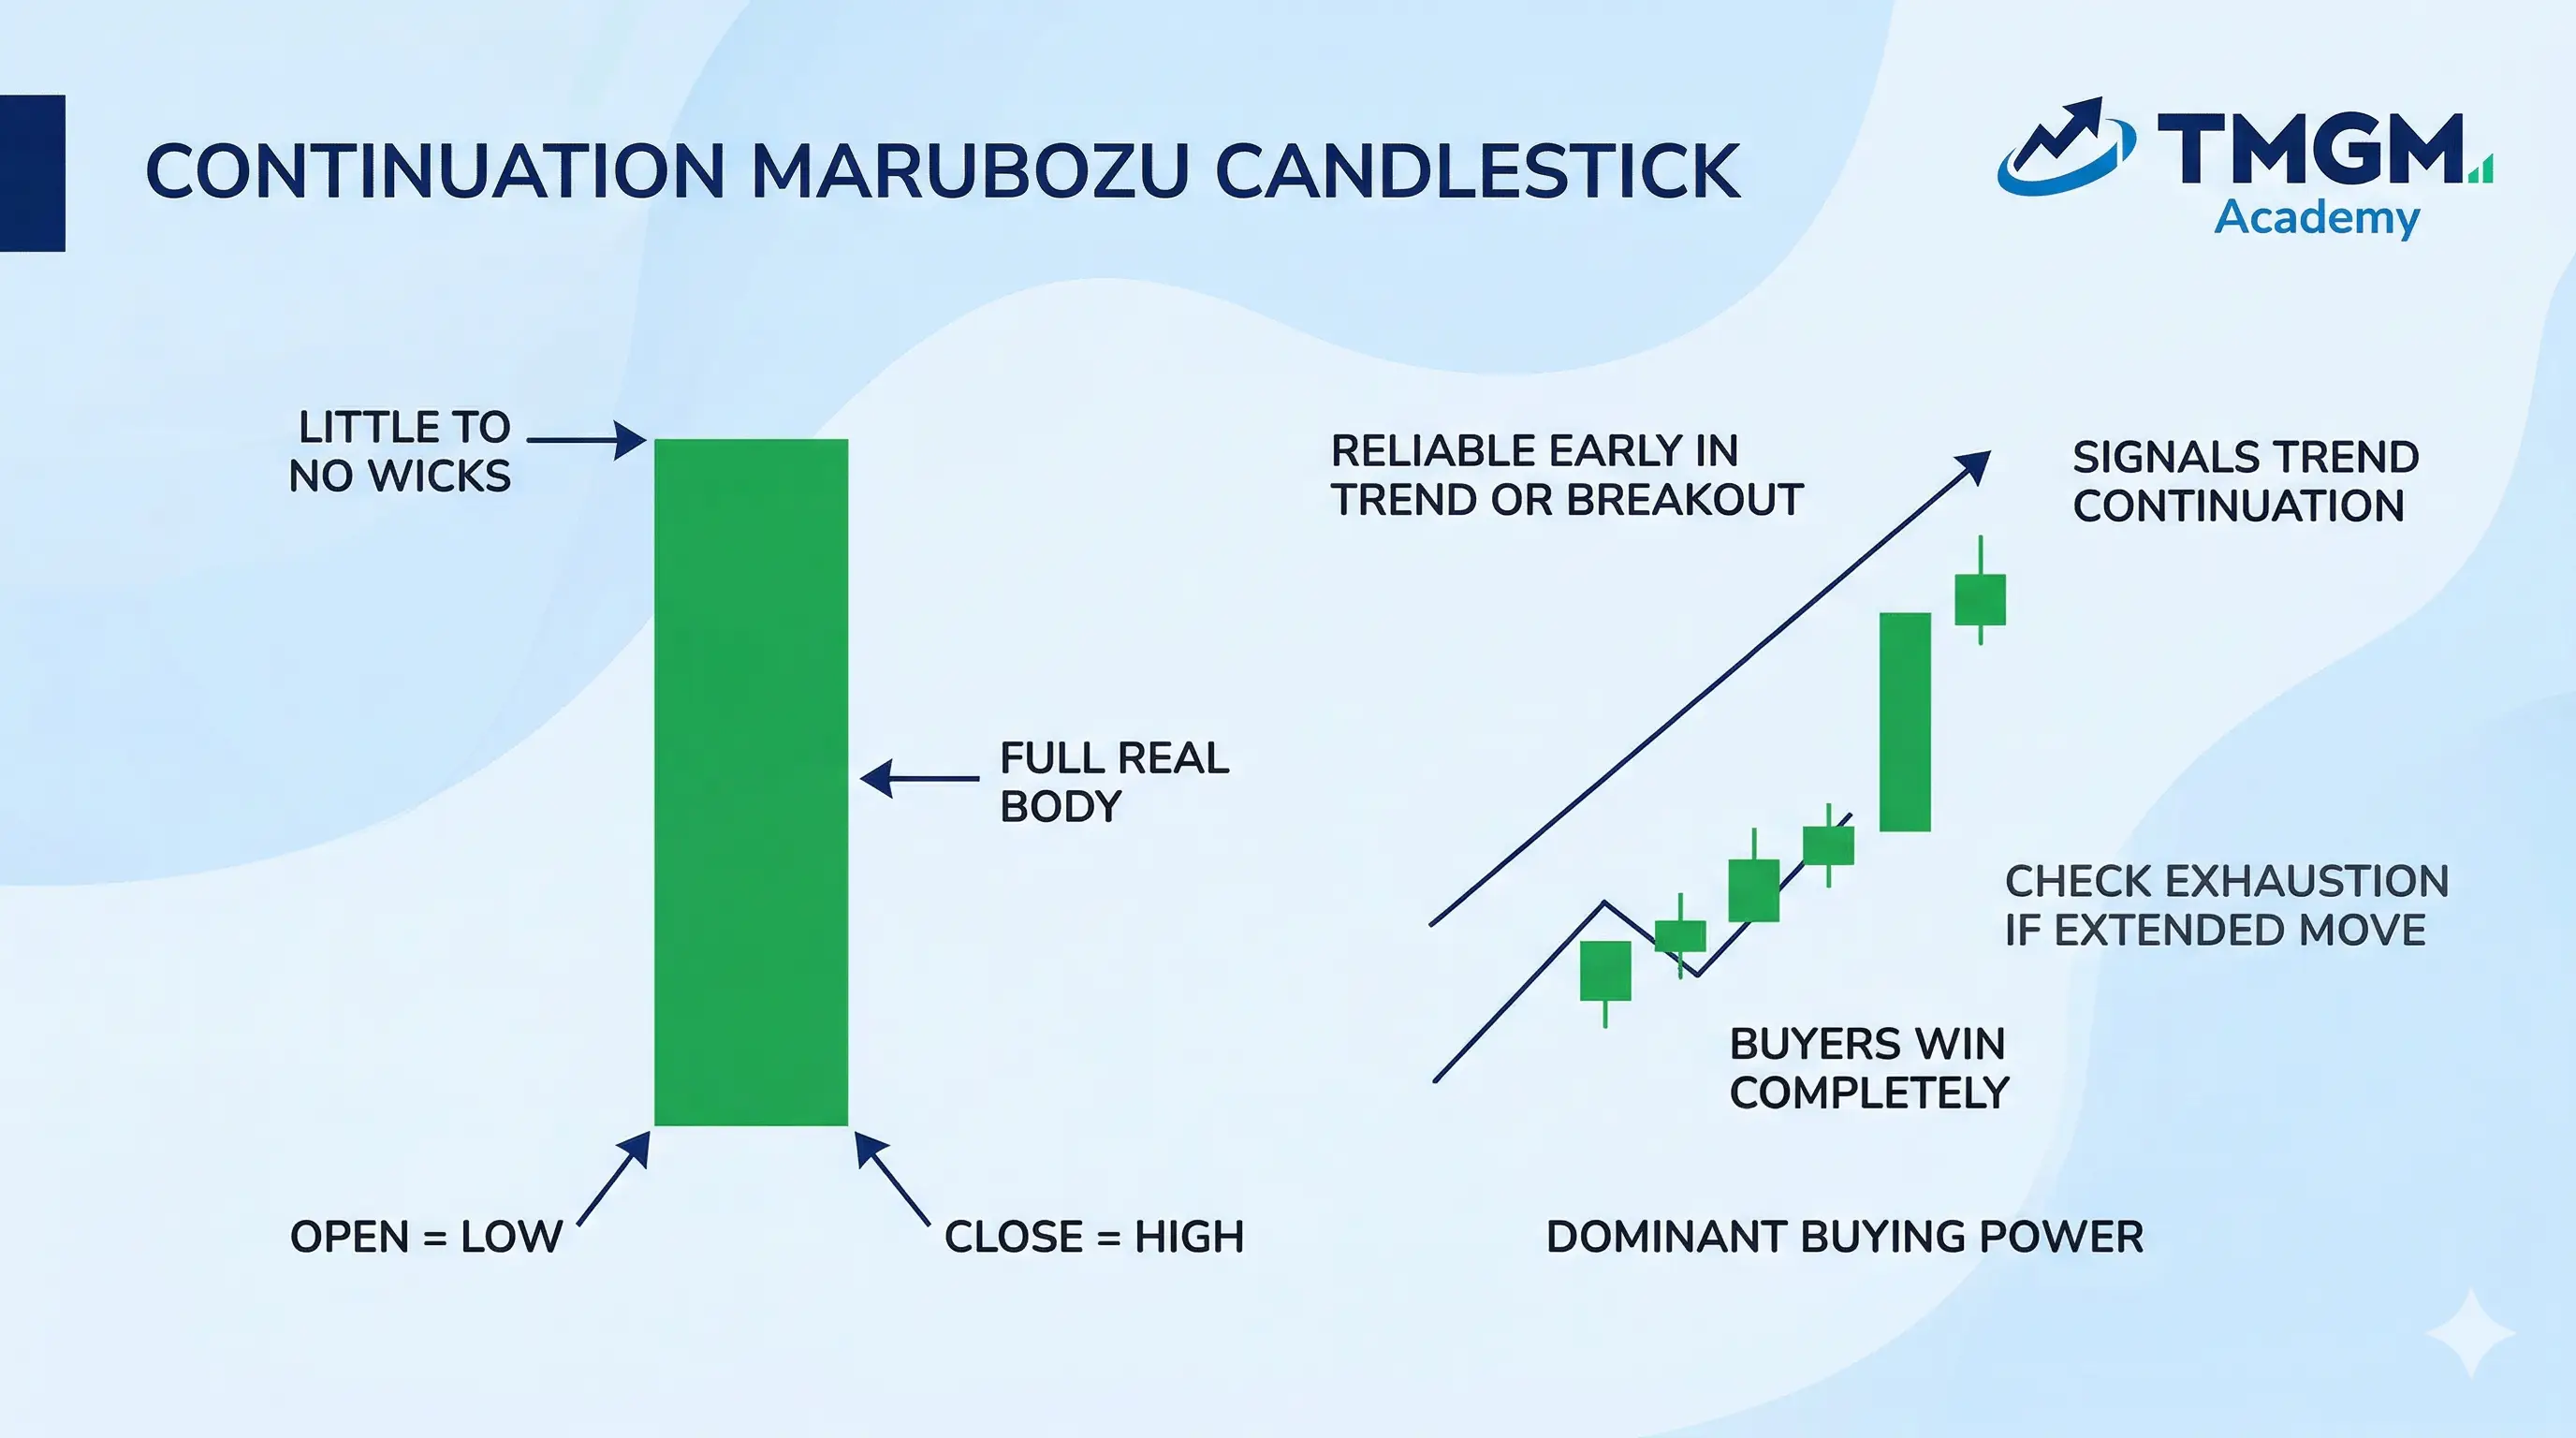
Marubozu Candlestick is a trend continuation candlestick pattern most of the time. A white (green) marubozu closes at its high and signals bullish continuation; a black (red) marubozu closes at its low and signals bearish continuation. It is most reliable early in a trend, on a breakout with room to run, or after consolidation where imbalance can persist. It is confirmed by follow through closes in the same direction, but if it appears into a major level after an extended move it can signal exhaustion, so you still want the market to hold above or below that level on subsequent closes.
A marubozu often signals continuation rather than reversal, because clean dominance tends to persist. But if a marubozu prints into a major level after an extended move, it can be exhaustion, so location decides whether it is strength or a late move.
Pro Tip: The most reliable single candle reads come from where it closes relative to a level, not from the candle shape in isolation.
Spinning Top Candlestick Pattern
A spinning top candlestick has a small body with upper and lower wicks, showing a tug of war and a stall in momentum. Treat a spinning top as a pause and wait for the next candle to break and close beyond its range before acting, and note that repeated spinning tops after a trend often mark where momentum is stalling..
Double Candlestick Patterns
Two candle patterns can show a clearer shift in control because they compare one session’s conviction against the next session’s response. This makes them better at separating a pause from a true takeover in trading candlestick patterns.
Harami Candlestick Pattern
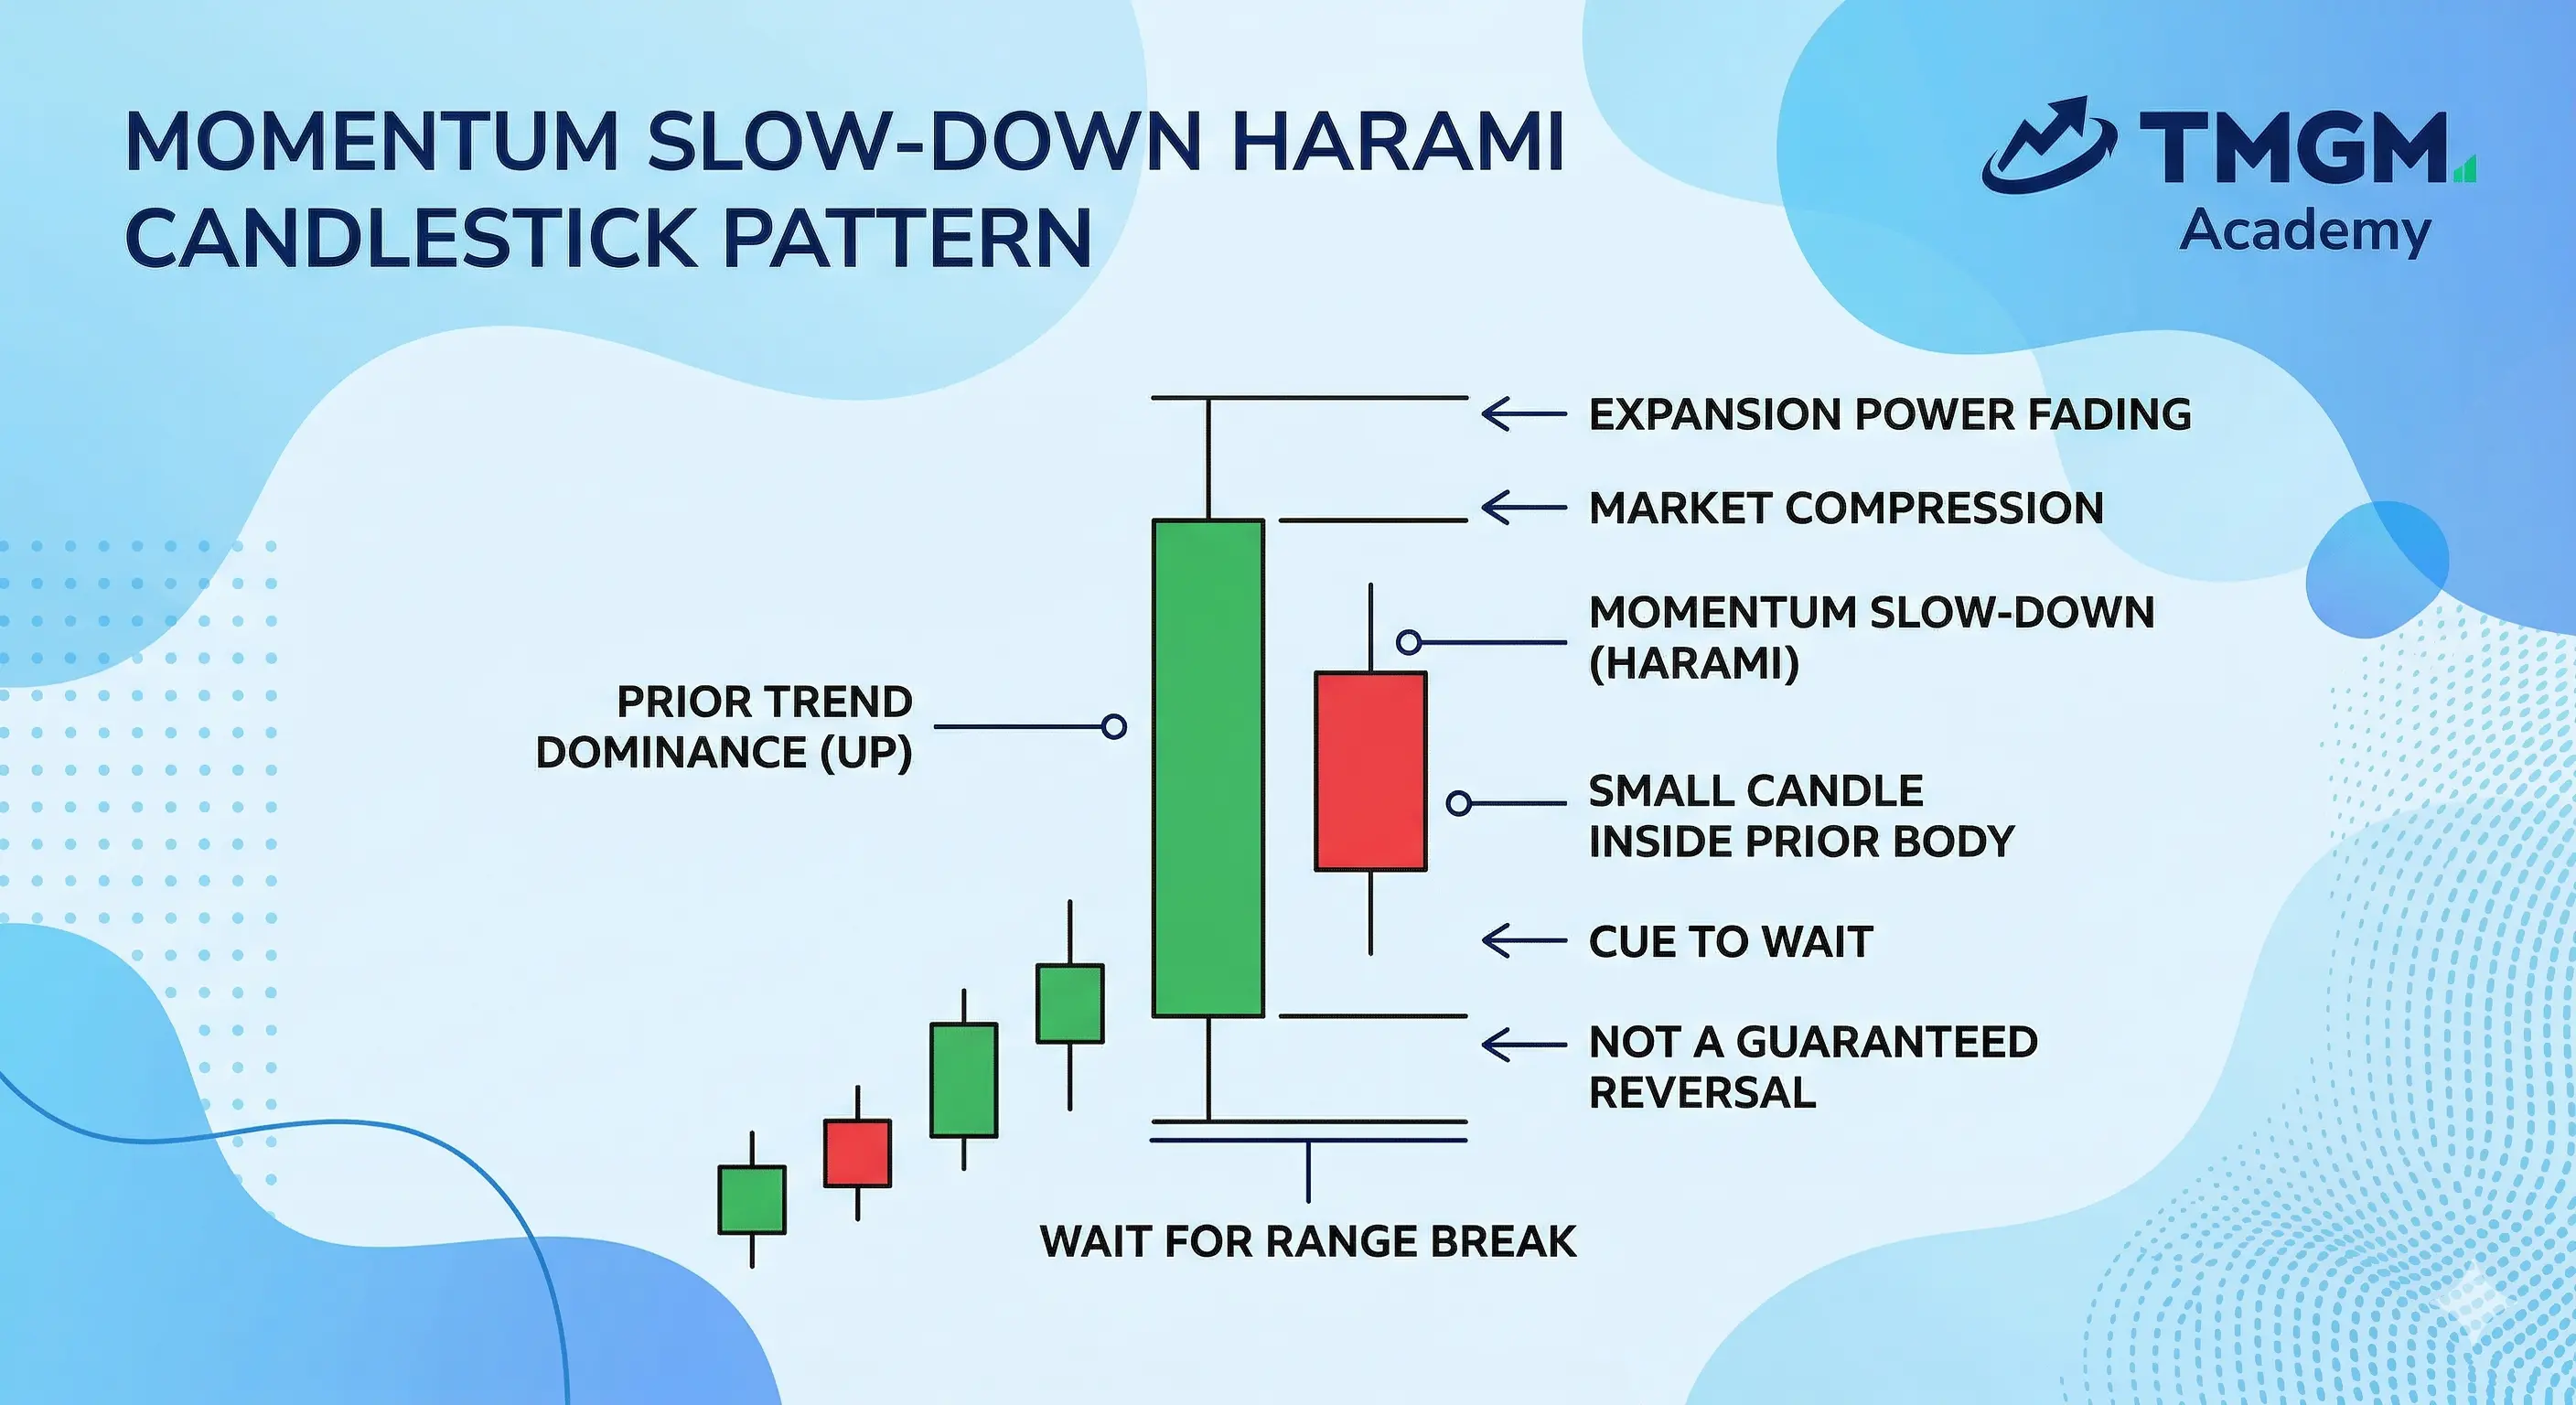
The harami is a two-candle reversal, or inside, pattern: a large candle followed by a smaller candle whose real body sits entirely within the prior body — a sign the dominant side is losing expansion power (a momentum slow-down). It is an early warning, not a guarantee; many harami simply become consolidation, so wait for price to break and close beyond the pattern's high or low before acting.
Bullish Harami
A large bearish candle followed by a smaller bullish candle contained within its body, appearing after a downtrend. It shows selling pressure is contracting and buyers are beginning to absorb the move, hinting at a bullish reversal. It is most reliable near support after an extended decline, and is confirmed when the next candle breaks and closes above the harami's high.
Bearish Harami
A large bullish candle followed by a smaller bearish candle contained within its body, appearing after an uptrend. It shows buying pressure is fading and momentum is compressing, hinting at a bearish reversal. It is most reliable near resistance after an extended rally, and is confirmed when the next candle breaks and closes below the harami's low.
Engulfing Candlestick Pattern
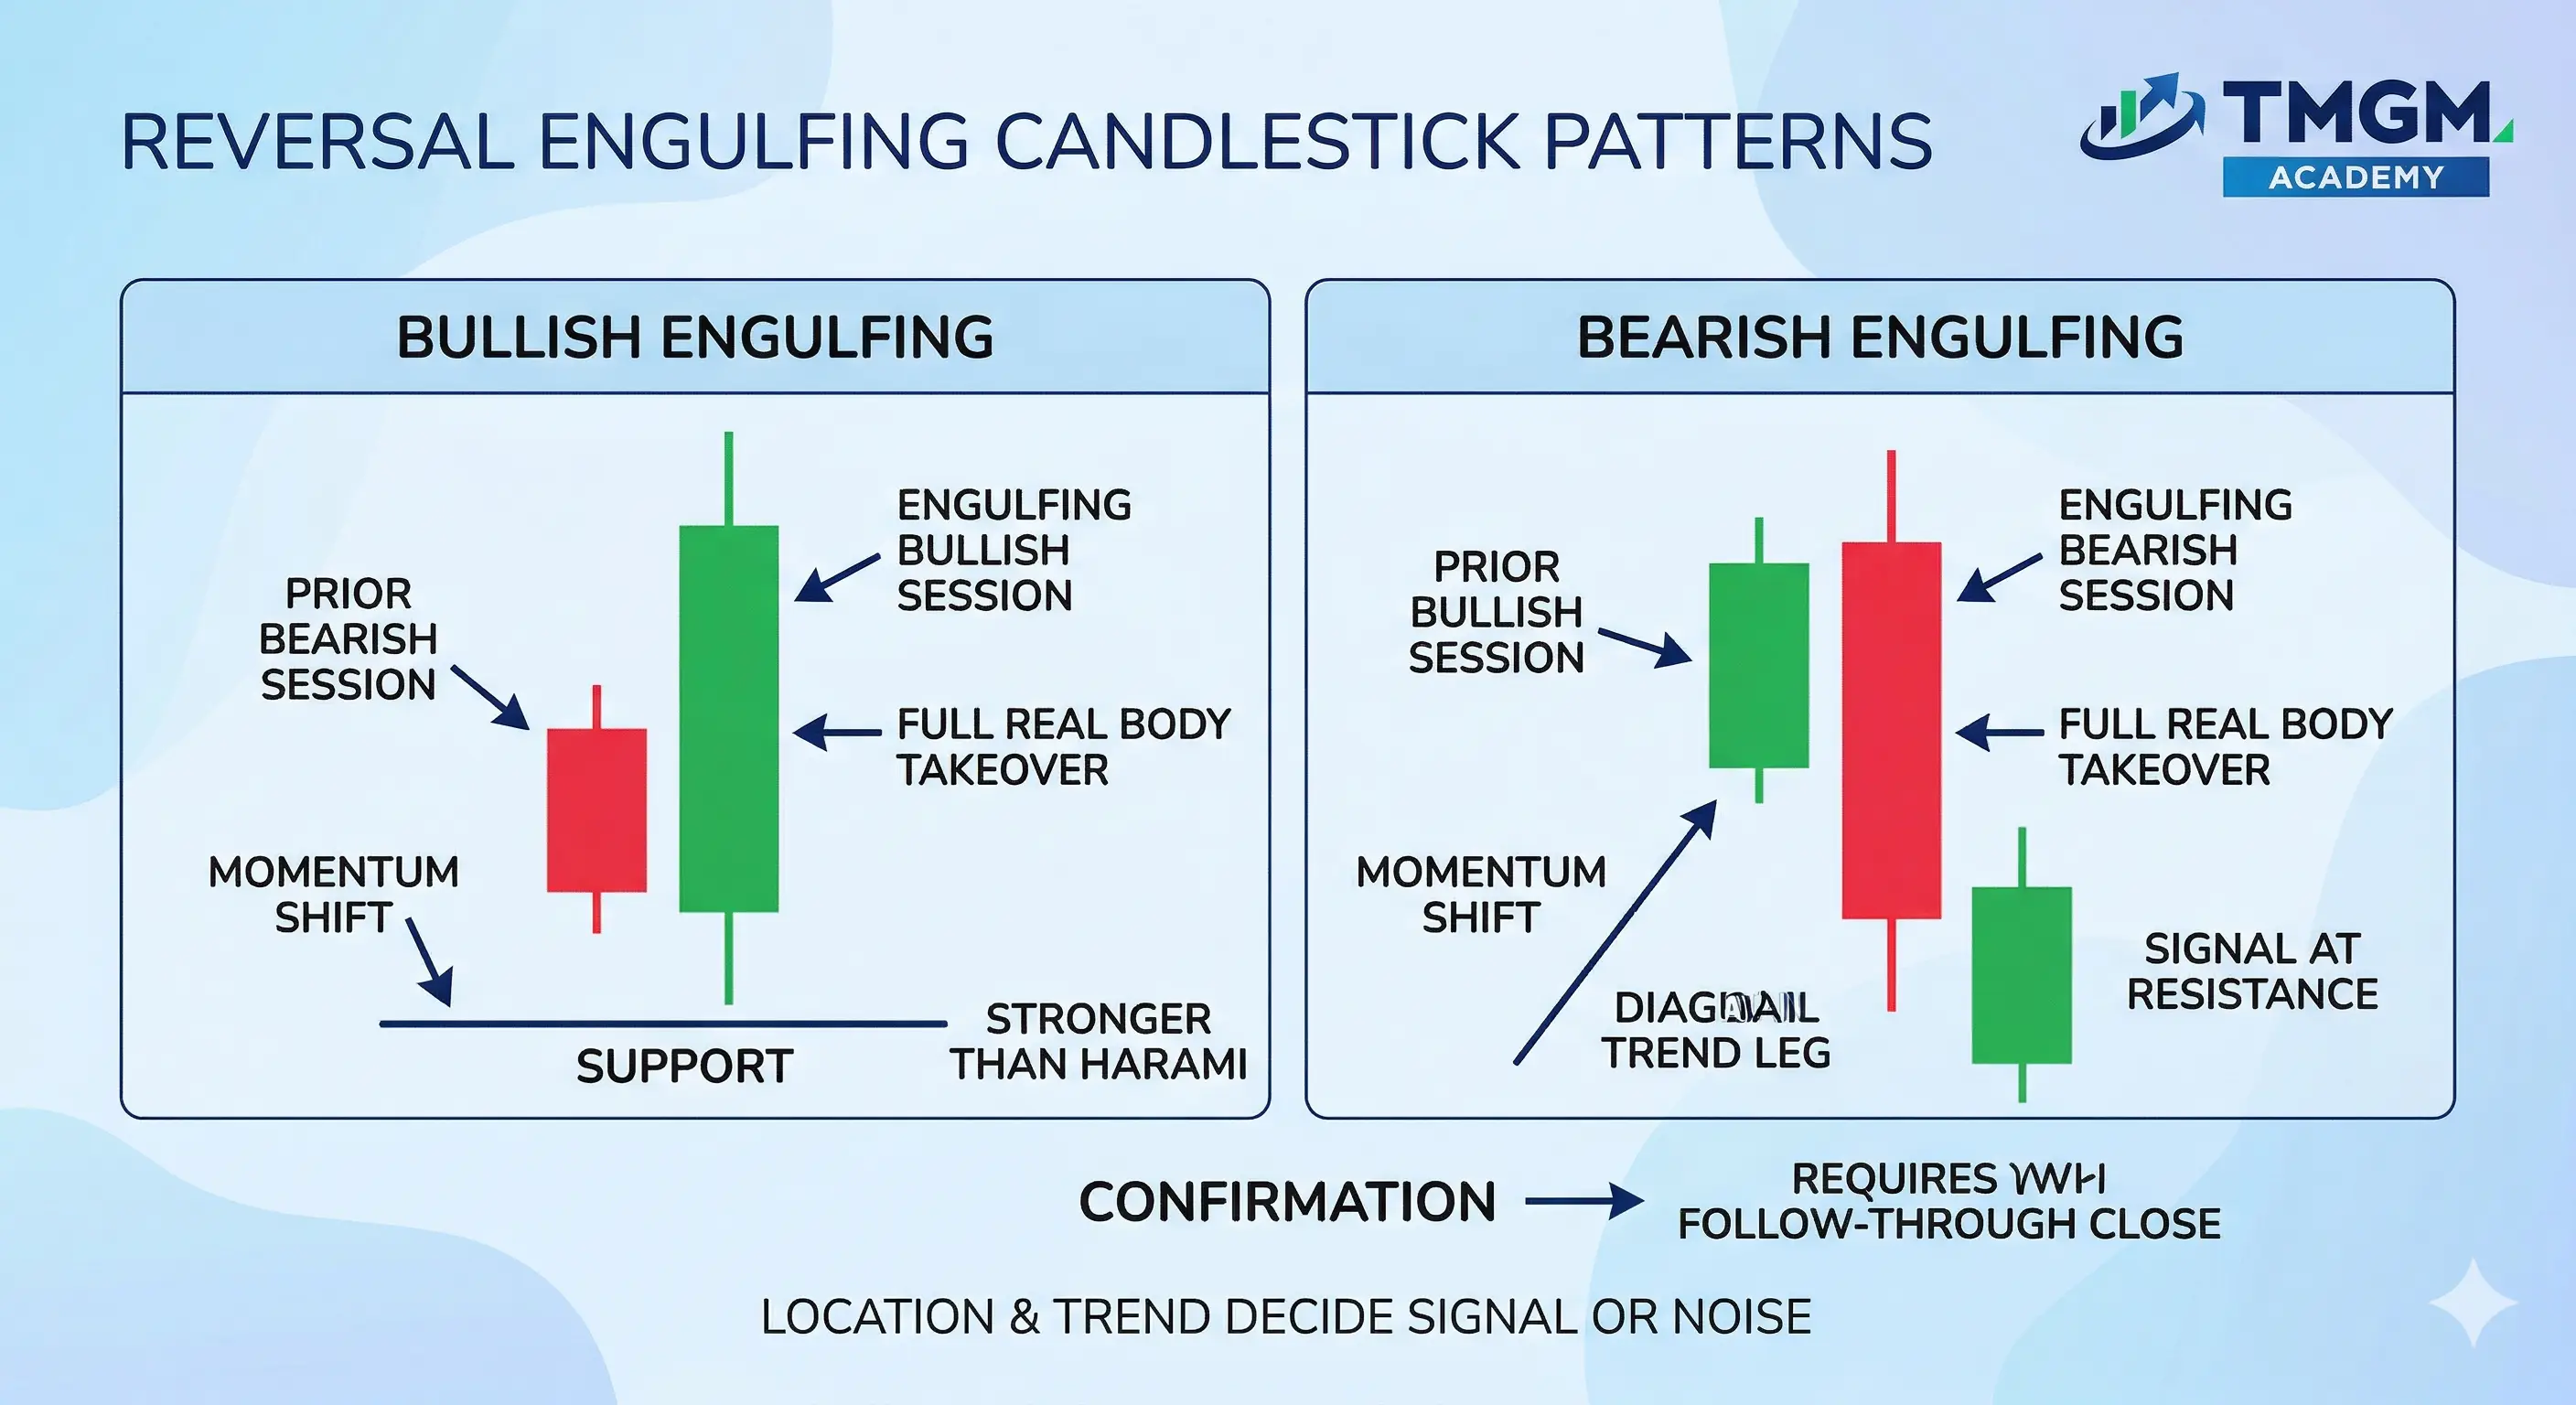
Engulfing Candlestick is a reversal takeover candlestick pattern. It forms when the second candle’s real body fully covers the prior candle’s real body, showing momentum shifted strongly enough to erase the prior session and close with authority. It is most reliable at support or resistance or after a trend leg that looks stretched. It is confirmed by a follow through that closes beyond the engulfing candle’s high or low rather than immediately fading back into the range.
An engulfing candlestick is more reliable than a harami in forecasting trend reversal because it shows takeover, not just momentum slowing down. Even so, an engulfing candle inside a choppy range can fail quickly, so make sure market context is clear before entering a position.
Piercing Line Candlestick Pattern
A bullish reversal made of a long bearish candle followed by a bullish candle that opens below the prior low but closes back above the 50% midpoint of the previous body. The deeper it closes past the midpoint, the stronger the rejection of the downtrend. Confirm with a higher close on the next candle
Dark Cloud Cover Candlestick Pattern
The bearish mirror of the piercing line: a long bullish candle followed by a bearish candle that opens above the prior high and closes below the 50% midpoint of the previous body, signalling the uptrend is stalling. On forex charts (see the FX section) the open-above-the-high step often shows as overlap rather than a true gap.
Triple Candlestick Patterns
Three candle patterns can embed follow through because they show impulse, transition, then confirmation. This is why many reversal frameworks treat them as higher sureness, provided they form in the right context.
Morning Star Candlestick Pattern
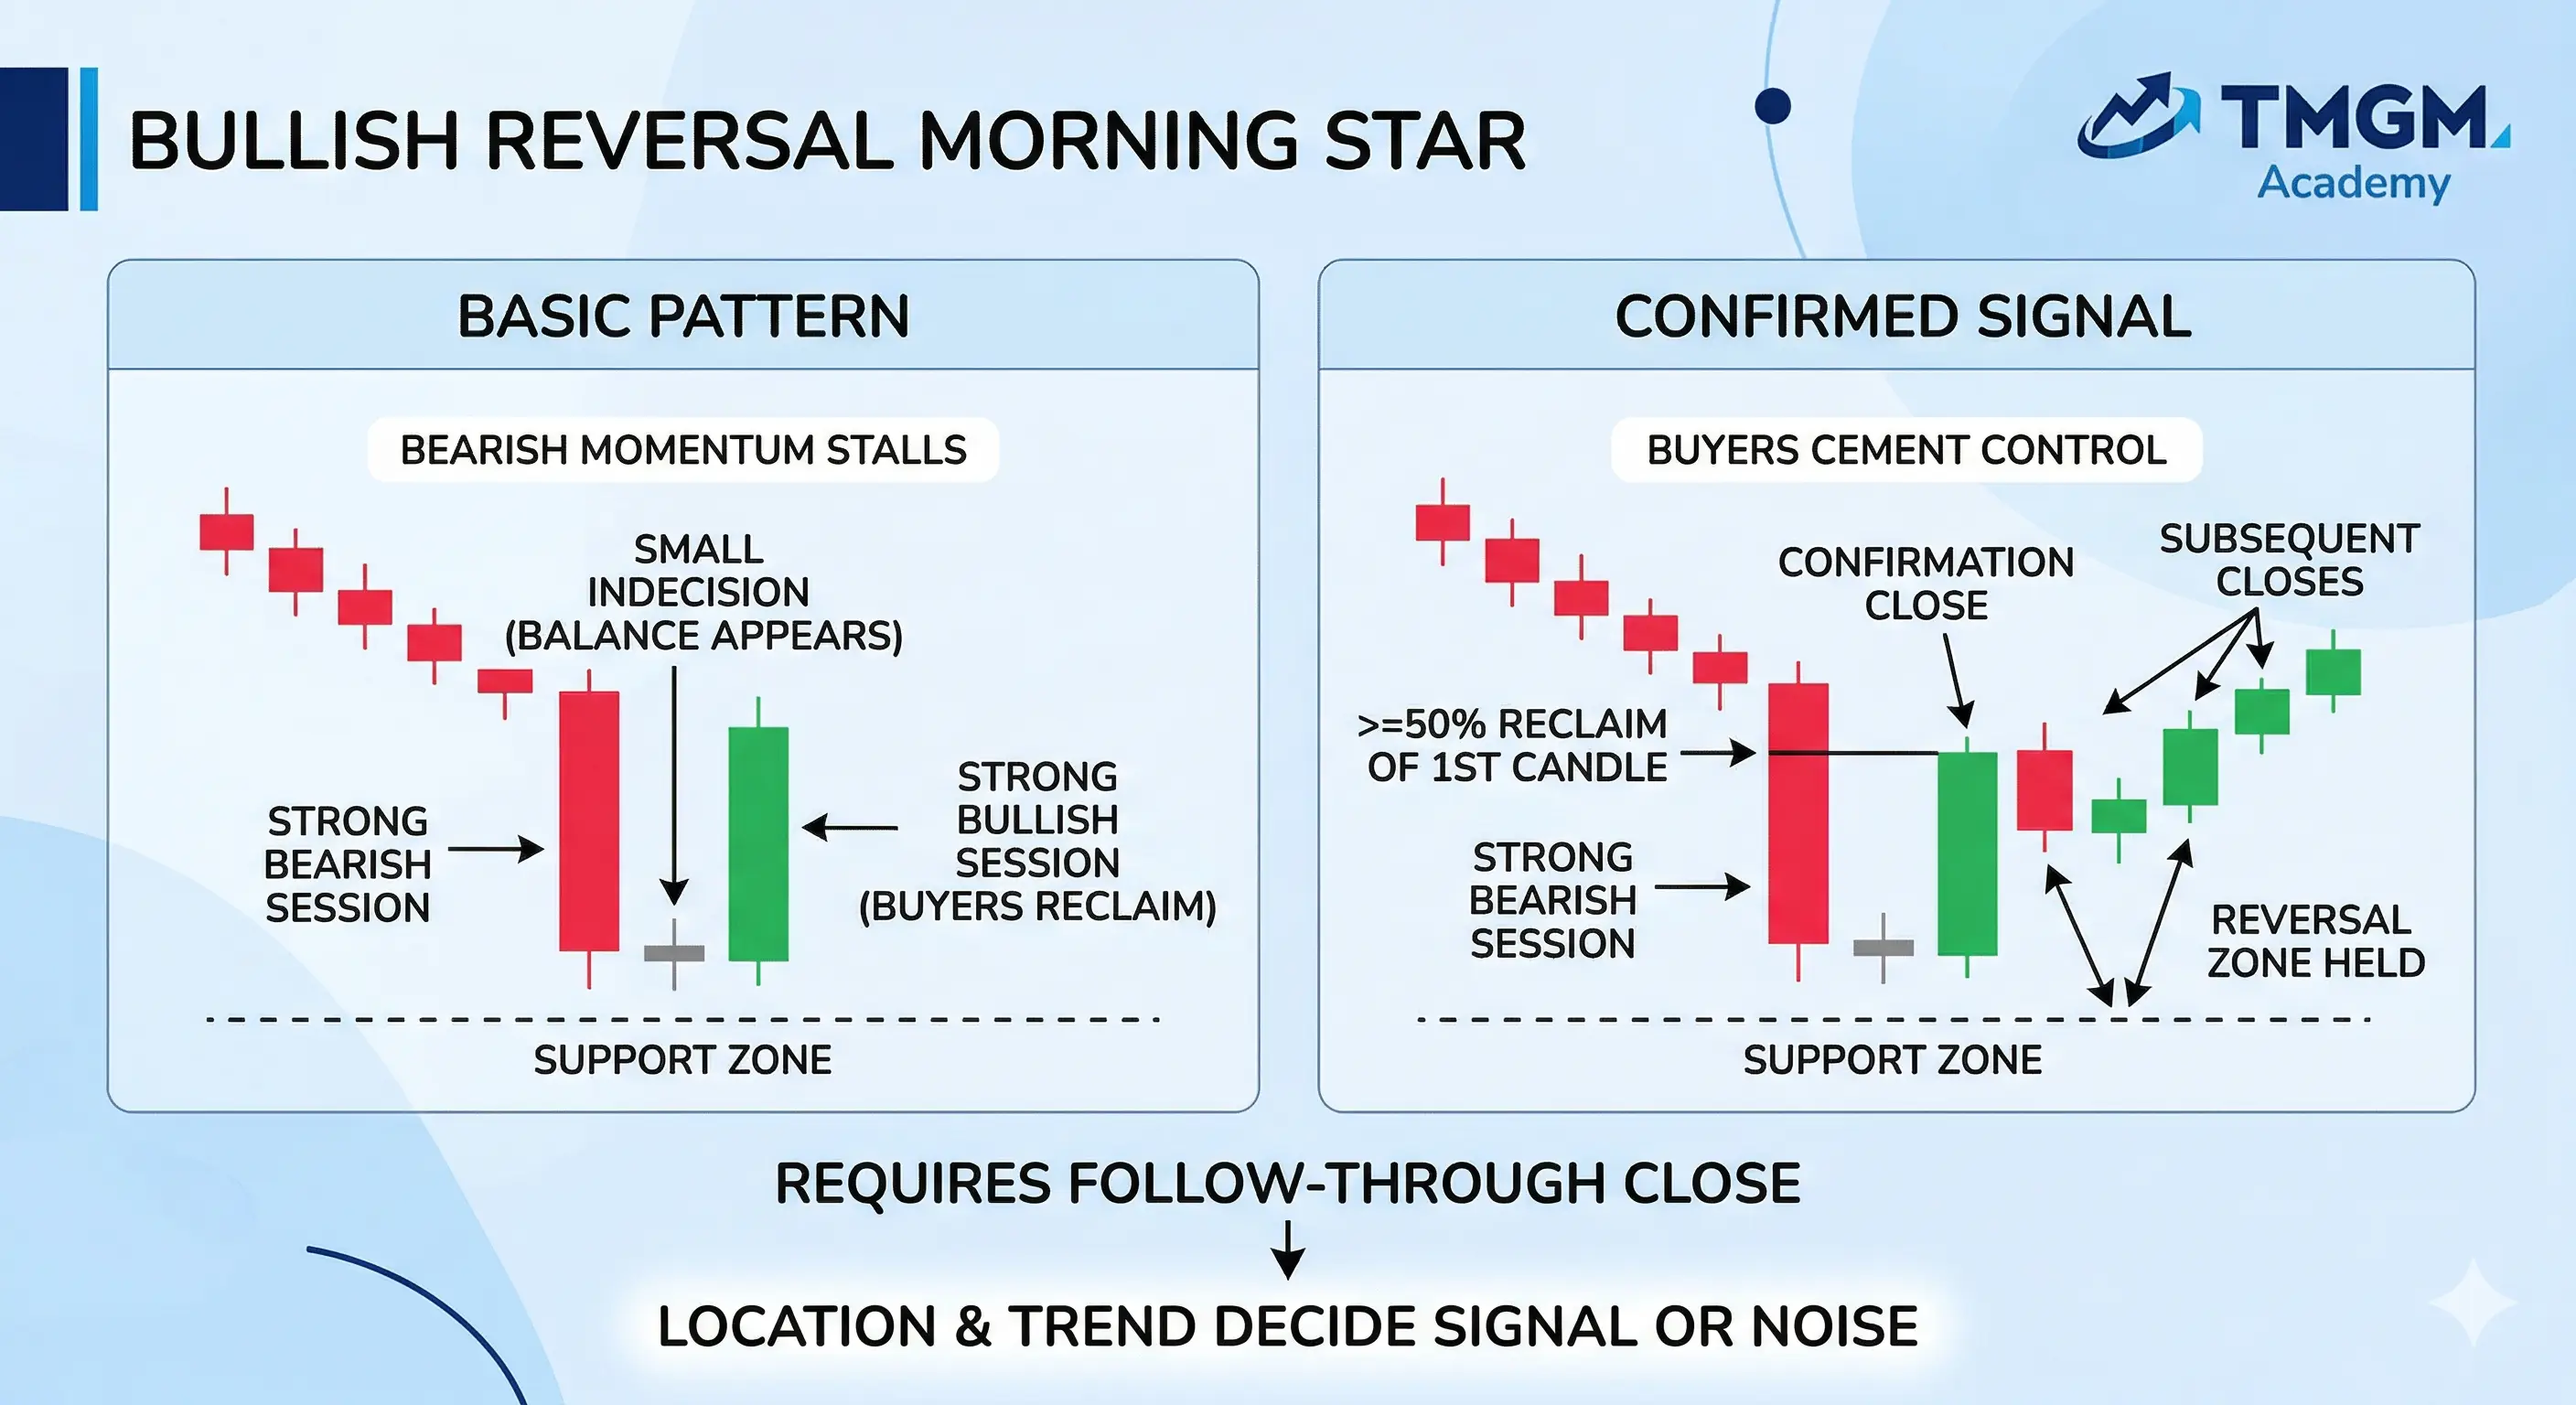
Morning Star Candlestick is a bullish reversal candlestick pattern. forms as a strong bearish candle, then a small indecision candle, then a strong bullish candle, which shows bearish momentum stalls, balance appears, and buyers reclaim control into the close. It is most reliable after a decline into support or after selling exhaustion. It is confirmed when the third candle closes strong, ideally reclaiming at least the midpoint of the first candle, and subsequent closes hold above the reversal zone.
Morning & Evening Star Candlestick Patterns
Morning star candlestick (Bullish)
A momentum rotation setup across three candles, not a one candle trick, because it needs the transition and the reclaim close.
Evening star candlestick (Bearish)
It forms as a strong bullish candle, a small indecision candle, then a strong bearish candle that closes at least to the midpoint of the first. It is most reliable after a rally into resistance.
Three White Soldiers Candlestick Pattern
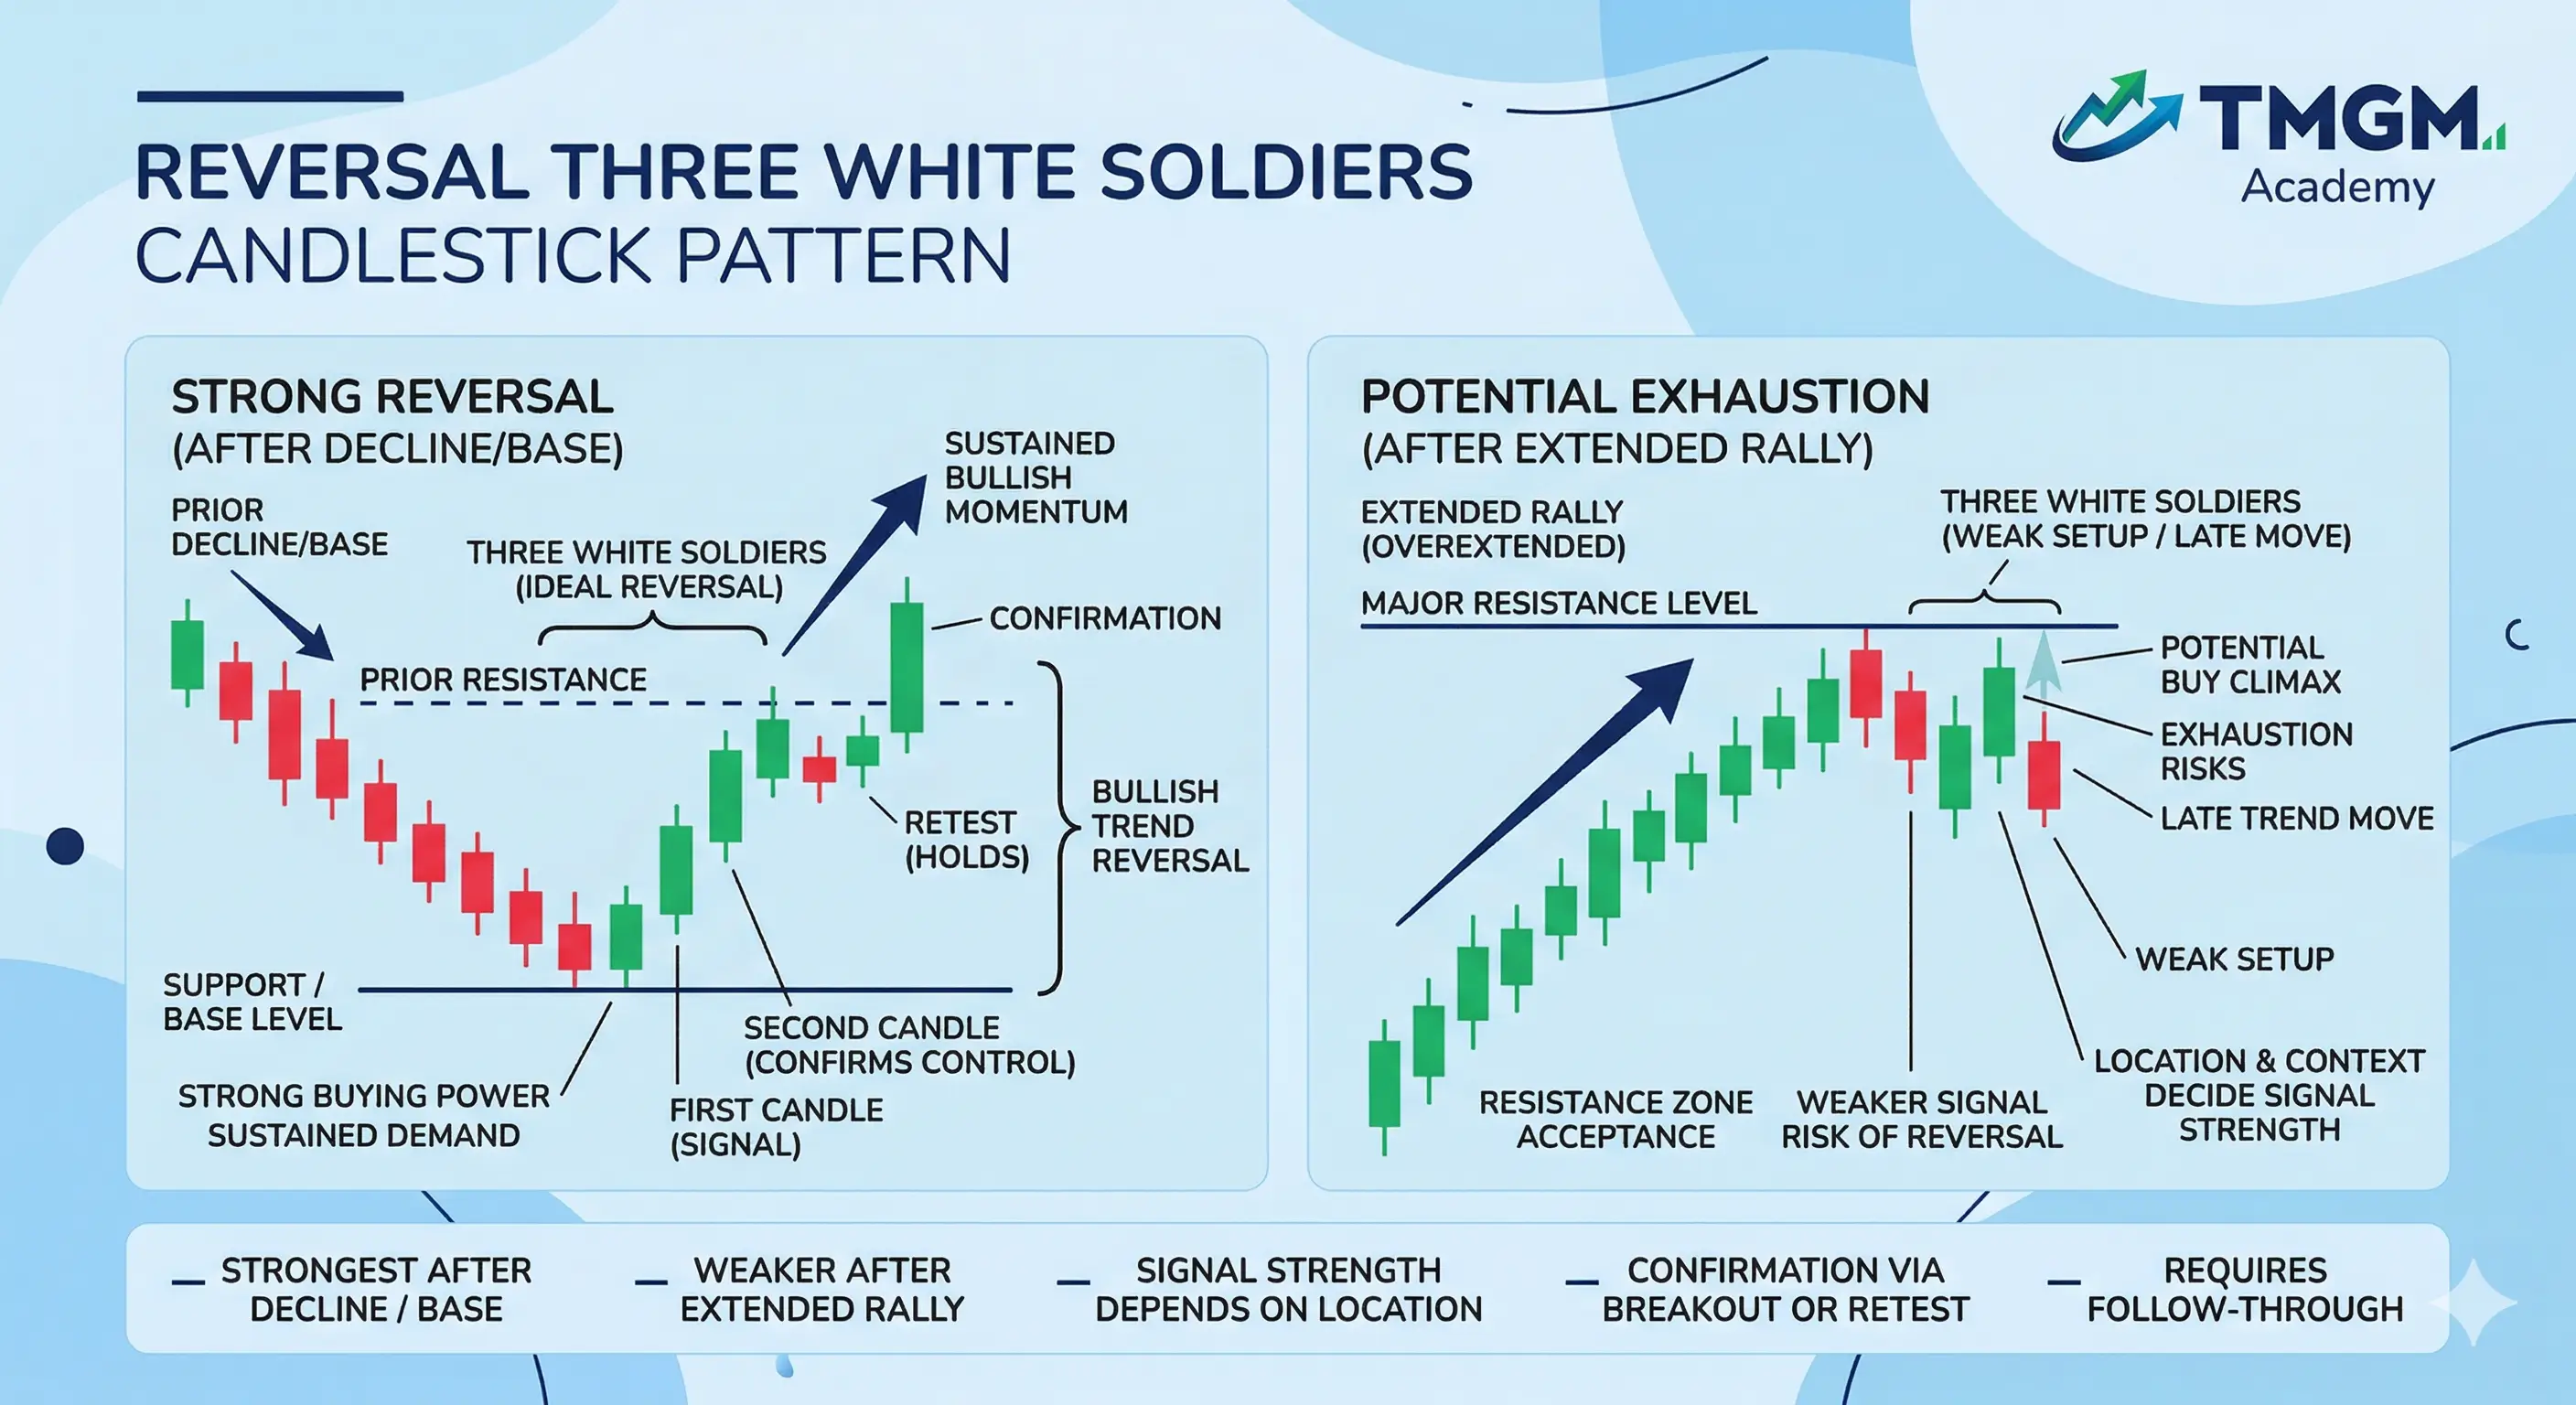
Three White Soldiers Candlestick Pattern is typically a bullish trend reversal candlestick pattern that appears after a downtrend or an uptrend. It forms as three consecutive bullish candles with strong closes, showing buyers maintain control into the close for multiple sessions and momentum is persisting. It is most reliable after a decline or a base where new buying can drive repricing, and it is weaker after a long rally because it can be late and overextended. It is confirmed when price accepts above prior resistance or holds a retest of the breakout area without immediately reversing.
The three White Soldiers Pattern is strongest after a decline or base and weaker after a long rally because it can be late and overextended. If it appears into resistance, it can mark a buy climax rather than a clean continuation.
Important: A pattern is not a signal by itself, it is evidence, and the trade comes from confirmation through the next close, a break and close beyond the pattern, and the right trend plus level context.
Three Black Crows Candlestick Pattern
The bearish counterpart to three white soldiers: three consecutive long bearish candles with short wicks, each opening within the prior body and closing near its low. It signals sustained selling control across three sessions. Like the soldiers, it is strongest after an extended move up (a distribution top) and weaker deep into a decline, where it can be late.
How Do Candlestick Patterns Work on Forex Charts?
Most candlestick theory was written for stock charts, where each day opens with a gap from the previous close. Forex trades 24 hours, so on FX charts the daily close is usually the next day's open and gaps appear only over the weekend. That changes how you read gap-dependent patterns: a morning star, evening star, dark cloud cover or piercing line that "should" gap will instead print as body overlap on FX. Read them by the size and position of the real bodies and the closing level, not by the gap. This makes single-candle and body-overlap patterns — engulfing, hammer, doji, marubozu — more directly reliable on forex than gap patterns imported straight from stock-market playbooks.
Pro Tips
Wait for Close
Directional confirmation means the next candle closes in the expected direction, not just wicks there intraday. Waiting for the close reduces false signals because it forces the market to prove control, which is the core of how to read candlestick charts.
Context Matters
Context confirmation means trend plus support or resistance, because patterns behave differently in trend versus chop. Many reversal candlestick patterns fail inside ranges because there is no trend to reverse, only rotation.
Combine with Indicators
Use indicators as filters, not as drivers, so the candle remains the primary evidence. For example, an engulfing reversal with rising volume, a bullish divergence on RSI, or a MACD momentum shift can improve signal quality without turning the setup into an indicator system.
What are the Limitations of Candlestick Patterns
Candlestick patterns can fail in predictable ways. They are weakest in ranging or sideways markets, where there is no trend to reverse — most failed reversals are just rotation inside a range. They are timeframe-sensitive: a signal's potency fades within roughly three to five candles after it completes, and a pattern on a four-hour chart carries far less weight than the same shape on a daily. They are also subjective and prone to false signals, which is why confirmation, context, and confluence with another tool matter more than the shape itself. Use higher timeframes to filter noise and never size a trade on a single candle alone.
How Do You Manage Risk When Trading Candlestick Patterns?
For a hammer, place the stop just below the hammer's low; for a shooting star, just above its high; for an engulfing setup, beyond the engulfing candle's extreme. Size the position from that distance, not from a fixed lot — a wide-range pattern needs a smaller position to keep risk constant. This turns a visual signal into a defined-risk trade and is the discipline that separates trading candlestick patterns from guessing.
Candlestick Patterns FAQ
What is Candlestick Pattern?
A candlestick pattern is a technical analysis tool used to identify price direction and market sentiment by visually representing an asset's open, high, low, and close prices over a specific period.
Can you trade using only candlestick patterns?
They work best as one input, pair them with trend, support/resistance and one confirming indicator.
Do candlestick patterns work on all timeframes?
Yes, but reliability rises with timeframe; daily and 4-hour signals are sturdier than 1-minute, and a signal fades within a few candles of completing.
What are the most reliable bullish candlestick patterns for reversals?
The most reliable bullish candlestick patterns are the ones that show takeover plus confirmation, such as bullish engulfing or a morning star at support. Single candle signals like hammer or dragonfly doji are earlier but less confirmed, so they need follow through.
Which candlestick pattern is best?
There is no single best candlestick pattern. The strongest pattern is the one that appears in the right market context, such as at support, resistance, or after a clear trend.
What is the 3 candlestick rule?
The 3 candlestick rule usually means using three candles to confirm a move. The first shows the trend, the second shows hesitation, and the third confirms direction.
What is the 2 candle strategy?
The 2 candle strategy reads two candles together to spot a shift in control. Common examples include engulfing and harami patterns.
What is the 3 bullish candle pattern called?
The 3 bullish candle pattern is called Three White Soldiers. It shows three strong bullish candles in a row and often signals a bullish reversal or strong continuation.