


Introduction
Bullish and bearish engulfing candlestick patterns are two trend reversal candlestick patterns used to spot momentum changes to enter a position by traders practicing technical analysis.
What Are Bullish and Bearish Engulfing Candlestick Patterns?
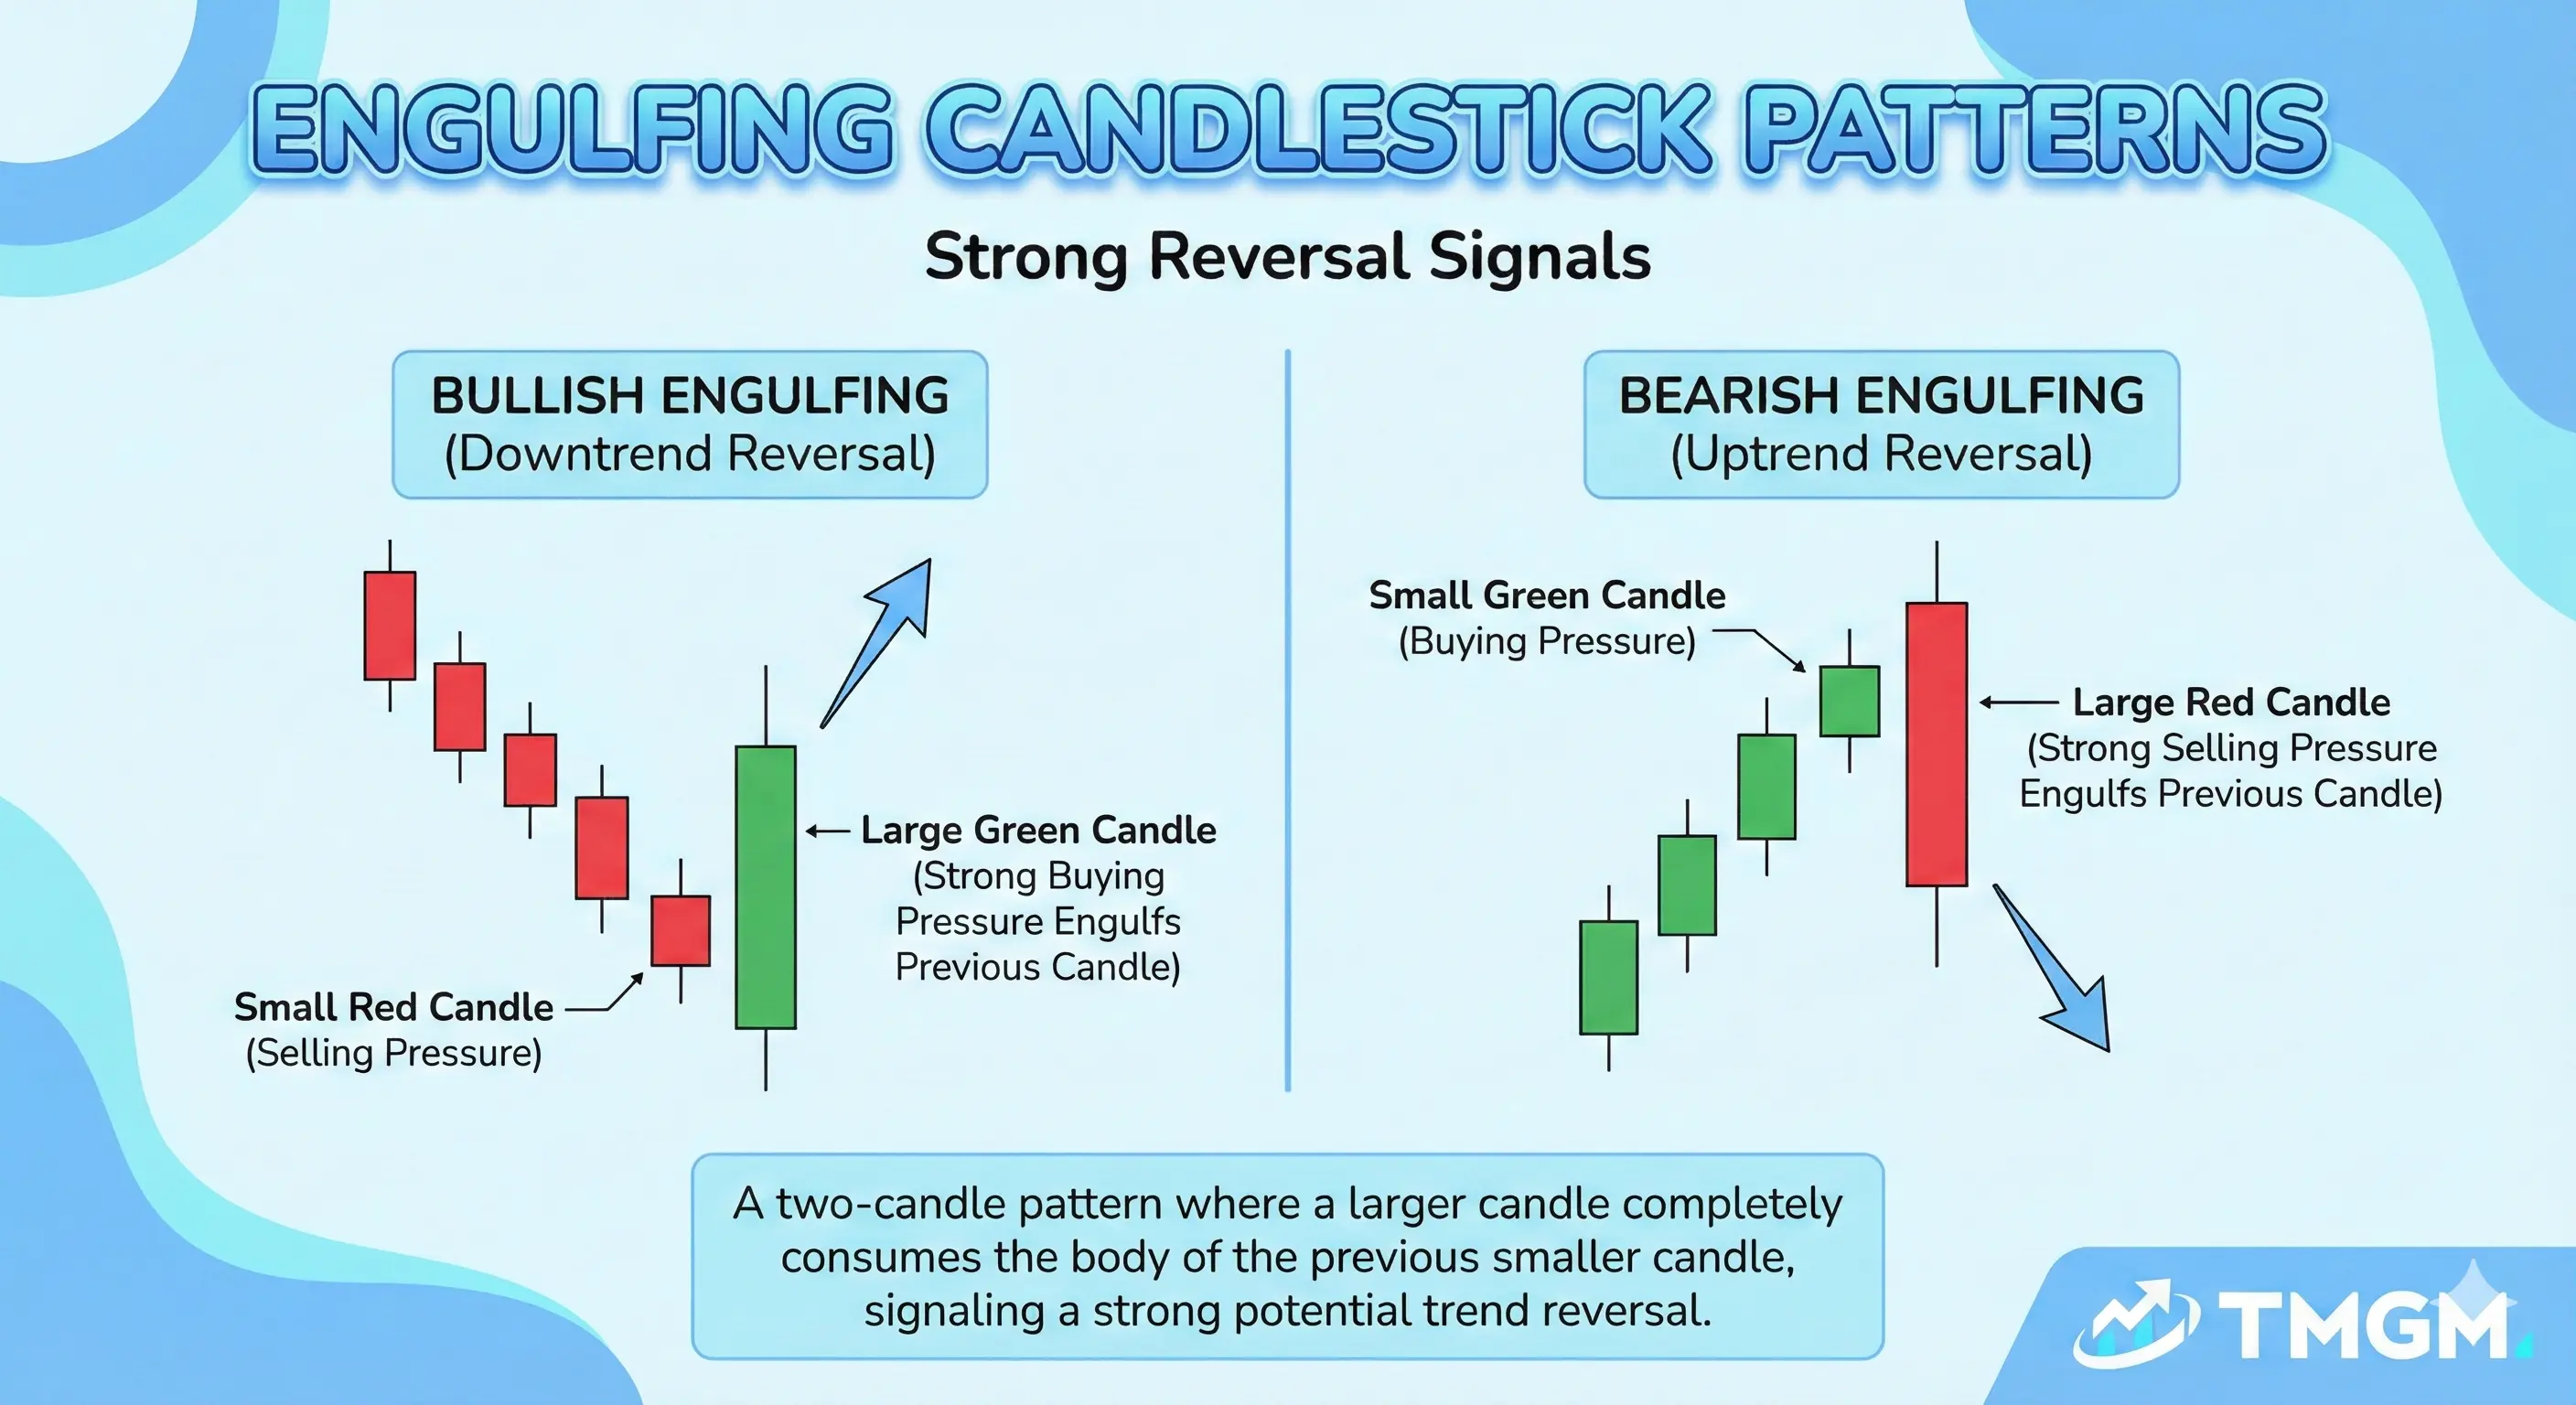
Bullish and bearish engulfing patterns are reversal formations built from two consecutive candles. The second candle’s real body fully covers the first candle’s real body, and the setup is read as a trend reversal signal from buy to sell or vice versa.
A bullish engulfing pattern forms after a decline, while a bearish engulfing pattern forms after an advance.
What Are the Key Components of an Engulfing Candle?
A valid engulfing setup starts with context. Without a prior directional move to reverse, the pattern is just two candles and not a meaningful reversal signal.
The first candle usually continues the existing move and is often smaller. The second candle flips direction and closes through the first candle’s real body, which is the core feature traders look for.
How Does an Engulfing Pattern Work in Price Action?
An engulfing pattern works by showing failed continuation. The market begins the second candle in the direction of the old move, but the opposite side takes control before the close and overturns the prior session’s real body.
In a bullish engulfing pattern, sellers press the market lower early, then buyers reverse the session and close above the prior candle’s open. In a bearish engulfing pattern, buyers push higher first, then sellers reverse the session and close below the prior candle’s open.
What Are the Types of Engulfing Candlestick Patterns?
There are only two core engulfing patterns. They are mirror images, but they appear in opposite market conditions and imply opposite trade directions.
Bullish engulfing: This pattern appears after a downtrend. A smaller bearish candle is followed by a larger bullish candle whose real body fully covers the first, signaling that buyers have seized short term control.
Bearish engulfing: This pattern appears after an uptrend. A smaller bullish candle is followed by a larger bearish candle whose real body fully covers the first, signaling that sellers have taken control.
Bullish vs Bearish Engulfing Pattern Key Differences
The two setups are structurally similar, but their meaning changes with the prior trend and the direction of the second candle. Traders read the same visual logic in opposite ways because one version implies upside reversal and the other implies downside reversal.
Trend context: Bullish engulfing follows a decline. Bearish engulfing follows an advance.
First candle: Bullish engulfing starts with a bearish candle. Bearish engulfing starts with a bullish candle.
Second candle: Bullish engulfing closes upward through the prior real body. Bearish engulfing closes downward through the prior real body.
Trade thesis: Bullish setups look for upside confirmation. Bearish setups look for downside confirmation.
Invalidation: Bullish setups usually fail below the engulfing candle’s low. Bearish setups usually fail above the engulfing candle’s high.
These are mirror image reversal signals, not separate pattern families.
How Do Traders Use a Bullish or Bearish Engulfing Pattern?
Traders usually start with location, not just the candle. An engulfing pattern is more useful when it appears after an extended swing and near a clear support or resistance zone, because that is where control often shifts.
A common workflow is simple. Wait for the engulfing candle to close, then look for confirmation such as a break of the engulfing candle’s high or low, stronger volume, RSI confirmation, or a clean reaction at support or resistance.
Entries can be aggressive or conservative. An aggressive trader may enter near the close of the engulfing candle, while a conservative trader may wait for price to trade above the high of a bullish engulfing or below the low of a bearish engulfing.
Risk is usually defined by the pattern itself. Many traders place a stop below the low of a bullish engulfing candle or above the high of a bearish engulfing candle, because a move through that level invalidates the reversal thesis.
Pro Tip: The engulfing candle gives a clear invalidation level, but it does not give a profit target, so define the exit from a nearby support/resistance level before entering.
Bullish Engulfing Pattern Example With Real Historical Price Data
This is the daily chart for EURUSD during July 2024 to August 2024. It shows a bullish engulfing pattern forming after a short pullback within a broader uptrend. The bearish prior candle reflects temporary seller control into a local swing low.
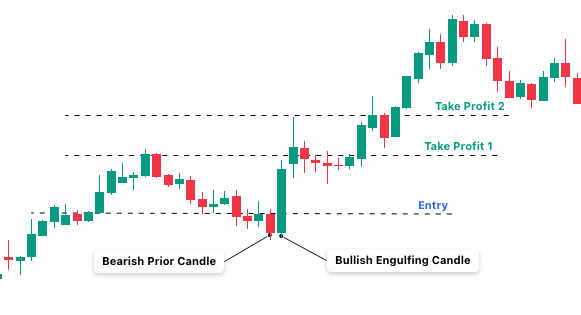
The next candle is a bullish engulfing candle. Its real body fully covers the prior bearish real body and closes strongly higher, which shows that buyers have absorbed the selling pressure and regained short term control.
In practical trade execution, the high of the bullish engulfing candle can act as the entry trigger, while the low of the same candle acts as the invalidation level. That gives the setup a clear structure because the signal candle also defines the risk boundary.
In this example, price breaks above the entry level and continues higher into Take Profit 1 before extending to Take Profit 2, both of which were drawn based on regional minor resistance level as take profit levels.
What Are the Advantages of Engulfing Candlestick Patterns?
Engulfing patterns are popular because they are easy to spot and easy to explain. A trader can quickly see trend context, reversal direction, and a logical invalidation level from just two candles.
They are also flexible. The pattern can appear on intraday, daily, weekly, or monthly charts, and traders often combine it with RSI, volume, moving averages, or support and resistance to strengthen decision making.
Another advantage is clarity of market message. The second candle shows a decisive change in session control, which makes the pattern especially useful for price action traders who want a simple visual reversal cue.
What Are the Limitations of Engulfing Candlestick Patterns?
Engulfing patterns are lagging. The signal only appears after the reversal bar has already closed, so part of the move may already be gone before the setup becomes valid.
They also fail very often in noisy markets.
The pattern does not set a price target by itself. Its edge is also time sensitive, because candlestick patterns tend to lose potency within a few bars after completion.
On 24 hour FX charts, textbook gap conditions are less common because one daily close is usually the next daily open. That means traders often need to rely more on body dominance, market structure, and confirmation than on perfect candle geometry.
FAQ
Is a bullish engulfing pattern reliable?
It can be useful, but reliability improves when it forms after a clear downtrend and gets confirmation from the next candle, volume, or nearby support.
Does a bearish engulfing pattern always mean price will fall?
No. It signals a possible reversal, but false signals are common in choppy markets and traders usually wait for follow through.
What timeframe works best for engulfing patterns?
Daily charts are often cleaner because each candle captures a full session, but the pattern can also appear on intraday, weekly, or monthly charts and only has meaning within the timeframe being traded.


