

Trading
Explore a wide range of markets with competitive pricing, deep liquidity, and advanced trading tools.
Learn More 
Platform
Trade seamlessly with TMGM's powerful platform, built for speed, precision, and a superior trading experience.
Learn More Trading Platform
Academy
Learn the fundamentals of trading with beginner-friendly resources, including guides, webinars, and market insights.
Learn More News & Analysis
Get real-time market updates and expert analysis to stay ahead of trading opportunities
Learn More News & Analysis
About
Learn what sets TMGM apart — our global presence, regulatory strength, and commitment to innovation in trading.
Learn More Why Choose TMGM
Sponsorship
GBP/JPY Price Forecast: Are Bulls Stalling Near 213.00 as SMA Resistance Holds?
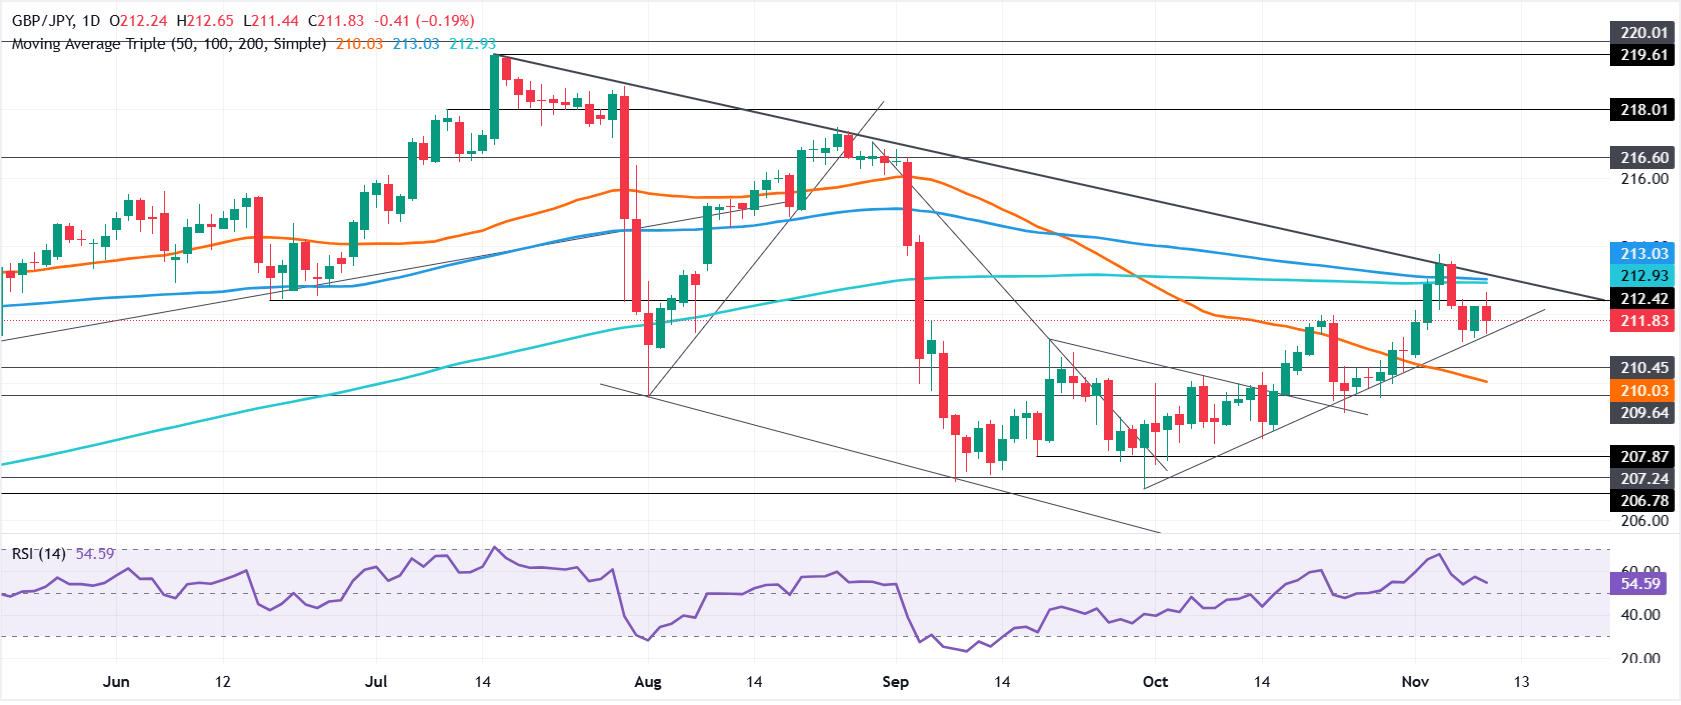
- Selling pressure takes GBP/JPY towards 211.78, with key SMA resistance still overhead.
- Buying momentum shows signs of fading as RSI turns lower despite retaining its bullish bias.
- Below 211.19, the 50-day SMA at 210.03 comes into focus, followed by 209.13.
GBP/JPY is under pressure, down about 0.22% and trading at 211.78, as safe-haven currencies such as the Japanese Yen gain against the Pound Sterling. The move follows hawkish remarks from Federal Reserve (Fed) officials that have strengthened the US Dollar.

GBP/JPY Price Forecast: Can buyers overcome key SMA resistance?
The broader technical picture still shows GBP/JPY edging upwards, but two crucial barriers remain overhead: the 100-day Simple Moving Average (SMA) at 212.93 and the 200-day SMA at 213.03. Although momentum retains a bullish bias, the declining Relative Strength Index (RSI) suggests buyers are losing their grip.
To extend the advance, GBP/JPY first needs to clear resistance in the 212.93-213.03 zone. Moving above the upper end would bring a resistance trendline near 213.20 into view. Beyond that, attention would turn to the 214.00 level and then the 25 August high of 217.48.
If the cross turns lower, last Friday’s trough at 211.19 provides the initial support. A break beneath it would put the 50-day SMA at 210.03 in focus, ahead of the 23 October swing low at 209.13.
GBP/JPY Daily Chart – Which Levels Matter?
How Is the Japanese Yen Performing Today?
The Japanese Yen’s strongest performance today was against the Australian Dollar. The table below sets out the Japanese Yen’s (JPY) percentage moves against the major currencies listed.
| USD | EUR | GBP | JPY | CAD | AUD | NZD | CHF | |
|---|---|---|---|---|---|---|---|---|
| USD | 0.47% | 0.70% | 0.51% | 0.49% | 0.90% | 0.50% | 0.68% | |
| EUR | -0.47% | 0.22% | 0.04% | 0.02% | 0.42% | 0.03% | 0.21% | |
| GBP | -0.70% | -0.22% | -0.19% | -0.18% | 0.20% | -0.23% | -0.01% | |
| JPY | -0.51% | -0.04% | 0.19% | -0.01% | 0.40% | -0.01% | 0.18% | |
| CAD | -0.49% | -0.02% | 0.18% | 0.00% | 0.41% | 0.00% | 0.19% | |
| AUD | -0.90% | -0.42% | -0.20% | -0.40% | -0.41% | -0.40% | -0.22% | |
| NZD | -0.50% | -0.03% | 0.23% | 0.00% | -0.00% | 0.40% | 0.18% | |
| CHF | -0.68% | -0.21% | 0.01% | -0.18% | -0.19% | 0.22% | -0.18% |
Percentage movements between the major currencies are displayed in the heat map. Read the base currency from the left-hand column and the quote currency from the top row. Selecting the Japanese Yen on the left and following its row across to the US Dollar, for instance, gives the percentage change for JPY (base)/USD (quote) in the intersecting cell.
POPULAR ARTICLES
1Hungarian Forint: How is the dovish MNB weighing on HUF against the Euro? – Societe Generale2British Pound: Could gains against the Euro extend further? – ING3Euro: Is hawkish pricing set to peak in Q1? – BNY4Fed's Waller calls for 50 bps hike now or signal of faster rate increases5US Dollar: Priced-in rate hikes leave little room for gains – MUFG6EUR/GBP Price Forecast: Why is the euro struggling to rebound from 19-month lows around 0.8320?7US Dollar Index: What will Fed minutes reveal as hawkish expectations confront overbought signals?8Australian Dollar: Why does weakness persist despite strong wages? – BBH9Silver Price Forecast: XAG/USD Trades Near $45.50 at Yearly Lows Amid Fed Rate Hike Bets


Get Started!
Sign up and access the Global Markets in less than 3 minutes

Connect With Us









Contacts
Phone: +61 2 8036 8388
Fax: +61 2 8036 8388
Email: support@tmgm.com



The information provided on this website is of a general nature only and does not constitute personal financial advice. Before acting on any information on this website, you should consider the suitability of the information in relation to your objectives, financial situation and needs. Investing in CFDs and FX Margin Contracts carries significant risks and is not suitable for all investors. You may lose more than your initial deposit. You do not own, or have, any interest in the underlying asset. We recommend that you seek independent advice and ensure you fully understand the risks involved before trading. It is important that you read and consider the disclosure document before you acquire any product listed on the website. The information and advertisements offered on this website are not intended for use by any person in any country or jurisdiction where such use would be contrary to local laws and regulations. The Products and Services offered on this website are not intended for residents of the United States, Malaysia and Thailand.
TMGM is authorized and regulated in various jurisdictions.
Trademax Australia Limited, trading as TMGM, is regulated by the Australian Securities and Investments Commission (ASIC), AFSL no. 436416 and is located at Level 28, One International Tower, 100 Barangaroo Avenue, 2000 Sydney, NSW Australia.
Email: support@tmgm.com.au
Trademax Global Limited, trading as TMGM, is authorized and regulated by the Vanuatu Financial Services Commission (VFSC), registration number 40356 and registered at 1276, Kumul Highway, Port Vila, Vanuatu, Republic of Vanuatu.
Email: support@tmgm.com
Trademax Global Markets (SE) Limited, trading as TMGM, is authorized and regulated by the Financial Services Authority (FSA) of Seychelles, with license number SD224. The company is registered at Office No 13, Providence Estate ABIS Centre, Mahe, Seychelles.
Email: support@tmgm.com
Trademax Global Markets (International) Pty Ltd, trading as TMGM, is authorized and regulated by the Financial Services Commission, Mauritius (FSC) with license no. GB22201012, and registered at 33, Edith Cavell Street C/o IQ EQ Fund Services (Mauritius) Ltd Port Louis, 11324 Mauritius.
Email: support@tmgm.com
Copyright © TMGM. All rights reserved