On Balance Volume: Key Takeaways
• OBV turns trading volume into one trend line. On balance volume adds or subtracts a period's volume based on whether the closing price rose or fell, which gives traders a single number to track instead of raw volume bars.
• The formula only cares about direction, not size. OBV does not weigh how much price moved. It only checks whether the close went up, down, or stayed the same compared with the previous close.
• A gap between OBV and price can flag a weakening move. When price and OBV move in opposite directions, the trend may be running low on the volume support it needs to continue.
• OBV confirms a trend more than it predicts one. As a lagging indicator, OBV reacts after the price and volume data are already in, so most traders pair it with other tools rather than trading it alone.
• The OBV number on its own means little. A rising or falling OBV line only tells you something useful next to price, the quality of the volume data behind it, and the market you are trading.
What Is On Balance Volume (OBV)?
On balance volume is a cumulative volume indicator. It keeps a running total of volume, adding it on up periods and subtracting it on down periods, so the total reflects direction, never a price level.
Joseph Granville introduced OBV in his 1963 book, Granville's New Key to Stock Market Profits, where he argued that volume tends to move ahead of price. Traders still use OBV today to check whether the volume behind a price move supports it or contradicts it.
What Does OBV Measure?
On balance volume measures the net push of buying and selling volume behind a price, not the price itself. Each period's volume gets added to the running total when the close rises and subtracted when the close falls, so the OBV line reflects the pressure building behind price moves.
OBV does not show actual buy and sell orders directly. It is a calculation built from closing price direction and volume, which traders treat as a reasonable stand in for that pressure, not a live order count. How to read that pressure against price comes later in this article.
How Is OBV Calculated?
OBV is calculated from four inputs. They are the current closing price, the previous closing price, the current period's volume, and the previous OBV value. Comparing the two closing prices decides whether that period's volume gets added, subtracted, or left out of the running total.
On Balance Volume Formula
The OBV formula runs on three conditions by comparing the current close with the previous day's close, shown below.
Condition | OBV Calculation |
Closing price rises above the previous close | Current OBV equals the previous OBV plus the current period's volume, effectively adding volume |
Closing price falls below the previous close | Current OBV equals the previous OBV minus the current period's volume, effectively subtracting volume |
Closing price equals the previous close | Current OBV stays the same as the previous OBV |
OBV needs a starting point before it can run. Most charting platforms set the first OBV value to zero or to that period's volume, then apply the three rules above from the next period onward. OBV is a cumulative sum, so the absolute value can be positive or negative depending on where the calculation started. Only the direction and shape of the OBV line going forward are useful.The table below uses hypothetical prices and volume to show the mechanics. It is not real market data.
OBV Calculation Example
Period | Closing Price | Volume | Direction | OBV |
1 | $50.00 | 1,200 | Starting period | 1,200 |
2 | $50.50 | 1,500 | Close rose | 2,700 |
3 | $50.20 | 900 | Close fell | 1,800 |
4 | $50.20 | 1,100 | Close unchanged | 1,800 |
5 | $51.00 | 2,000 | Close rose | 3,800 |
Period 3 shows the subtraction rule, and period 4 shows OBV holding steady when the close does not change from the prior period, even though volume still traded that period. As a simplified intuition, OBV can be viewed as the number of up days minus down days multiplied by average volume. Even very small price moves still count, and days with less than 0.25% price change accounted for 14.5% of OBV changes.
How to Read the On Balance Volume Indicator
Reading OBV means comparing its direction and swing points with the price chart next to it, not reading the OBV number on its own. This is also how traders spot on balance volume divergence, which shows up when price and OBV stop moving the same way.
The absolute OBV value carries no meaning by itself, because it depends on wherever the calculation started counting. What matters is whether OBV is rising, falling, or forming higher or lower swing points compared with price, which the next few sections cover in detail.
What Rising and Falling OBV Mean
A rising OBV line means volume is building on up days faster than it is leaving on down days, which traders read as buying pressure building under the price. A falling OBV line means the opposite, and a rise in the line can reflect upward momentum when volume builds with price, while a fall can warn that volume support is fading. Volume is draining out on down periods faster than it builds on up periods, which points to selling pressure.
A flat or sideways OBV line means volume on up periods and down periods is roughly balanced, so neither side is clearly in control. None of these movements guarantee what price will do next. OBV direction is one piece of context, not a signal to act on by itself.
How OBV Confirms a Price Trend
OBV confirms a price trend when both it and price movement move in the same direction at the same time. If price makes a higher high and OBV also makes a higher high, the volume behind the move leaves the trend better supported. If price rises but OBV fails to make a new high, the trend is climbing without full volume support, which is a warning sign rather than a signal to exit.
Some research has found a 0.959 correlation between OBV and price movement, which is why traders mainly use it to confirm trends rather than treat it as a standalone signal.
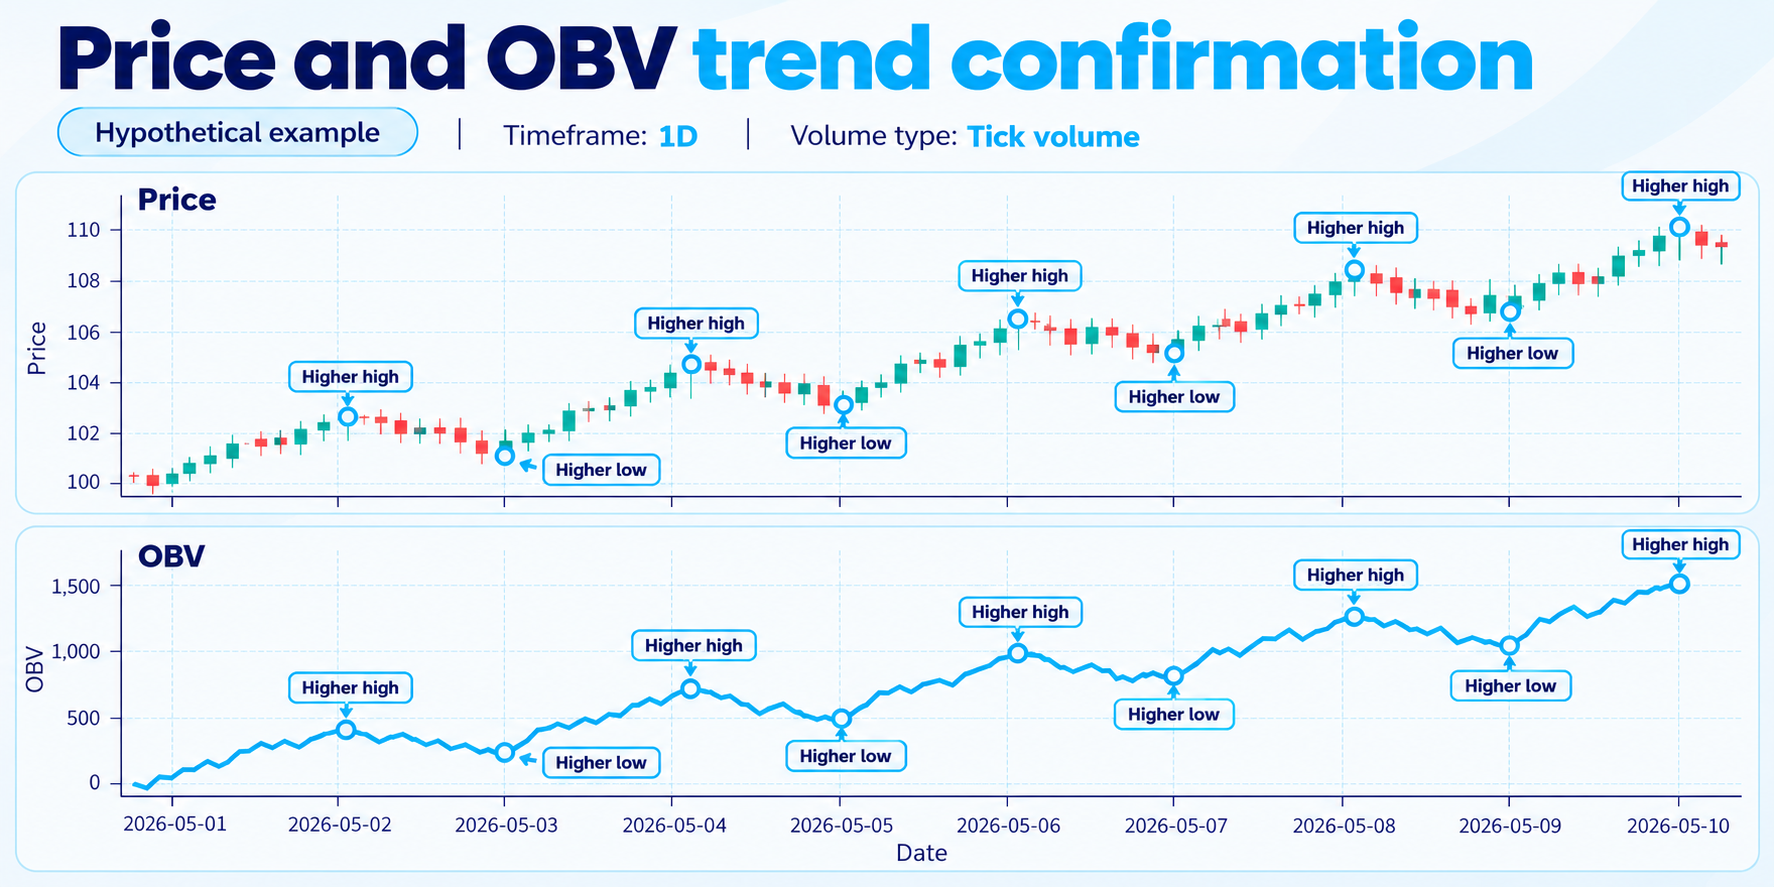
Confirmation from OBV does not trigger a trade on its own. It is one input traders weigh alongside price structure, support and resistance, and other tools before deciding anything.
How to Identify Bullish OBV Divergence
Bullish OBV divergence happens when price makes a lower low while OBV makes a higher low at the same point. Price looks weak, but the volume behind it is actually improving, which can mean selling pressure is fading before price shows it.
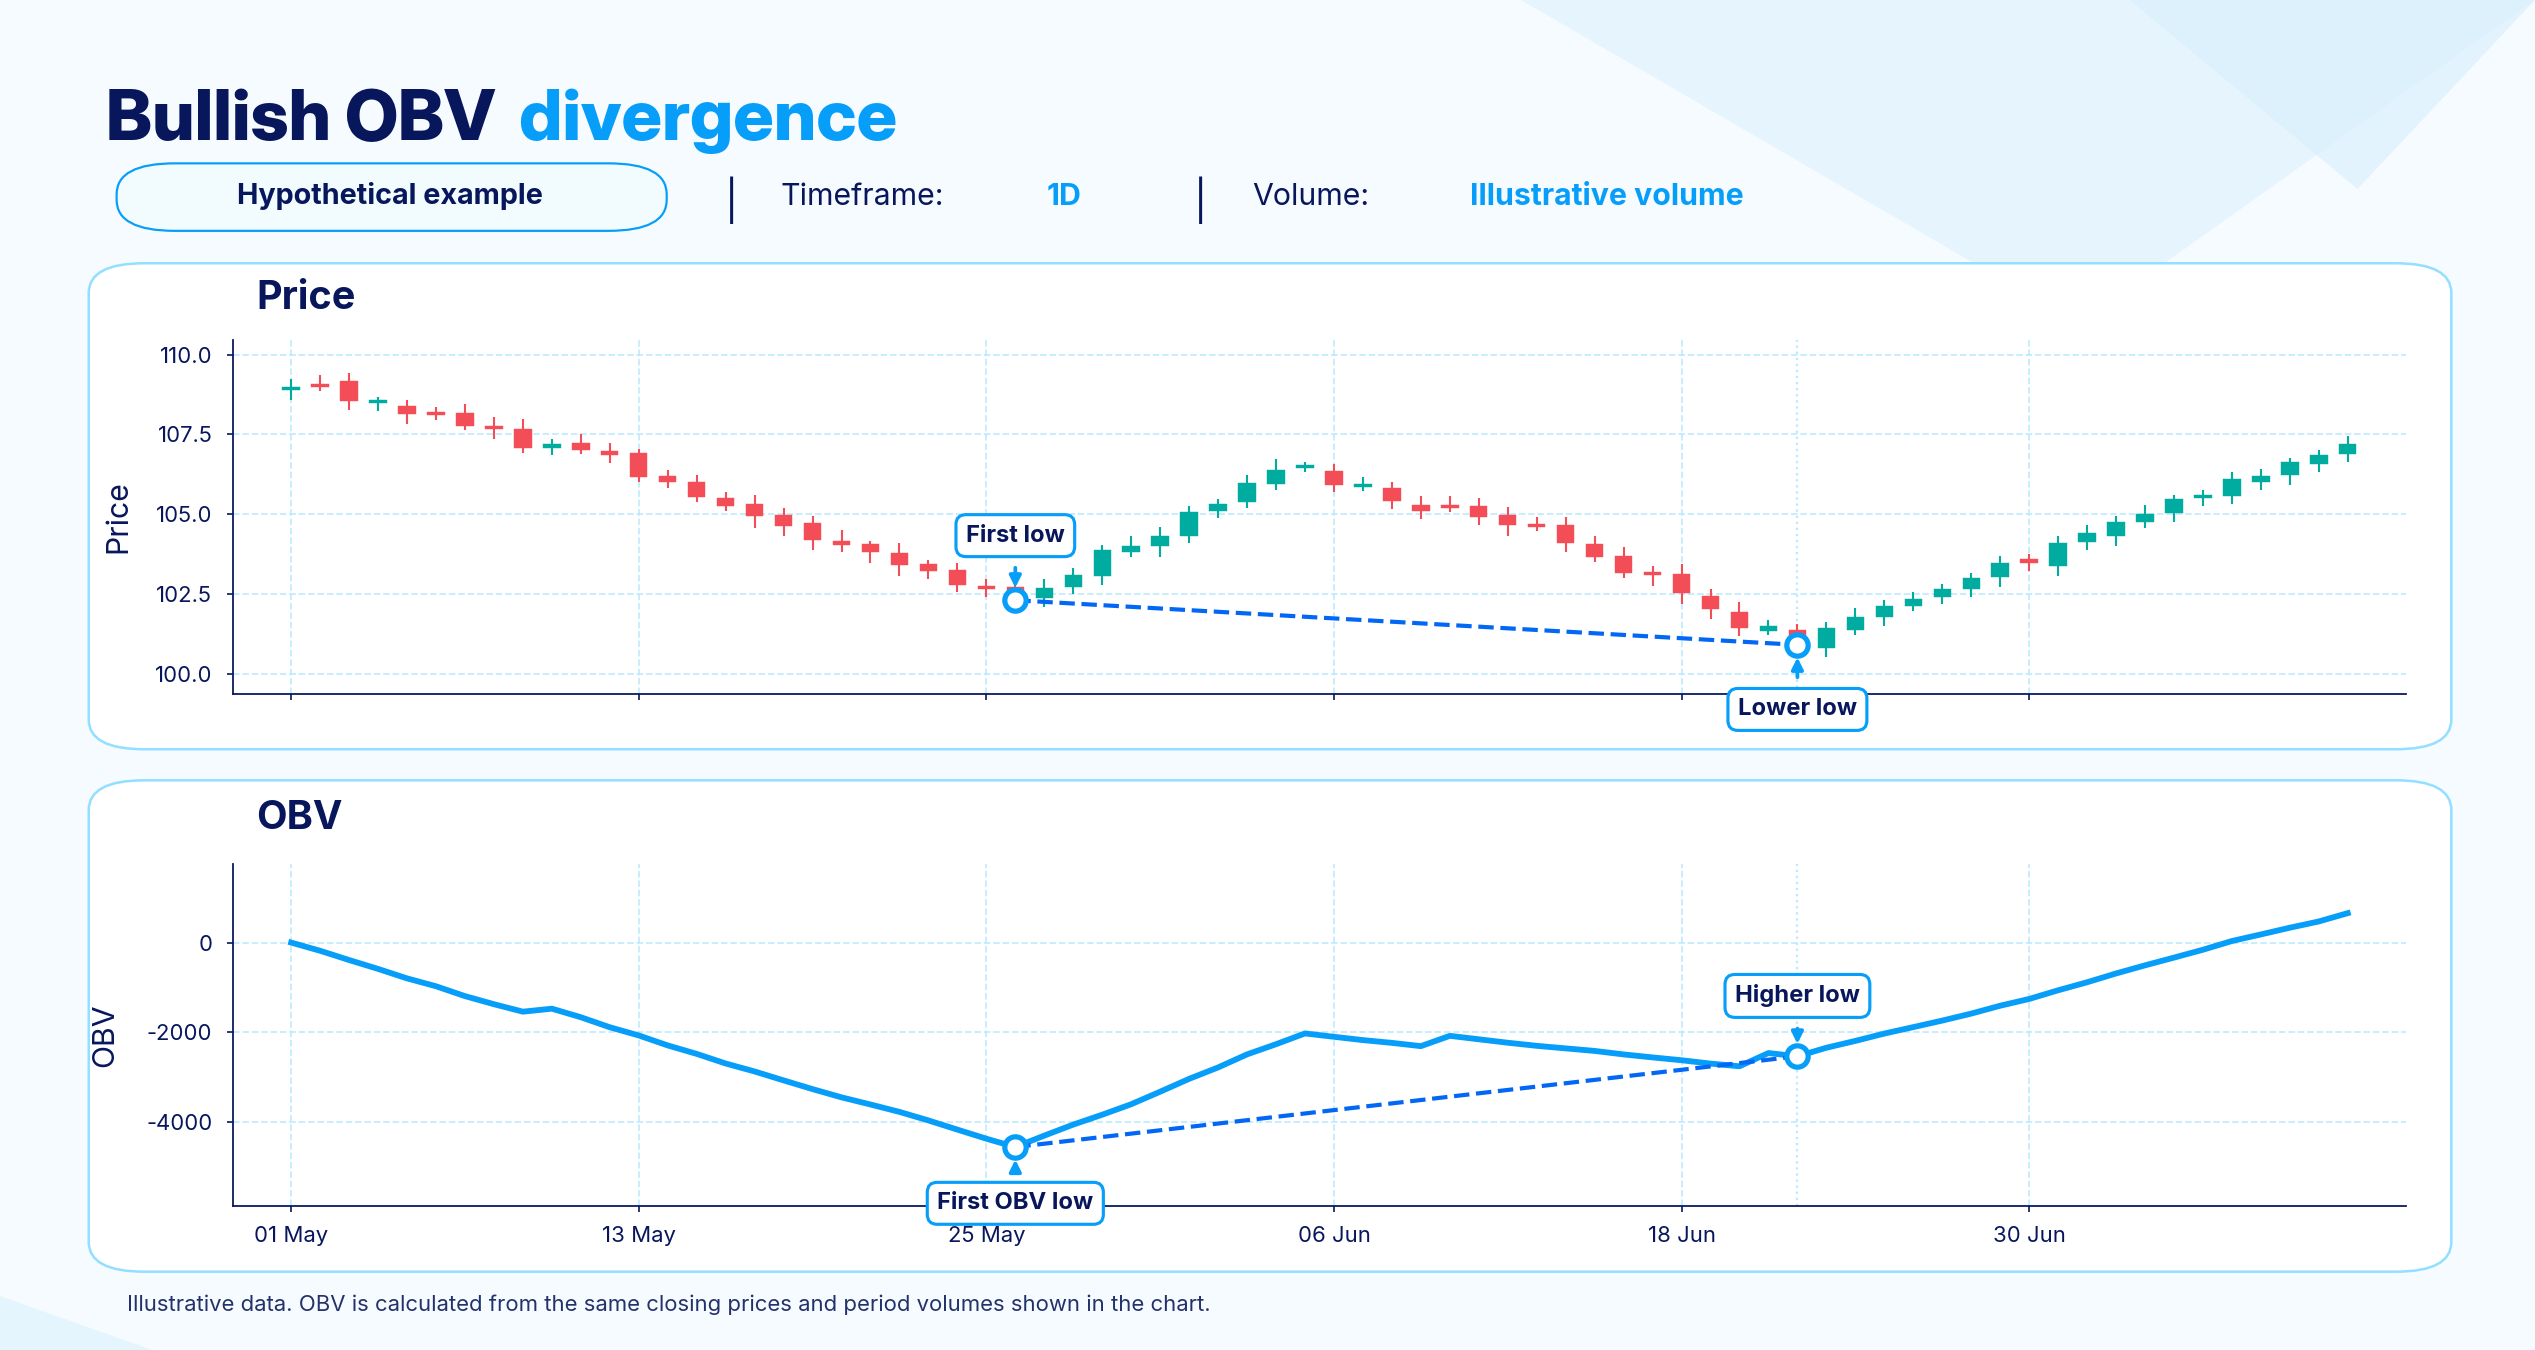
Spotting the pattern on a chart is not enough on its own. Traders usually wait for price to confirm the shift, for example with a break above a recent swing high, before treating the divergence as more than an early warning.
How to Identify Bearish OBV Divergence
Bearish OBV divergence happens when price makes a higher high while OBV makes a lower high at the same point. Price looks strong, but the volume supporting it is fading, which can mean buying pressure is running out before price turns.
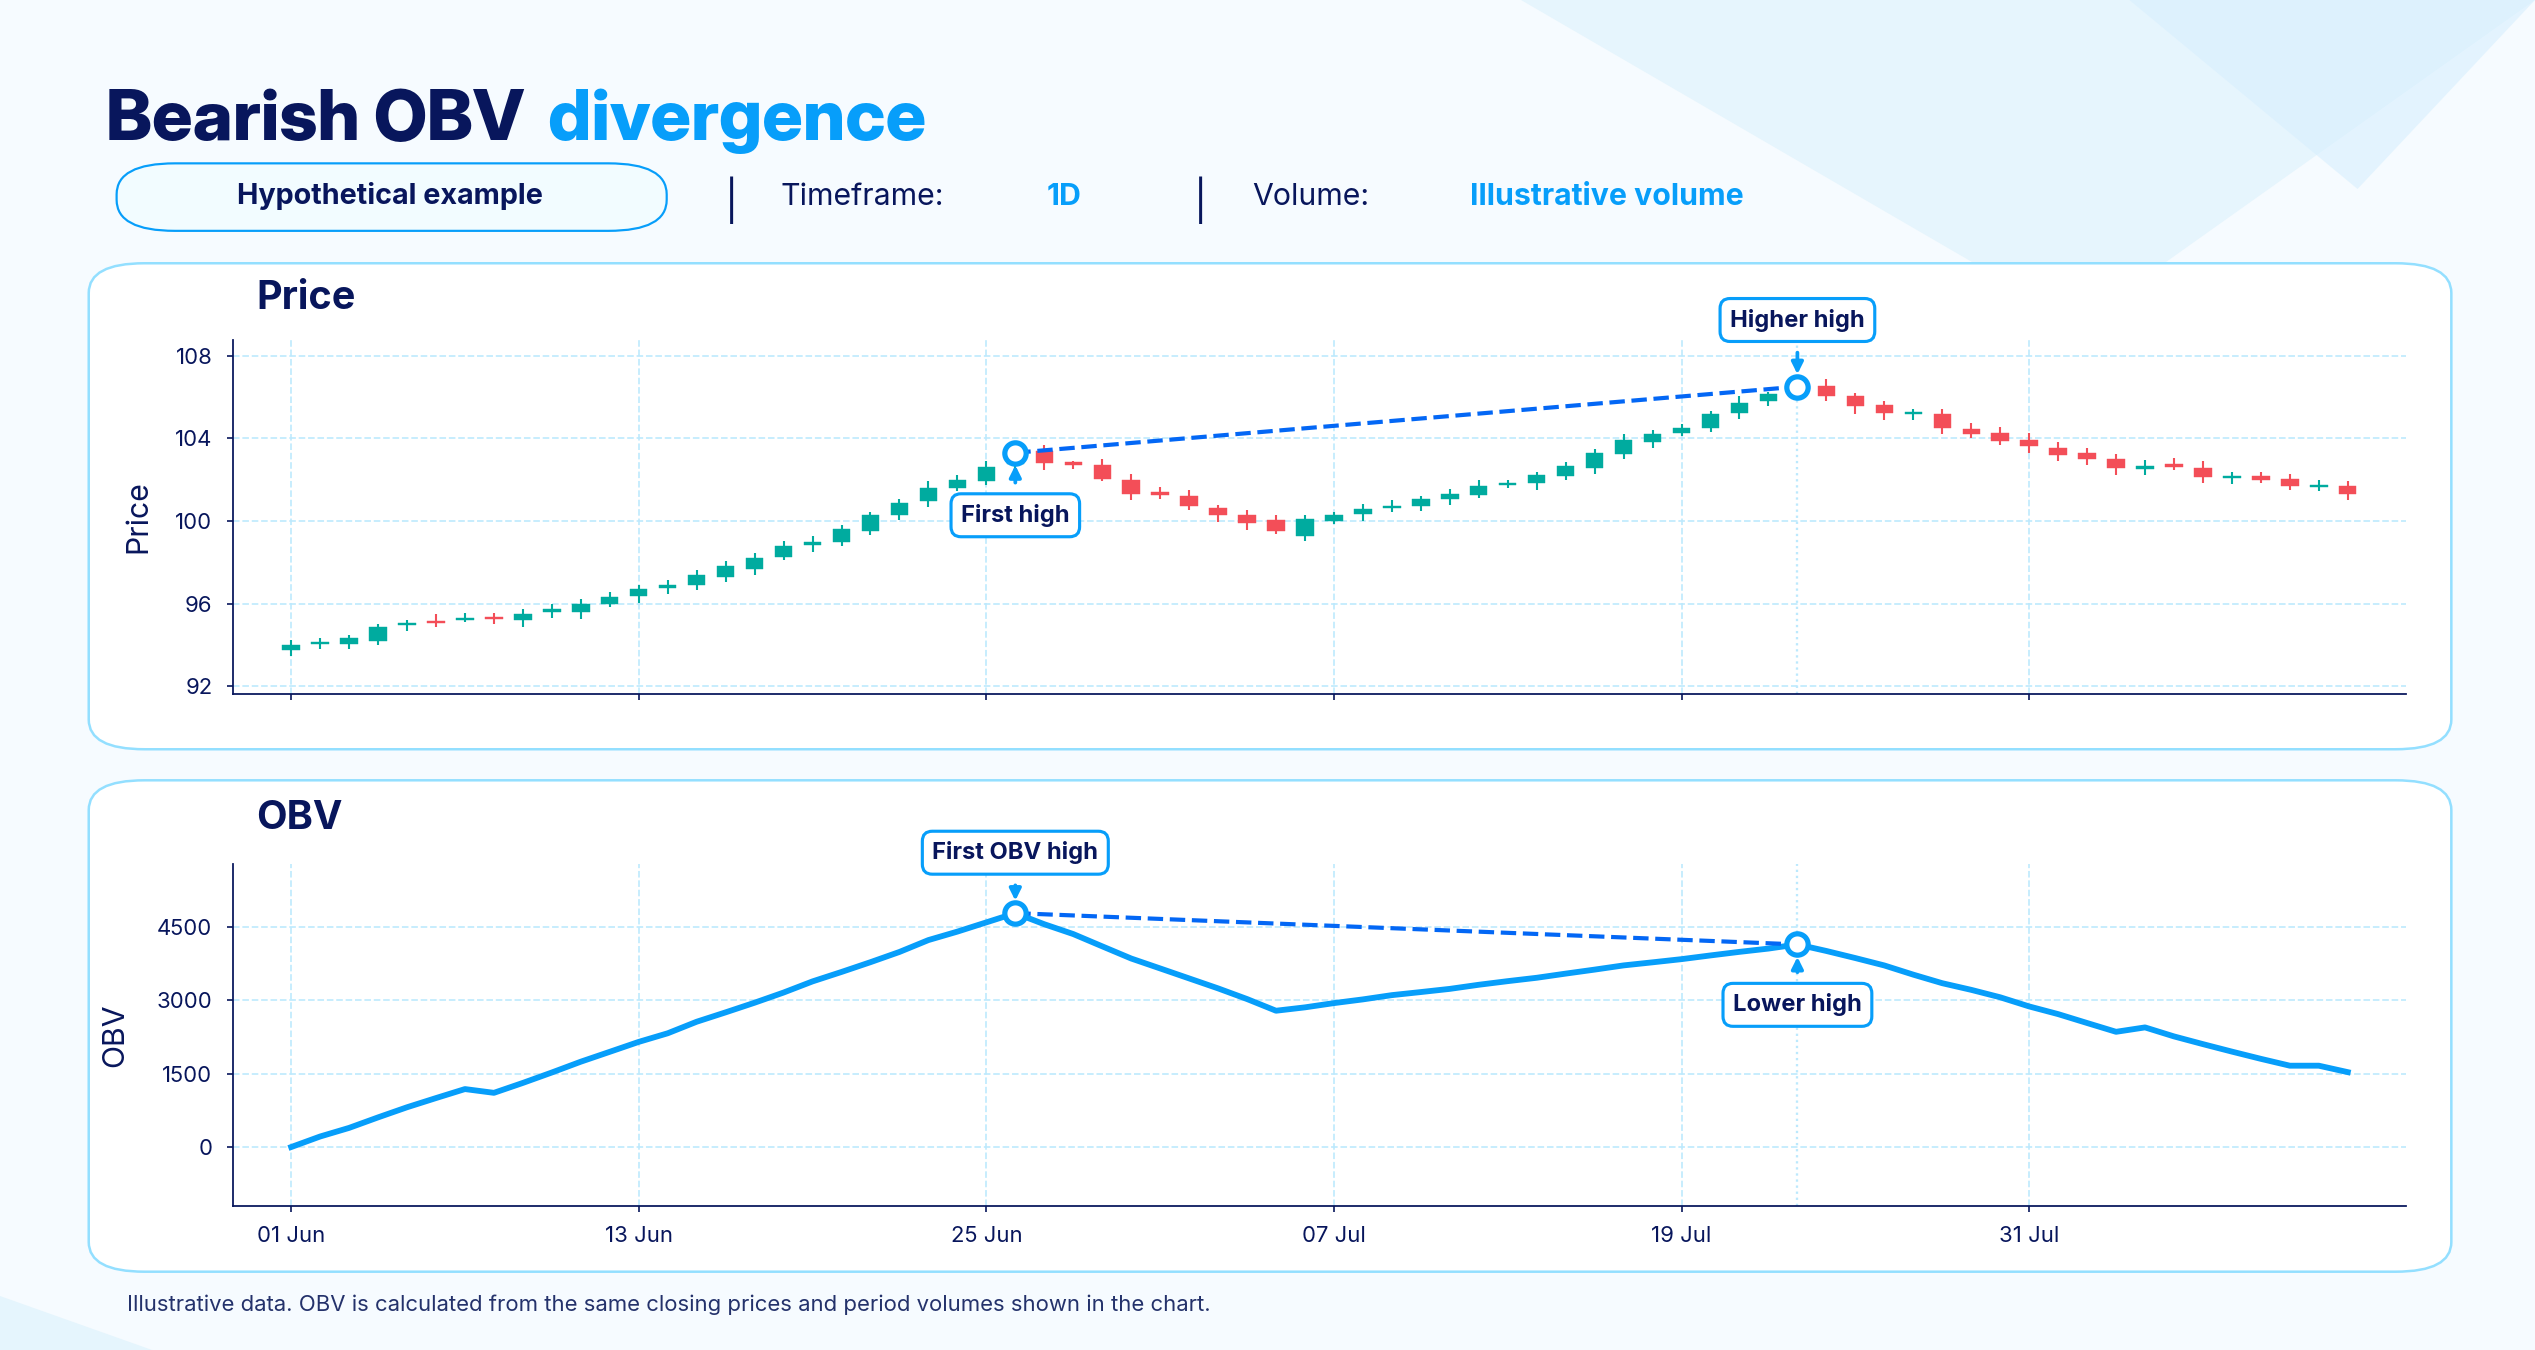
This pattern is a warning sign, not a timing tool for a reversal. The gap between price and OBV can persist for a long stretch before price actually turns, if it turns at all.
What Are the Advantages of OBV?
OBV adds a volume based check to price analysis that price alone cannot give. A rising or falling price line only shows direction. OBV next to it shows whether real volume supports that move. That context helps in three main ways.
Trend confirmation. Matching moves in price and OBV support the idea that a trend is more credible when the price move is supported by real volume, not just a few large trades pushing price around.
Early divergence warnings. A gap between price and OBV can help traders read the volume pressure behind a move and flag weakening buying or selling pressure before price reacts to it.
Broad usability. The formula only needs closing price and volume, so OBV works across stocks, forex pairs, and other liquid markets where volume data is available.
What Are the Limitations of OBV?
OBV has four main limitations traders need to weigh before relying on it.
False signals. A single large trade or a short lived volume spike can shift OBV sharply without reflecting a real change in buying or selling pressure.
Volume spikes around news and expiries. Earnings releases, economic data, and contract expiries can produce volume that has little to do with the trend forming around it, which can distort the OBV line for a short period.
Data quality differences. Forex and some other markets do not have one centralized volume figure. The OBV line on a given chart is only as reliable as the volume data feeding it, covered in more detail later in this article.
No weighting for the size of the move. The formula adds or subtracts the full volume figure whether the close moved by a wide margin or barely at all, so a small price change can carry the same weight in the calculation as a large one.
Because of these limitations, OBV works best next to price structure and at least one other tool, not as a standalone signal. A lagging indicator like OBV confirms what has already happened in price and volume. It does not predict where price goes next.
How to Use the On-Balance Volume Indicator in Trading
Using OBV in trading follows a simple workflow. Establish price context, compare OBV with that price action, look for confirmation or divergence, and weigh any signals that conflict. OBV can also sit alongside broader day trading strategies for beginners that define entries, exits, and risk management rules.
Start with price. Identify the current trend, range, or key level on the price chart before looking at OBV at all. OBV only makes sense next to price, never on its own.
Compare OBV with price over the same period. Judge whether the trend and volume are moving together by checking whether OBV is making matching highs and lows, or breaking away from them.
Look for confirmation or divergence. A matching move suggests trends are strengthening. A gap between price and OBV can show they are weakening, so it is a warning sign worth watching, not an entry signal.
Weigh conflicting signals. If OBV disagrees with another tool you use, such as a moving average or price action, treat that as a reason for caution rather than ignoring one of them.
When Should You Use OBV?
Use OBV when you want a second opinion on a trend, a potential breakout, or a possible shift in buying and selling pressure. It fits three common situations.
Assessing a trend. Checking whether OBV is moving with price helps confirm a trend has real volume support.
Watching a potential breakout. Rising OBV ahead of or alongside a price breakout suggests volume is building behind the move.
Spotting price and volume divergence. A gap between price and OBV direction can flag a trend that is losing strength.
Treat an unclear OBV reading, or a market with patchy volume data, as a reason to lean more on price and less on OBV for that decision. OBV adds value when the signal is clear and the volume data behind it is reliable, not in every situation.
How to Combine OBV With Price Action and Moving Averages
OBV works best as one voice in a small group of tools, not the only one. Price action shows what buyers and sellers have actually agreed to pay, through candles, support, resistance, and chart patterns, and traders often lean on reversal candlestick patterns in price action to flag potential turning points. OBV adds volume context to that picture, showing whether the move has real participation behind it. A moving average smooths price into a single trend line, which gives a cleaner read on direction than raw price alone. A volume moving average can also be layered onto the chart to compare current volume with its recent baseline while OBV helps with direction, and different timeframes can change how that read looks.
When all three line up, for example price breaking a resistance level, OBV rising alongside it, and price trading above a rising moving average, the combined picture is stronger than any one tool on its own. When they disagree, for example price breaking higher while OBV stalls, that conflict is useful information. It suggests the move may lack the volume or trend support to continue, which is a reason for caution rather than a signal to trade against the breakout.
On-Balance Volume Trading Strategy
This section walks through one illustrative OBV strategy built around trend confirmation. It is a teaching example that shows how the pieces fit together, not a system with a guaranteed edge. The objective is to use OBV as a filter that confirms a trend before acting on a price signal, in liquid markets with reliable volume data, such as major forex pairs or heavily traded stocks.
OBV Trend Confirmation Strategy Rules
Price condition. Price is in an established trend, for example making a series of higher highs and higher lows in an uptrend.
OBV confirmation. OBV is also making higher highs and higher lows over the same swings, matching the direction of price.
Additional filter. Price is trading on the correct side of a chosen moving average, such as above a rising 50 period moving average in an uptrend, which adds a second form of confirmation.
When to skip the setup. Skip the setup when OBV is flat or diverging from price, when volume data on the instrument is unreliable or thin, or when a major news event is due that could distort volume readings.
Entry, Exit, and Invalidation Criteria
A potential entry trigger in this strategy is a new swing high in price that lines up with a new swing high in OBV, inside the established uptrend described above. A stop loss sits below the most recent swing low on the price chart, sized to the trader's own risk tolerance and position size.
An exit can come from a predefined profit target, a trailing stop, or a clear reversal signal on price. The setup is invalidated if OBV diverges from price on the next swing, if price closes back below the moving average used as the filter, or if the broader trend context changes.
None of these levels are universal settings that work on every instrument or timeframe. They illustrate how the pieces of the strategy connect, and each trader adjusts them to their own risk tolerance and the market being traded.
OBV Trading Strategy Example
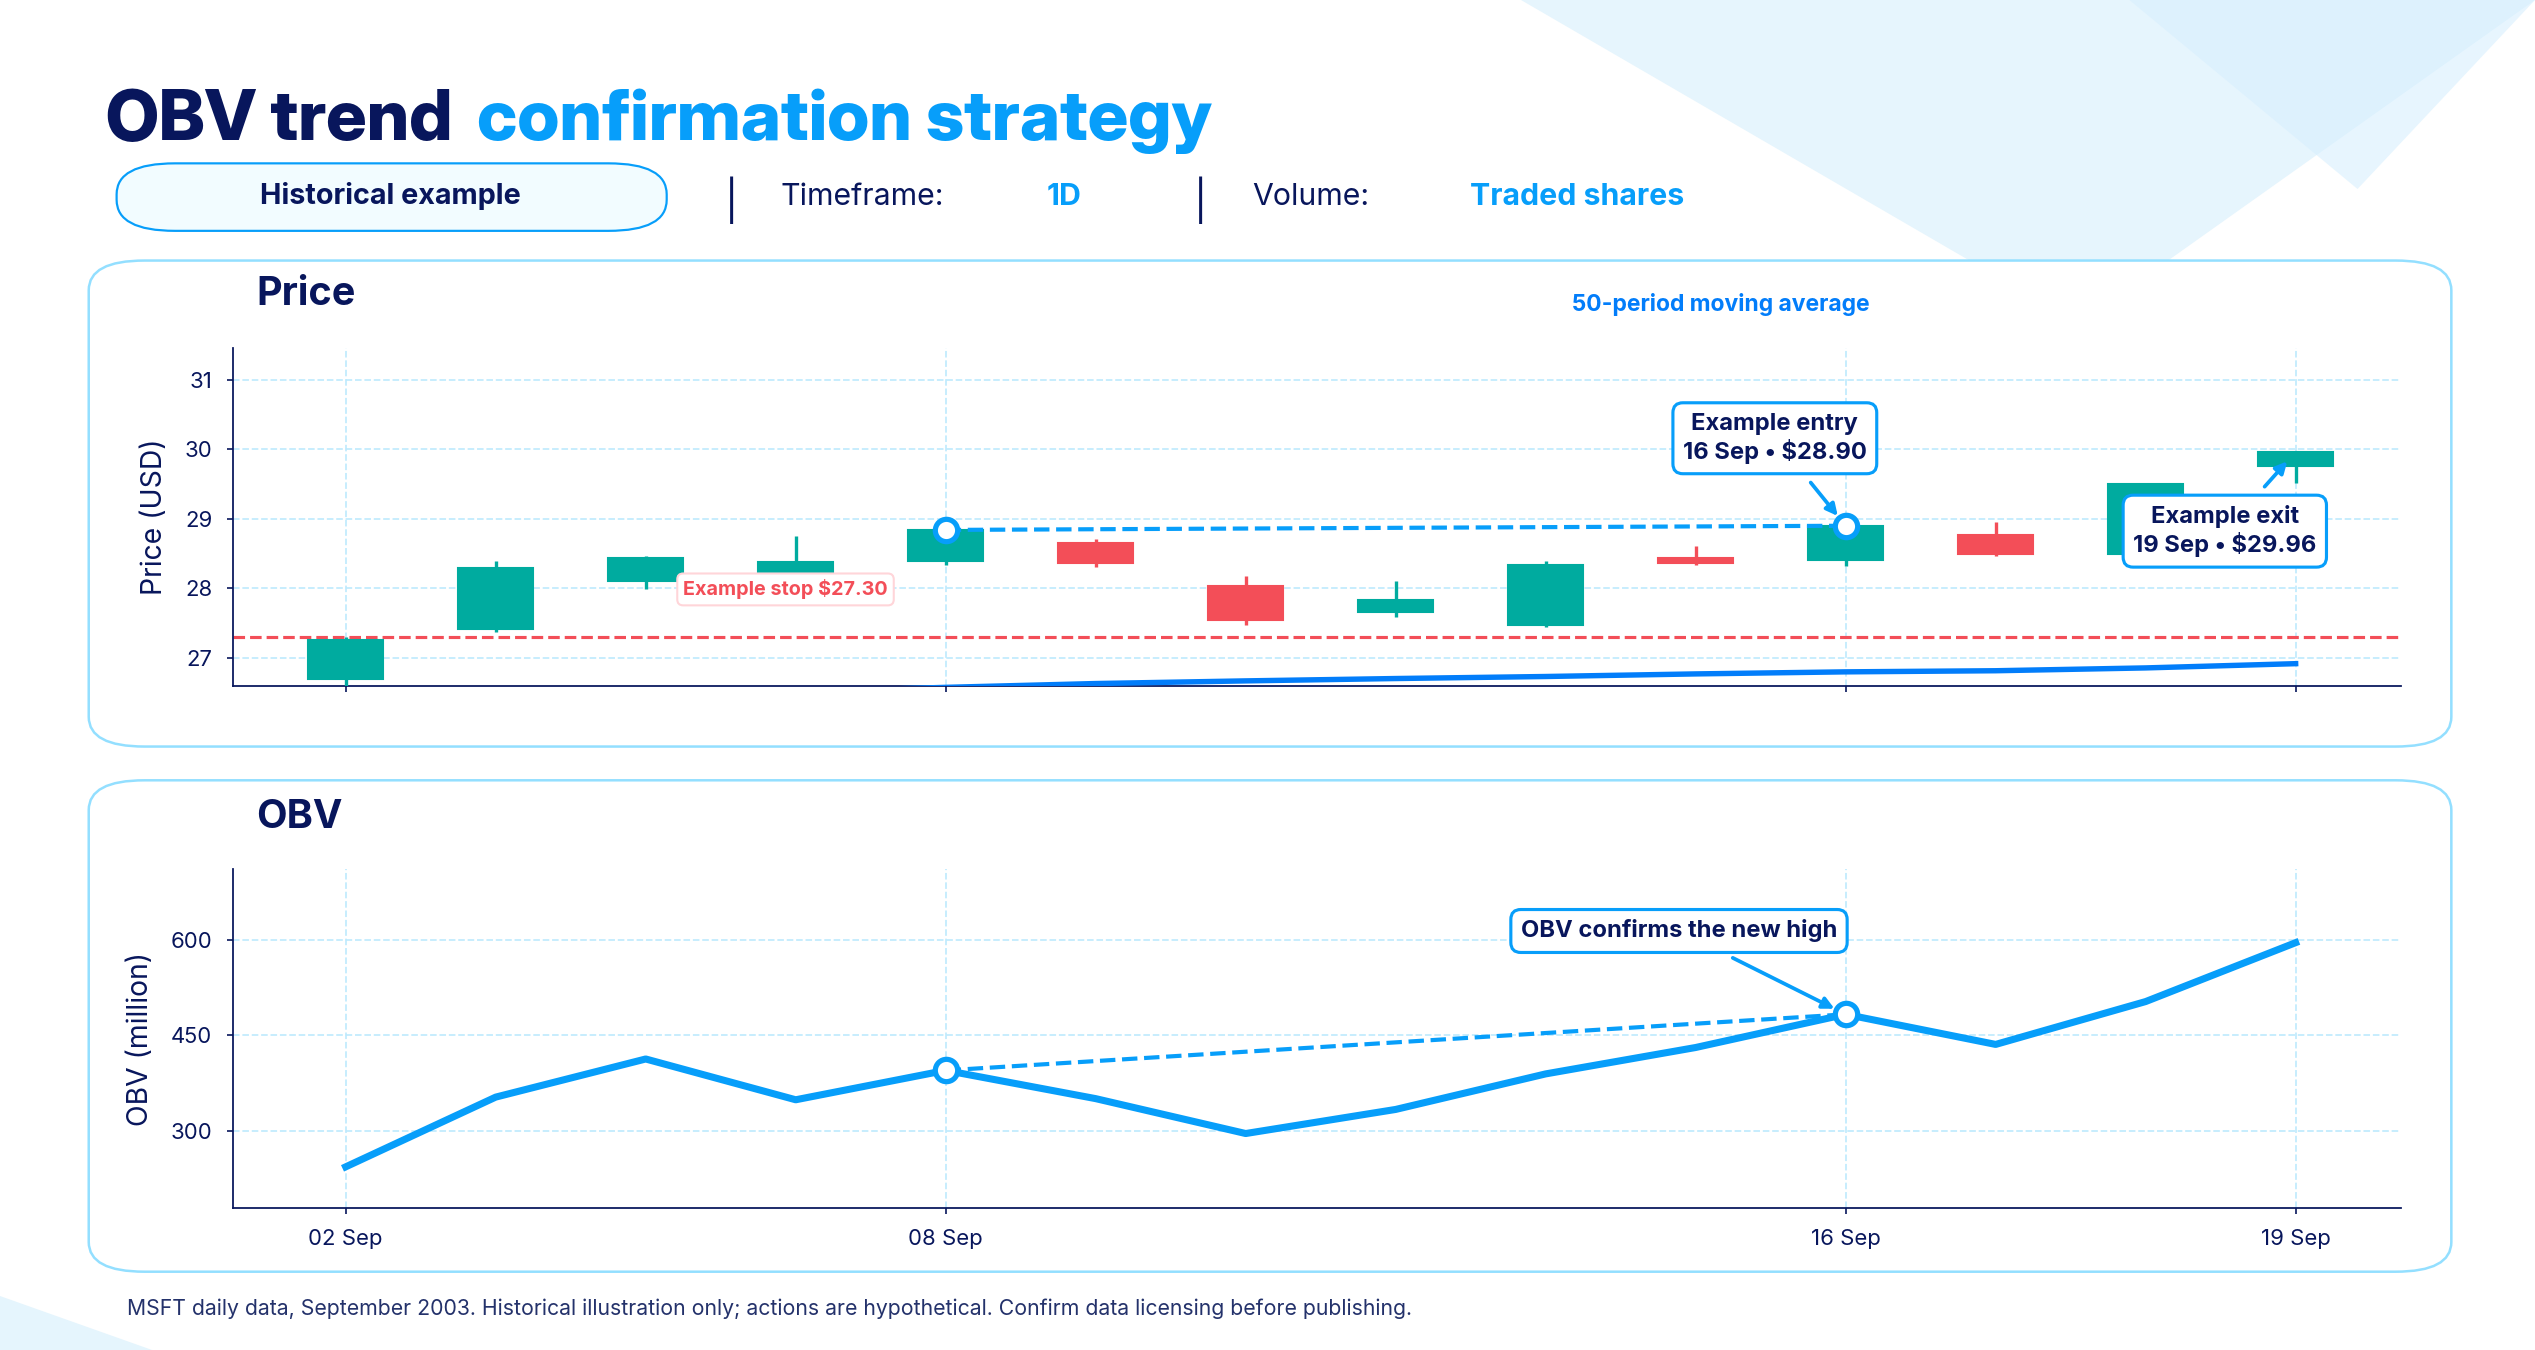
Walking through the setup. Price forms a higher low and then breaks above the prior swing high while trading above the chosen moving average. OBV forms a matching higher low and breaks above its own prior swing high at roughly the same time, confirming the price move.
If OBV fails to confirm, for example if price breaks higher but OBV stays flat or turns down, the setup does not trigger. That mismatch is treated as a signal the trend lacks volume support, and the trader waits for the next setup instead of forcing a trade.
How to Set Up and Use OBV in MT4 and MT5
This section covers the desktop versions of MT4 and MT5. Steps on the mobile or web versions of either platform can differ slightly from what is shown here. Traders who have not yet installed MT4 can start by accessing a dedicated MetaTrader 4 download and trading setup before adding OBV.
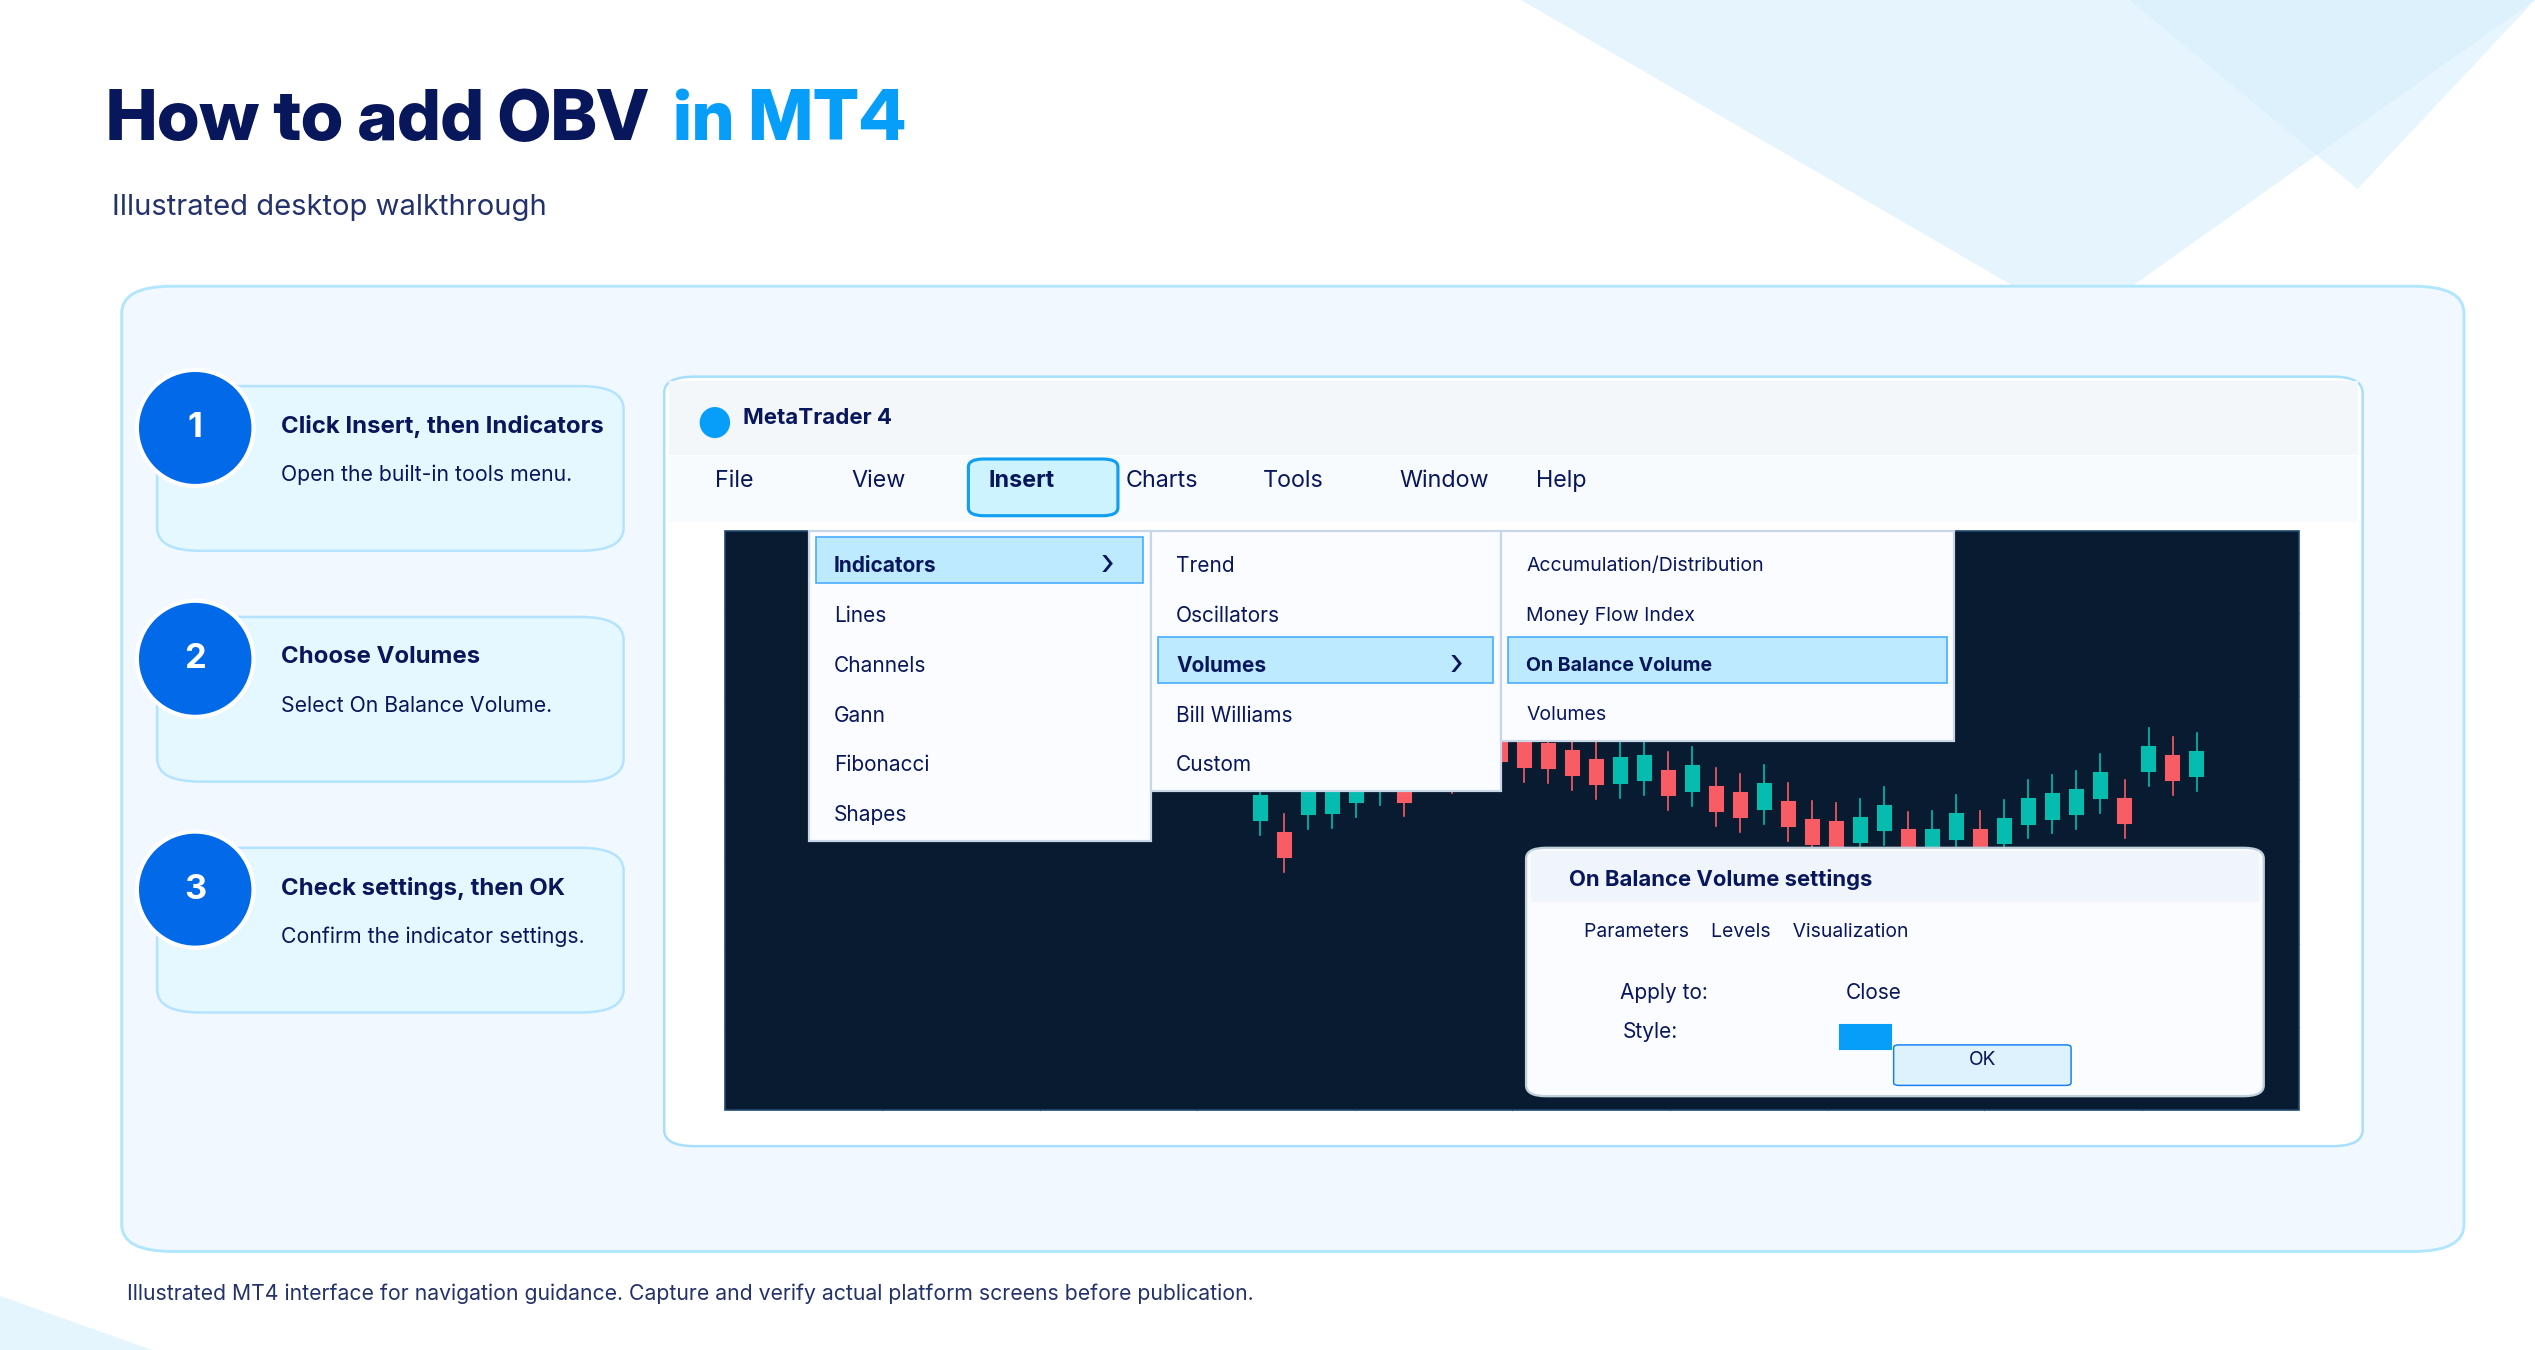
Setting up OBV in MT4. Open a chart for the instrument you want to analyze. Click Insert in the top menu, then Indicators, then Volumes, then On Balance Volume. The indicator opens in its own window below the price chart, where you can adjust its color, line style, and the volume type it uses before confirming.
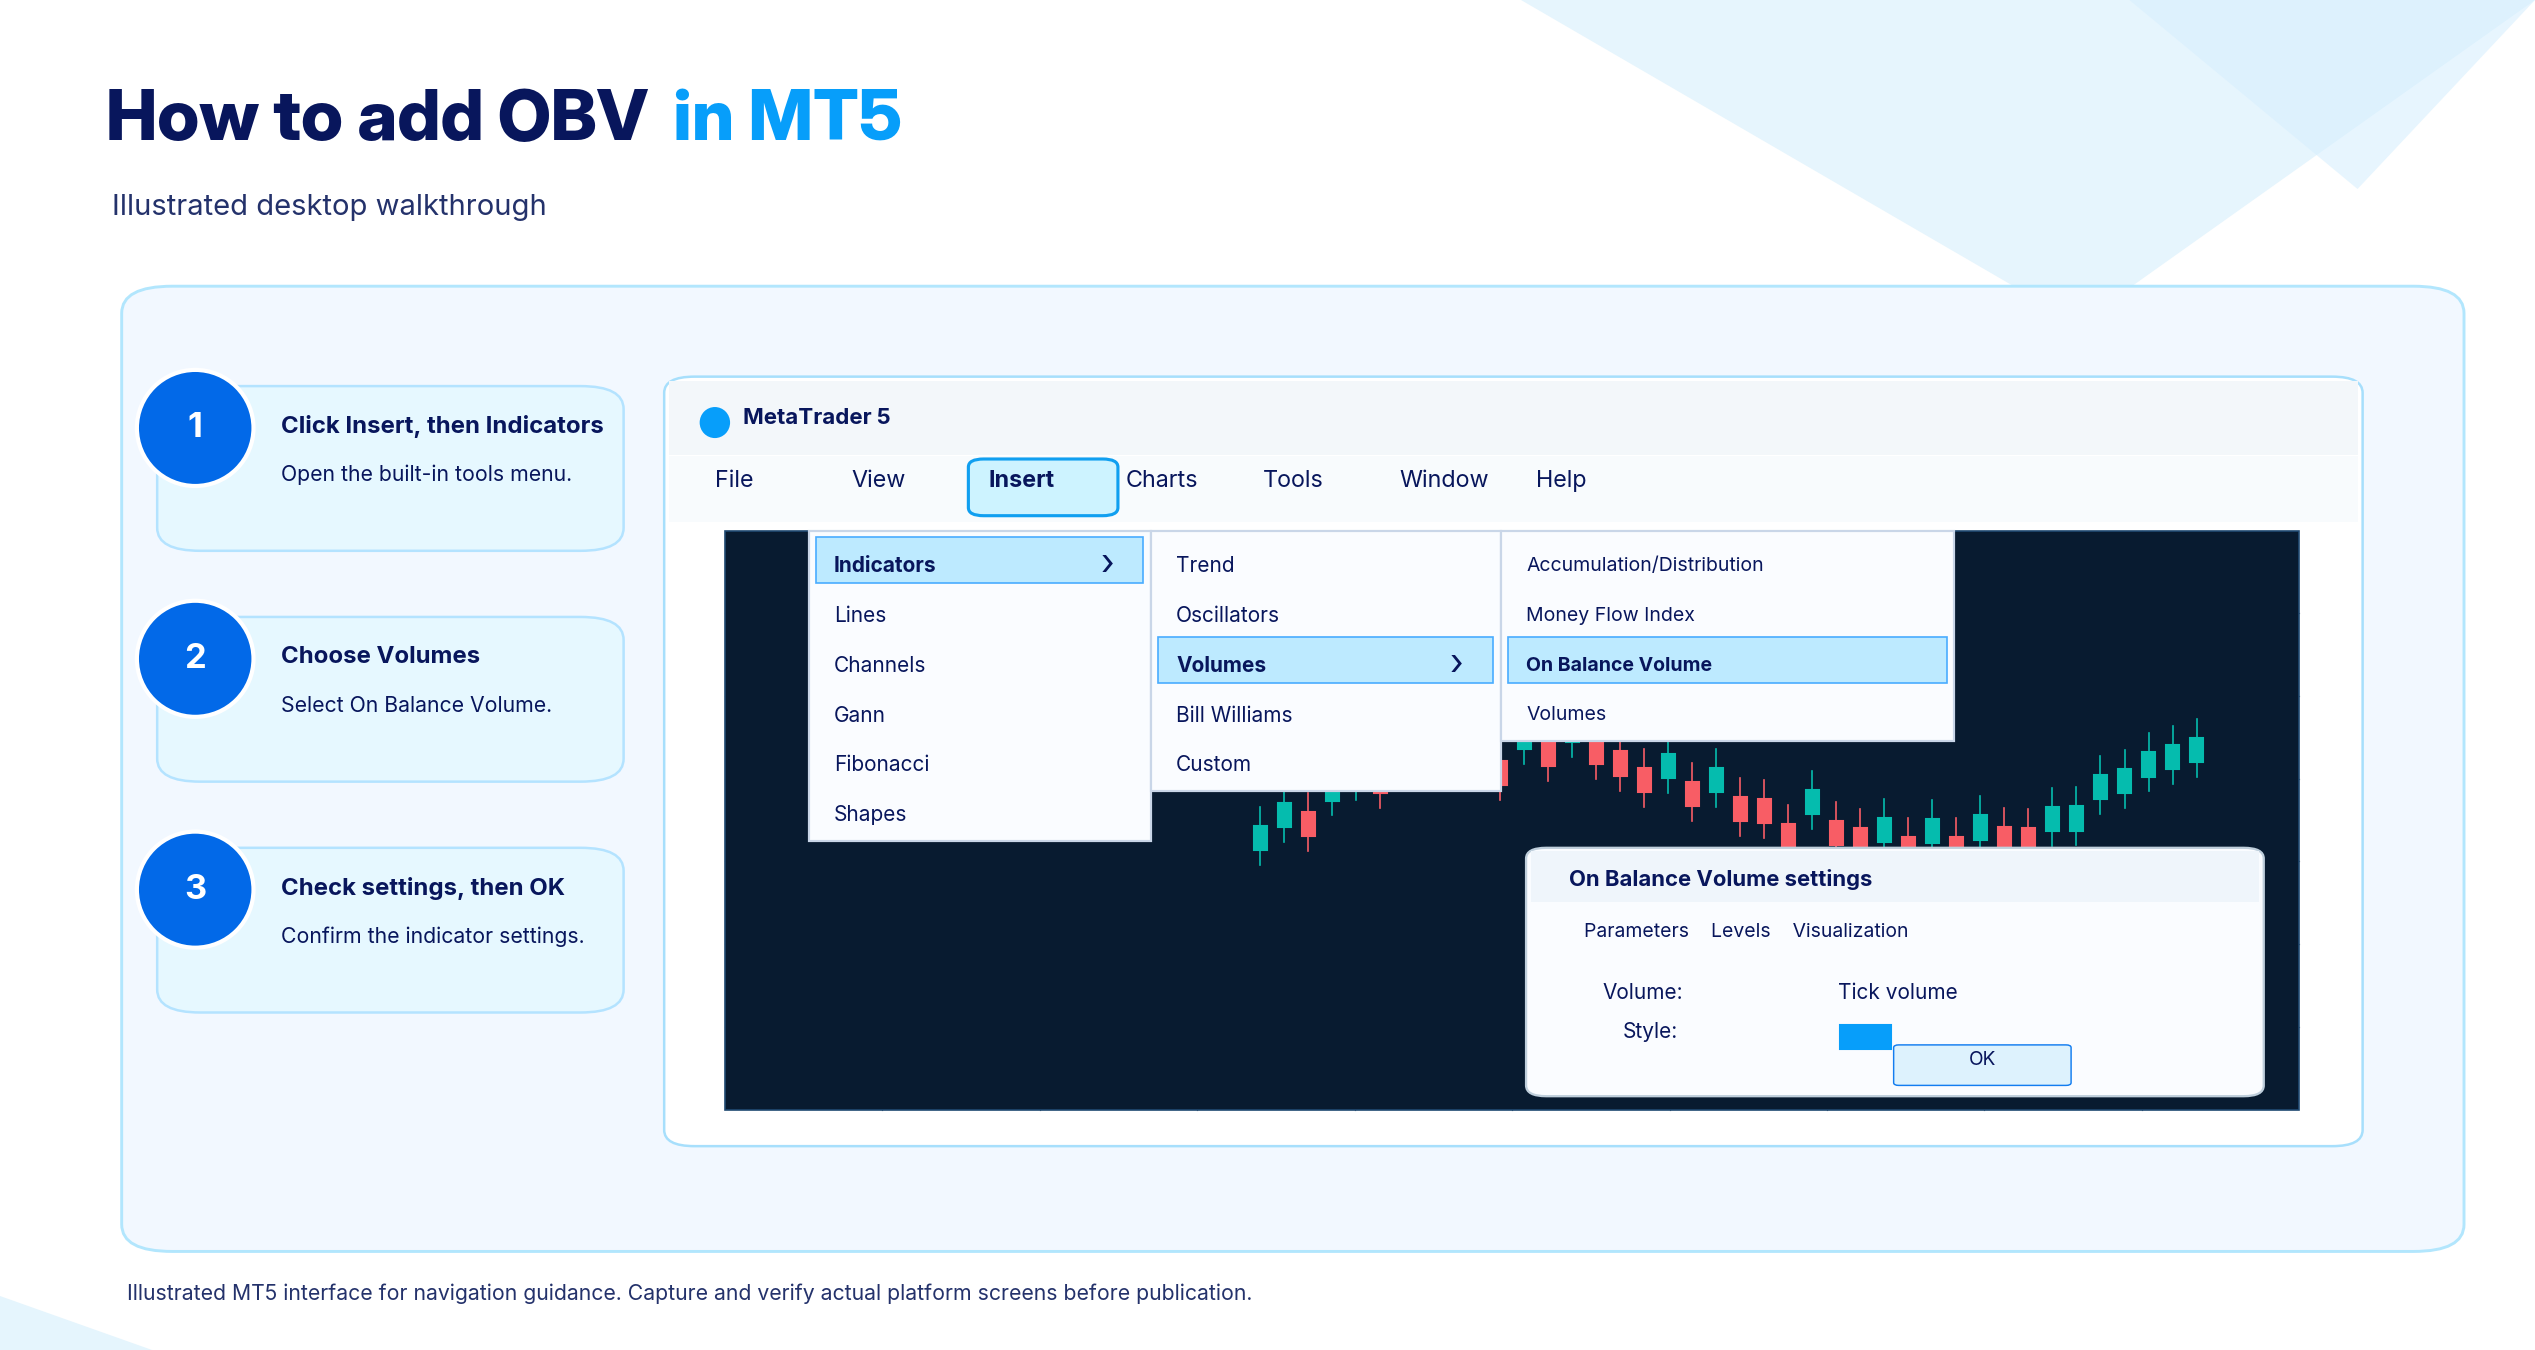
Setting up OBV in MT5. Open a chart for the instrument you want to analyze. Click Insert in the top menu, then Indicators, then Volumes, then On Balance Volume. MT5 also lets you add OBV by dragging it from the Navigator window onto the chart. Either method opens the same settings window, where you can adjust the applied volume type and the line's appearance before confirming.
How Can You Use OBV With Forex and Gold?
OBV works differently on forex and gold than it does on an exchange traded stock, because of how volume is recorded in each market.
What to Check About Tick Volume and Traded Volume
Tick volume counts the number of price changes in a period, not the number of units traded. Traded volume counts the actual number of contracts, shares, or lots that changed hands in that period.
Forex trades across a decentralized network of brokers and liquidity providers, so no single feed captures the full traded volume of the global market. Most forex charts, including those on MT4 and MT5, show tick volume as a stand in for traded volume.
Before using OBV on any chart, check which volume type it is built on. On MT4 and MT5, this shows in the indicator settings as the applied volume, which is usually tick volume for forex and may be tick volume or real volume for other instruments, depending on the broker's data feed.
Gold traded as a CFD or through a forex style broker typically shows the broker's own tick volume, not the volume from a centralized futures exchange. That difference matters because OBV calculated from one broker's tick volume will not exactly match OBV from another broker's feed on the same instrument, even though the shape of the line is usually similar. Treat OBV readings on forex and CFD gold as directionally useful, not as an exact measure of global trading volume.
On-Balance Volume vs Price Volume Trend vs Accumulation/Distribution
On balance volume and the Accumulation/Distribution Line both turn volume into a cumulative line, but they treat each period differently, so their readings often diverge. Traders also compare OBV with the money flow index and price volume trend because each combines price and volume in a different way.
Aspect | On Balance Volume (OBV) | Accumulation/Distribution Line (ADL) |
Calculation | Adds or subtracts the full period's volume based only on whether the close is higher, lower, or the same as the previous close | Adds or subtracts a portion of the period's volume based on where the close sits inside that period's high and low range |
Treatment of price | Uses only the direction between two closes, ignoring where price closed within the period | Uses the full high, low, and close range of each period, weighting volume by how close the close is to the high or low |
Treatment of volume | Full volume added or subtracted each period | A fraction of volume added or subtracted, scaled by the close's position in the range |
Interpretation | A rising or falling line, and divergence from price, read against price swings | Read the same general way, but the inputs behind the move differ from OBV |
Limitations | No weighting for the size of the price move or where the close sits in the period's range | Can still mismatch real buying or selling pressure when a period closes near the middle of its range despite a strong directional move |
Because the two formulas treat price differently, OBV and the Accumulation/Distribution Line can point in different directions on the same chart during the same period. Neither reading overrides the other. Comparing both gives a fuller picture of volume behavior than either indicator gives alone, and a disagreement between them is a reason to look more closely at price action rather than to trust one indicator over the other by default. The MFI uses price and volume to measure buying and selling pressure, while PVT scales volume by the size of the price change. It also tracks money flow, and some traders pair it with a volume-based average price benchmark such as VWAP for extra context. Tools like the Klinger Volume Oscillator focus more on comparing volume to price reversals than OBV does.
Frequently Asked Questions About OBV
Does OBV Predict Price?
OBV does not predict price. It is a lagging indicator, built from closing prices and volume that have already happened, so it confirms a move after price and volume data are in rather than forecasting the next move. Traders use a shift in OBV, such as a developing divergence, as an early warning worth watching, not as a signal that price will definitely follow.
Is a Higher OBV Always Better?
A higher OBV number is not automatically a bullish signal. The absolute OBV value depends entirely on where the calculation started counting, so two charts of the same instrument can show very different OBV numbers while telling the same story about direction. What matters is whether OBV is rising or falling, and how its swing points compare with price, not the size of the number itself.
Is OBV a Leading or Lagging Indicator?
OBV is a lagging indicator, because every value it produces is calculated from closing prices and volume that have already occurred. Some traders describe OBV as having leading qualities when a divergence between OBV and price develops before price visibly reacts to it. That describes a signal interpreted as potentially coming before a price move, not a property of the calculation itself, which always looks backward at data that already exists.
Does OBV Repaint?
OBV does not repaint historical readings once a period closes, because each prior value is locked in by the closing price and volume for that period. The value shown for the current, unfinished candle can still change as more volume comes in before that candle closes, which is normal behavior rather than repainting.
Separately, a broker correcting a data error, or a platform recalculating after a feed issue, can shift historical OBV values. Treat any specific repaint claim about one broker or platform as something to verify directly with that provider.
Can OBV Be Used for Crypto?
OBV can be used for crypto, but the reading only reflects the volume reported by the specific exchange or data feed behind the chart. Crypto trading is spread across many exchanges with no single consolidated volume figure, so OBV calculated from one exchange's data will not capture total market volume.
A large move on an exchange with thin volume can produce a misleading OBV reading compared with the same instrument on a higher volume exchange. Checking which exchange or feed a chart's volume comes from matters as much for crypto as it does for forex.