

Trading
Explora una amplia gama de mercados con precios competitivos, liquidez profunda y herramientas de trading avanzadas.
Más información 
Plataforma
Opera sin interrupciones con la potente plataforma de TMGM, diseñada para ofrecer velocidad, precisión y una experiencia de trading superior.
Más información Plataforma de trading
Herramientas de trading
Academia
Aprende los fundamentos del trading con recursos ideales para principiantes, incluidas guías, seminarios web y análisis del mercado.
Más información Academia TMGM
Noticias y análisis
Obtén actualizaciones del mercado en tiempo real y análisis de expertos para adelantarte a las oportunidades de trading
Más información Noticias y análisis
Acerca de
Descubre qué distingue a TMGM: nuestra presencia global, solidez regulatoria y compromiso con la innovación en el trading.
Más información Por qué elegir TMGM
Ripple Price Forecast: XRP gains momentum despite investors pulling capital
- XRP rises by more than 2% on Wednesday and trades above the key $1.00 level.
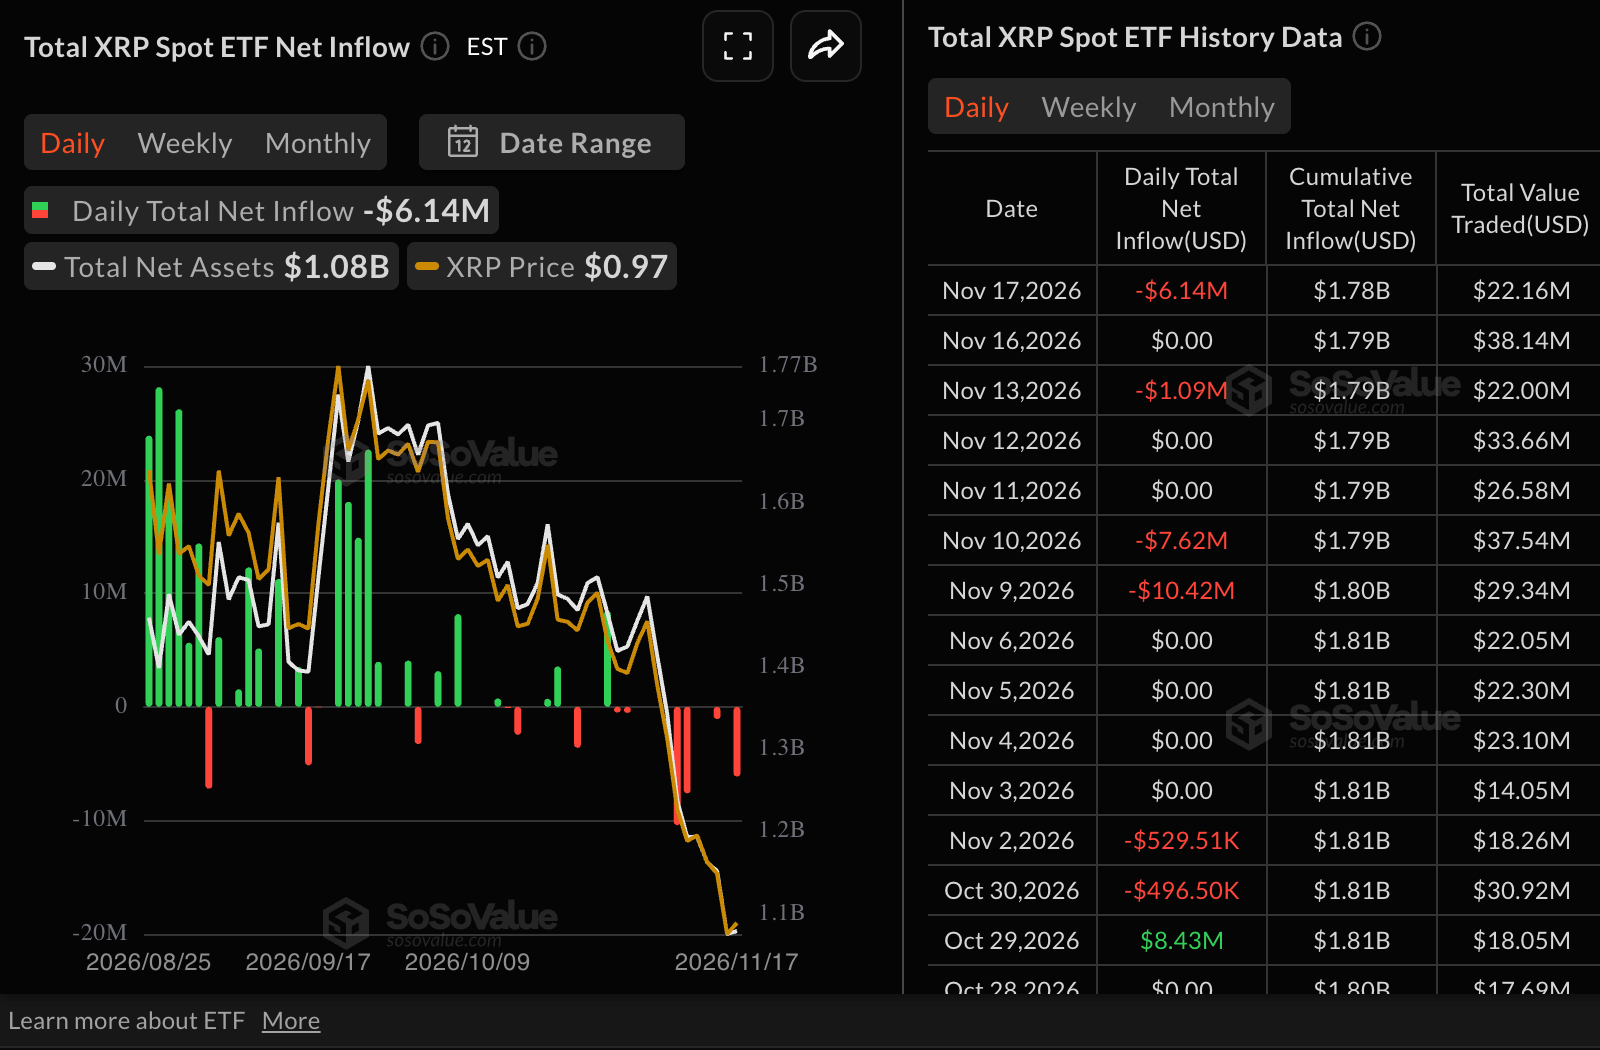
- US-listed XRP spot ETFs recorded $6 million in outflows on Tuesday, as institutional investors retreat.
- XRP bulls eye a sustained move above $1.00 as momentum indicators support a short-term recovery.
Ripple (XRP) rises near $1.00 on Wednesday, defying the broader crypto market’s bearish outlook. The remittance token is up over 2% on the day and against the backdrop of a sharp sell-off that tested lows last seen in November 2024 around $0.89.

A daily close above $1.00 could reinforce the path of least resistance on the upside, raising the odds of a sustained recovery toward the next key resistance at $1.20.
XRP ETF outflows mount as investor confidence fades
XRP spot Exchange-Traded Funds (ETFs) recorded roughly $6 million in outflows on Tuesday, following muted activity the day before and mild $1.1 million withdrawals last Friday. Despite the US-listed ETFs trading actively for one year, cumulative inflows stand at $1.78 billion, suggesting slow institutional uptake. Net assets under management stand at $1.08 billion, reinforcing subdued investor interest.
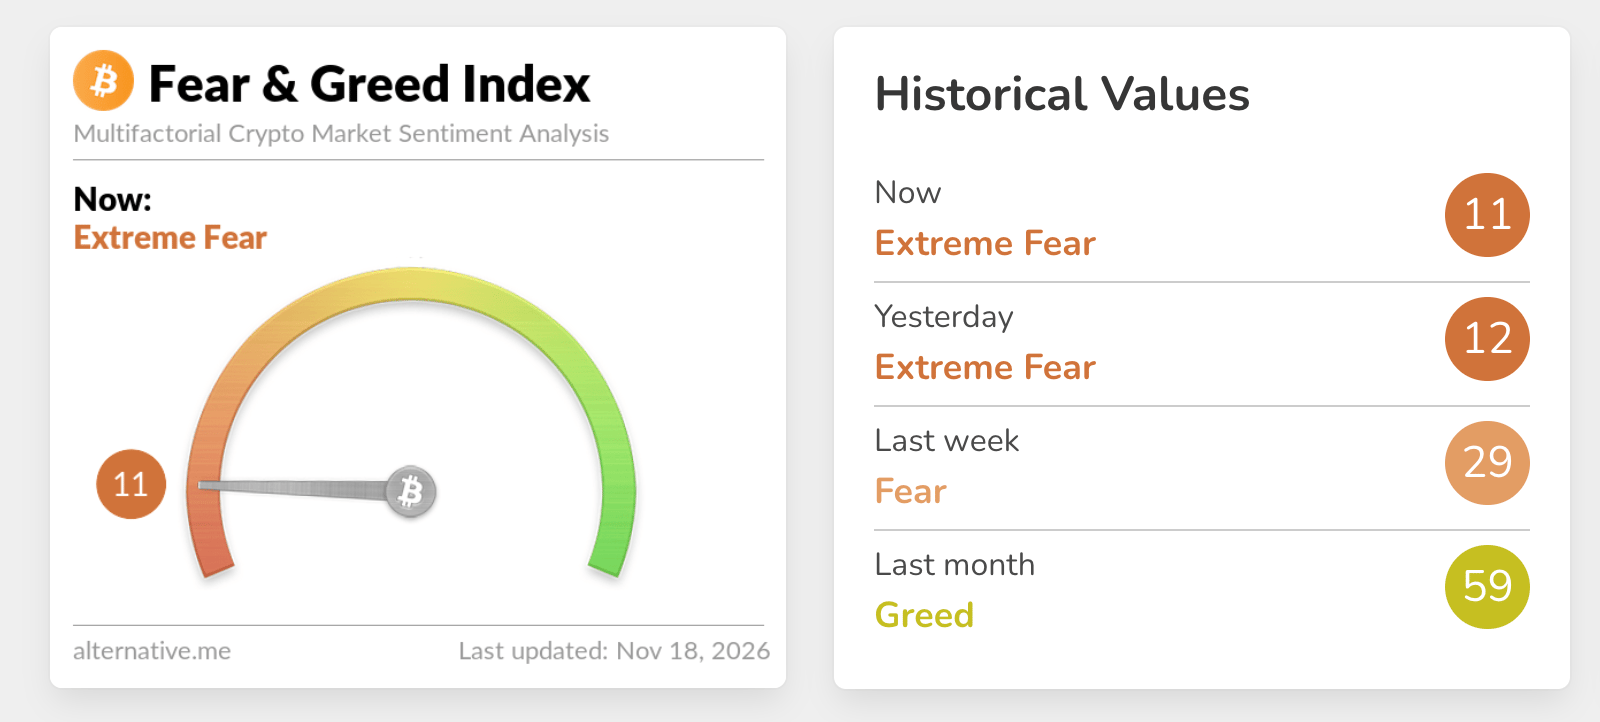
The Fear & Greed Index is down to 11 in the Extreme Fear territory, down only marginally from 12 the day in the same range the day before. This setup suggests appetite has significantly faded, weighing on demand for risk assets.
“Demand is shrinking fast. Total demand growth is contracting at its fastest pace since July 1, led by spot buyers,” CryptoQuant said in a recent report.
Technical analysis: XRP recovery gains momentum
XRP trades near $1.00 as the pair remains in a bearish near-term setup, holding well below the 50-day, 100-day, and 200-day Exponential Moving Averages (EMAs) at $1.21, $1.26, and $1.34, which collectively cap upside and underline a dominant downside bias.
The Parabolic SAR at $1.02 also sits above spot, reinforcing overhead pressure, while the Relative Strength Index (RSI) at 33 has bounced from oversold territory but still reflects weak demand. The Moving Average Convergence Divergence (MACD) remains negative, hinting that bearish momentum is easing only gradually.
Initial resistance lies at the Parabolic SAR barrier near $1.02, ahead of a more meaningful cluster of dynamic resistance at the 50-day EMA at $1.21, followed by the 100-day EMA at $1.26 and the longer-term 200-day EMA at $1.34. Unless buyers can reclaim and hold above these EMAs, the broader downtrend is likely to persist, with momentum gauges such as the RSI and MACD suggesting that any recovery attempts could struggle to sustain traction.
(The technical analysis of this story was written with the help of an AI tool. Know more.)
Bitcoin, altcoins, stablecoins FAQs
Bitcoin is the largest cryptocurrency by market capitalization, a virtual currency designed to serve as money. This form of payment cannot be controlled by any one person, group, or entity, which eliminates the need for third-party participation during financial transactions.
Altcoins are any cryptocurrency apart from Bitcoin, but some also regard Ethereum as a non-altcoin because it is from these two cryptocurrencies that forking happens. If this is true, then Litecoin is the first altcoin, forked from the Bitcoin protocol and, therefore, an “improved” version of it.
Stablecoins are cryptocurrencies designed to have a stable price, with their value backed by a reserve of the asset it represents. To achieve this, the value of any one stablecoin is pegged to a commodity or financial instrument, such as the US Dollar (USD), with its supply regulated by an algorithm or demand. The main goal of stablecoins is to provide an on/off-ramp for investors willing to trade and invest in cryptocurrencies. Stablecoins also allow investors to store value since cryptocurrencies, in general, are subject to volatility.
Bitcoin dominance is the ratio of Bitcoin's market capitalization to the total market capitalization of all cryptocurrencies combined. It provides a clear picture of Bitcoin’s interest among investors. A high BTC dominance typically happens before and during a bull run, in which investors resort to investing in relatively stable and high market capitalization cryptocurrency like Bitcoin. A drop in BTC dominance usually means that investors are moving their capital and/or profits to altcoins in a quest for higher returns, which usually triggers an explosion of altcoin rallies.
Artículos destacados
1Real brasileño: la política y las materias primas presionan al BRL - ING2Corona sueca: la trayectoria del Riksbank depende de la evolución de la divisa – BNY3El dólar australiano encuentra apoyo cerca de 0,6710 frente al dólar estadounidense, pero las perspectivas siguen deteriorándose4Florín húngaro: la postura acomodaticia del MNB presiona al HUF frente al euro – Commerzbank5Noticias y previsiones de la libra esterlina: la GBP amplía sus caídas ante la moderación de la inflación al consumidor en el Reino Unido6El franco suizo se desploma por la divergencia de las políticas monetarias, con las actas de la Fed en el punto de mira7Libra esterlina: el repunte de la inflación se considera contenido – MUFG8El oro se desploma a su nivel más bajo en más de un año ante las crecientes apuestas por una subida de tipos de la Fed9«Tres potentes factores de apoyo»: Société Générale explica el máximo de siete meses de la rupia india


¡Comience ahora!
Regístrese y acceda a los mercados globales en menos de 3 minutos

Conéctese con nosotros









Contactos
Teléfono: +61 2 8036 8388
Fax: +61 2 8036 8388
Correo electrónico: support@tmgm.com



La información proporcionada en este sitio web es únicamente de carácter general y no constituye asesoramiento financiero personal. Antes de actuar sobre cualquier información de este sitio web, debe considerar la idoneidad de la información en relación con sus objetivos, situación financiera y necesidades. Invertir en CFD y contratos de margen de FX conlleva riesgos significativos y no es adecuado para todos los inversores. Puede perder más que su depósito inicial. Usted no posee ni tiene ningún interés en el activo subyacente. Le recomendamos que busque asesoramiento independiente y se asegure de comprender plenamente los riesgos involucrados antes de operar. Es importante que lea y considere el documento de divulgación antes de adquirir cualquier producto listado en el sitio web. La información y los anuncios ofrecidos en este sitio web no están destinados al uso por parte de ninguna persona en ningún país o jurisdicción donde dicho uso sea contrario a las leyes y regulaciones locales. Los productos y servicios ofrecidos en este sitio web no están destinados a residentes de Estados Unidos, Malasia y Tailandia.
TMGM está autorizado y regulado en varias jurisdicciones.
Trademax Australia Limited, que opera como TMGM, está regulada por la Comisión Australiana de Valores e Inversiones (ASIC), AFSL n.º 436416, y está ubicada en Level 28, One International Tower, 100 Barangaroo Avenue, 2000 Sydney, NSW Australia.
Correo electrónico: support@tmgm.com.au
Trademax Global Limited, que opera como TMGM, está autorizada y regulada por la Comisión de Servicios Financieros de Vanuatu (VFSC), número de registro 40356, y está registrada en 1276, Kumul Highway, Port Vila, Vanuatu, República de Vanuatu.
Correo electrónico: support@tmgm.com
Trademax Global Markets (SE) Limited, que opera como TMGM, está autorizada y regulada por la Autoridad de Servicios Financieros (FSA) de Seychelles, con número de licencia SD224. La empresa está registrada en Office No 13, Providence Estate ABIS Centre, Mahe, Seychelles.
Correo electrónico: support@tmgm.com
Trademax Global Markets (International) Pty Ltd, que opera como TMGM, está autorizada y regulada por la Comisión de Servicios Financieros de Mauricio (FSC) con licencia n.º GB22201012, y está registrada en 33, Edith Cavell Street C/o IQ EQ Fund Services (Mauritius) Ltd Port Louis, 11324 Mauricio.
Correo electrónico: support@tmgm.com
Copyright © TMGM. Todos los derechos reservados