

Trading
Explora una amplia gama de mercados con precios competitivos, liquidez profunda y herramientas de trading avanzadas.
Más información 
Plataforma
Opera sin interrupciones con la potente plataforma de TMGM, diseñada para ofrecer velocidad, precisión y una experiencia de trading superior.
Más información Plataforma de trading
Herramientas de trading
Academia
Aprende los fundamentos del trading con recursos ideales para principiantes, incluidas guías, seminarios web y análisis del mercado.
Más información Academia TMGM
Noticias y análisis
Obtén actualizaciones del mercado en tiempo real y análisis de expertos para adelantarte a las oportunidades de trading
Más información Noticias y análisis
Acerca de
Descubre qué distingue a TMGM: nuestra presencia global, solidez regulatoria y compromiso con la innovación en el trading.
Más información Por qué elegir TMGM
Silver Price Forecast: XAG/USD struggles near two-month lows ahead of US CPI
- Silver struggles below $60 as traders await US inflation data due on Wednesday
- XAG/USD holds below the Bollinger Bands midline, reinforcing the bearish outlook.
- The ADX near 19 indicates limited trend strength, although the RSI and MACD continue to favour sellers.
Silver (XAG/USD) trades on the back foot on Tuesday, losing more than 1.5% as hawkish Federal Reserve (Fed) expectations and elevated US Treasury yields weigh on the non-yielding metal. However, a softer US Dollar (USD) helps contain losses ahead of Wednesday’s US Consumer Price Index (CPI) report. At the time of writing, XAG/USD trades around $59.25, near two-month lows.
The US Dollar Index (DXY), which tracks the Greenback against six major currencies, trades around 102.25, below Monday’s peak of 102.61, its highest since April 2025. A hotter-than-expected inflation reading could lift the US Dollar and Treasury yields and revive expectations of a rate hike at the Fed’s October 27-28 meeting, adding pressure on Silver.
Traders currently price in an 80% probability that rates will remain unchanged this month, according to the CME FedWatch Tool. In contrast, softer inflation could strengthen the case for a pause and offer the metal some relief, although elevated Oil prices keep inflation risks tilted to the upside and expectations of further Fed tightening alive. Higher borrowing costs increase the opportunity cost of holding non-yielding assets such as Silver.
Technical analysis
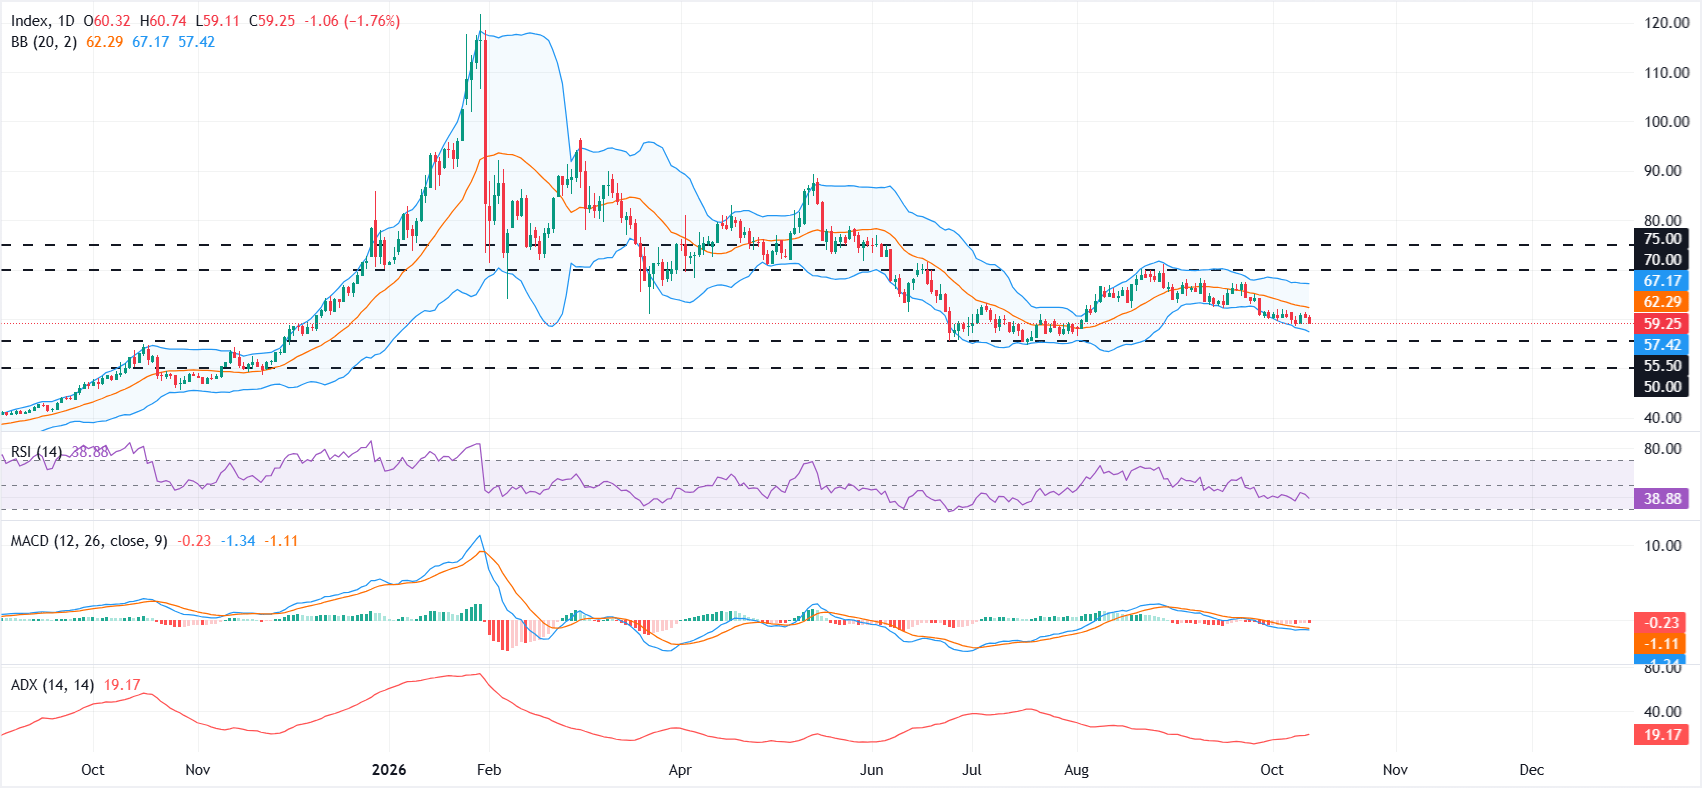
On the daily chart, XAG/USD remains under the Bollinger Bands Simple Moving Average (SMA) midline at $62.29, keeping the near-term tone bearish. Momentum backs this softer bias, with the Relative Strength Index (RSI) drifting toward the mid-30s and the Moving Average Convergence Divergence (MACD) histogram still negative, while the Average Directional Index near 19 suggests the downtrend is present but not strongly directional.
On the downside, immediate support sits at the Bollinger lower band near $57.42, ahead of the horizontal level at $55.50 and a deeper floor at $50.00. On the topside, initial resistance emerges at the Bollinger SMA midline around $62.29, followed by the upper band near $67.16, with more significant barriers at $70.00 and $75.00 that would need to be reclaimed to ease the current bearish pressure.
(The technical analysis of this story was written with the help of an AI tool. Know more.)
Silver FAQs
Silver is a precious metal highly traded among investors. It has been historically used as a store of value and a medium of exchange. Although less popular than Gold, traders may turn to Silver to diversify their investment portfolio, for its intrinsic value or as a potential hedge during high-inflation periods. Investors can buy physical Silver, in coins or in bars, or trade it through vehicles such as Exchange Traded Funds, which track its price on international markets.
Silver prices can move due to a wide range of factors. Geopolitical instability or fears of a deep recession can make Silver price escalate due to its safe-haven status, although to a lesser extent than Gold's. As a yieldless asset, Silver tends to rise with lower interest rates. Its moves also depend on how the US Dollar (USD) behaves as the asset is priced in dollars (XAG/USD). A strong Dollar tends to keep the price of Silver at bay, whereas a weaker Dollar is likely to propel prices up. Other factors such as investment demand, mining supply – Silver is much more abundant than Gold – and recycling rates can also affect prices.
Silver is widely used in industry, particularly in sectors such as electronics or solar energy, as it has one of the highest electric conductivity of all metals – more than Copper and Gold. A surge in demand can increase prices, while a decline tends to lower them. Dynamics in the US, Chinese and Indian economies can also contribute to price swings: for the US and particularly China, their big industrial sectors use Silver in various processes; in India, consumers’ demand for the precious metal for jewellery also plays a key role in setting prices.
Silver prices tend to follow Gold's moves. When Gold prices rise, Silver typically follows suit, as their status as safe-haven assets is similar. The Gold/Silver ratio, which shows the number of ounces of Silver needed to equal the value of one ounce of Gold, may help to determine the relative valuation between both metals. Some investors may consider a high ratio as an indicator that Silver is undervalued, or Gold is overvalued. On the contrary, a low ratio might suggest that Gold is undervalued relative to Silver.
Artículos destacados
1US Dollar: Fed pricing leg looks stretched – Societe Generale2Swiss Franc strengthens on dovish Fed's rhetoric, US CPI looms3Euro: Soft undertone but fair value higher against US Dollar – Scotiabank4Fed’s Barkin says persistent inflation warrants policy action5Fed’s Williams sees one final 2026 rate hike, none in 20276EUR/USD Price Forecast: RSI signals stretched selling pressure7HYPE falls to $80 as ETF outflows and flat volume weigh on Hyperliquid8Forex Today: US inflation comes to the fore9Gold slides on US yields surge ahead of CPI
COTIZACIONES EN VIVO

TODO SOBRE FOREX
Margin Call Meaning: What It Is, What Triggers It and How to Avoid One
Top 15 Weakest Currencies in the World
Top 15 Strongest Currencies in the World
Is Forex Trading Halal?
Best Time to Trade Forex
Forex Trading vs Futures Trading
Forex Trading vs Stock Trading
Forex Trading vs Crypto Trading
Is Forex Trading Profitable In 2026?
¡Comience ahora!
Regístrese y acceda a los mercados globales en menos de 3 minutos

Conéctese con nosotros









Contactos
Teléfono: +61 2 8036 8388
Fax: +61 2 8036 8388
Correo electrónico: support@tmgm.com



La información proporcionada en este sitio web es únicamente de carácter general y no constituye asesoramiento financiero personal. Antes de actuar sobre cualquier información de este sitio web, debe considerar la idoneidad de la información en relación con sus objetivos, situación financiera y necesidades. Invertir en CFD y contratos de margen de FX conlleva riesgos significativos y no es adecuado para todos los inversores. Puede perder más que su depósito inicial. Usted no posee ni tiene ningún interés en el activo subyacente. Le recomendamos que busque asesoramiento independiente y se asegure de comprender plenamente los riesgos involucrados antes de operar. Es importante que lea y considere el documento de divulgación antes de adquirir cualquier producto listado en el sitio web. La información y los anuncios ofrecidos en este sitio web no están destinados al uso por parte de ninguna persona en ningún país o jurisdicción donde dicho uso sea contrario a las leyes y regulaciones locales. Los productos y servicios ofrecidos en este sitio web no están destinados a residentes de Estados Unidos, Malasia y Tailandia.
TMGM está autorizado y regulado en varias jurisdicciones.
Trademax Australia Limited, que opera como TMGM, está regulada por la Comisión Australiana de Valores e Inversiones (ASIC), AFSL n.º 436416, y está ubicada en Level 28, One International Tower, 100 Barangaroo Avenue, 2000 Sydney, NSW Australia.
Correo electrónico: support@tmgm.com.au
Trademax Global Limited, que opera como TMGM, está autorizada y regulada por la Comisión de Servicios Financieros de Vanuatu (VFSC), número de registro 40356, y está registrada en 1276, Kumul Highway, Port Vila, Vanuatu, República de Vanuatu.
Correo electrónico: support@tmgm.com
Trademax Global Markets (SE) Limited, que opera como TMGM, está autorizada y regulada por la Autoridad de Servicios Financieros (FSA) de Seychelles, con número de licencia SD224. La empresa está registrada en Office No 13, Providence Estate ABIS Centre, Mahe, Seychelles.
Correo electrónico: support@tmgm.com
Trademax Global Markets (International) Pty Ltd, que opera como TMGM, está autorizada y regulada por la Comisión de Servicios Financieros de Mauricio (FSC) con licencia n.º GB22201012, y está registrada en 33, Edith Cavell Street C/o IQ EQ Fund Services (Mauritius) Ltd Port Louis, 11324 Mauricio.
Correo electrónico: support@tmgm.com
Copyright © TMGM. Todos los derechos reservados