

Trading
Esplora una vasta gamma di mercati con prezzi competitivi, elevata liquidità e strumenti di trading avanzati.
Scopri di più 
Piattaforma
Fai trading senza problemi con la potente piattaforma di TMGM, fatta apposta per essere veloce, precisa e per darti un'esperienza di trading fantastica.
Scopri di più Piattaforma di trading
Strumenti di trading
Academy
Impara le basi del trading con le risorse per principianti, tra cui guide, webinar e approfondimenti sul mercato.
Scopri di più Notizie e analisi
Ricevi aggiornamenti sul mercato in tempo reale e analisi di esperti per cogliere le opportunità di trading
Scopri di più Notizie e analisi
Chi siamo
Scopri cosa rende TMGM speciale: la nostra presenza globale, la nostra forza normativa e il nostro impegno per l'innovazione nel trading.
Scopri di più Perché scegliere TMGM
Sponsorizzazioni
Quant Price Forecast: QNT rallies 350% in a week on major tokenization deal
- Quant is down nearly 10% on Monday, showing signs of mild easing after rallying nearly 350% last week.
- Quant partnered with The Clearing House on Thursday, emerging as a settlement layer for tokenized deposits across 25 major US banks.
- The technical outlook for QNT is bullish, with the price trading around a 4-year high amid strong bullish momentum.
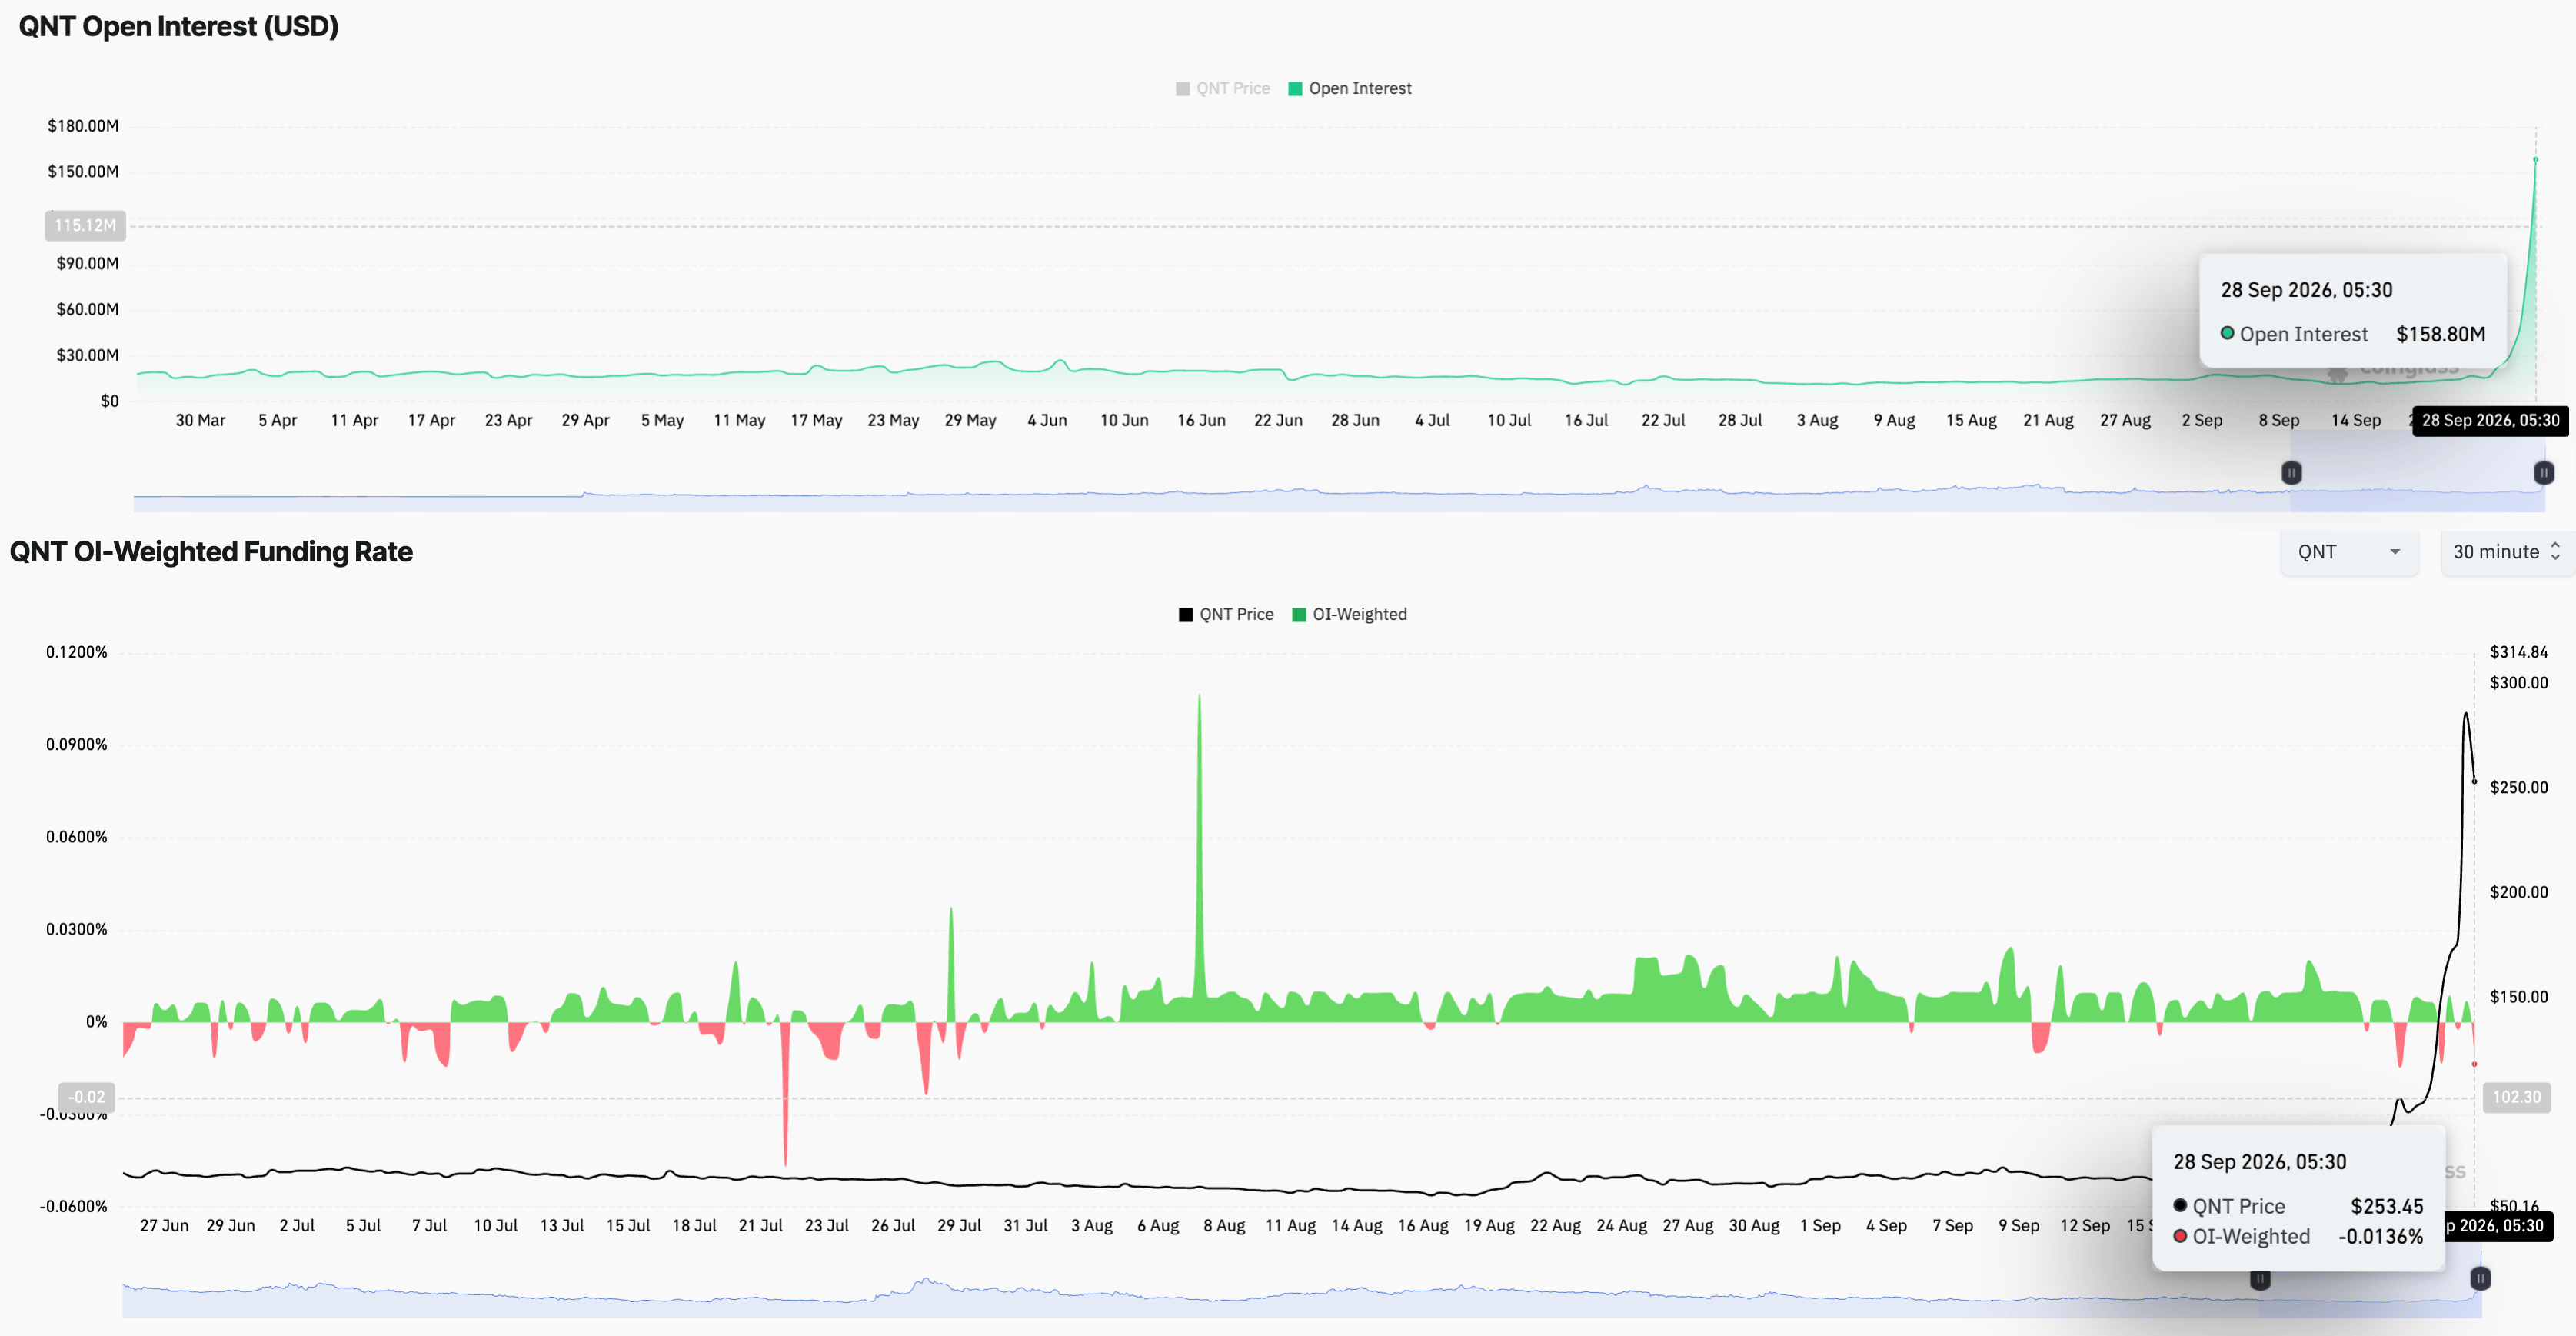
Quant (QNT) price hovers above $250 on Monday following a parabolic rise of nearly 350% last week. The Clearing House deal positions Quant as a settlement layer across 25 major banks for tokenized deposits amid the US government's strong push for tokenized stocks and other Real-World Assets (RWAs). Retail speculation builds toward QNT, with its futures Open Interest rising to a record high of $158.80 million, indicating firm leverage-exposed participation.

Bullish speculation grows firm on tokenized deposits deal
Quant rallied nearly 350% last week, gaining strong retail demand on the announcement of a partnership with The Clearing House. The deal enables Quant to serve as the transaction layer for clearing and settling tokenized deposits across 25 major US banks, as previously reported by FXStreet.
On the retail side, the QNT futures Open Interest (OI) surged to $158.80 million, suggesting a sharp increase in leverage-driven positional buildup. At the same time, the funding rate fluctuates, flipping to -0.0136%, suggesting a mild bearish incline among traders as the rally stretches thin.
Technical outlook: QNT rally steadies above $250 as bulls eye a fresh record high
Quant trades around $254 at press time on Monday, holding steady after a parabolic rise last week. QNT sits well above the major 50-, 100-, and 200-week Exponential Moving Averages (EMAs) at $87.78, $88.89 and $102.44, respectively, providing a broad underlying support zone.
The 50-week EMA crosses above the 200-week EMA, which is commonly referred to as a Golden Cross pattern, suggesting a long-term bullish trend reversal. Momentum on the week chart hits record high levels, with the Relative Strength Index (RSI) at 80, deep into the overbought territory. At the same time, the Moving Average Convergence Divergence (MACD) and signal line extend an uptrend to 26.22 and 20.85, with expanding bullish histograms, suggesting a firm control of buyers on the trend.
The Fibonacci retracement over last week's price range from $64.16 to $373.00 highlights the immediate support level at the 78.6% Fibonacci retracement level at $255, followed by the October 17, 2022 and December 2, 2024 highs around $228 and $171.70, respectively.
Looking up, QNT must surpass last week's high at $373 to test its record high of $430 set by the September 6, 2021 high. A confirmed breakout above this level could target the 127.2% Fibonacci extension level at $602.05.
(The technical analysis of this story was written with the help of an AI tool. Know more.)
ARTICOLI POPOLARI
1USD/CAD Price Forecast: Holds gains above 1.4150, while technicals flag overbought risk2Indonesian Rupiah: Rate support erodes as outflows resume – MUFG3Forex Today: Gold slumps below $4,200 on hawkish Fed outlook, Mideast tensions4Silver Price Forecast: XAG/USD falls like house of cards on Fed’s hawkish narrative5Euro: Rate uncertainty and energy costs weigh – HSBC6Japanese Yen nudges lower despite a hawkish BoJ, intervention warnings7Solana Price Forecast: Bulls hold control as ETF inflows strengthen and RWAs, stablecoin metrics hit records8USD/JPY: Weekly review highlights Dollar strength – MUFG9India rates: Spreads seen narrowing further – DBS
QUOTAZIONI IN DIRETTA


TUTTO SU TECHNICAL
Cambiamento di Carattere (CHoCH): Definizione, Esempi e Strategia
Che cos'è il pattern Dark Cloud Cover e come si opera con esso?
Che cos'è il pattern candlestick Piercing Line e come si fa trading con esso?
Cosa sono i pattern di candele Tweezer Top e Tweezer Bottom?
Pattern a candela Inside Bar: cos'è, come identificarlo e come tradarlo
Pattern a candela Hanging Man: come identificarlo e negoziarlo
VWMA vs VWAP: differenze chiave, formule e quale utilizzare
Che cos'è il Prezzo Medio Ponderato per il Volume (VWAP)? Formula, impostazioni e strategie
Media mobile ponderata per il volume (VWMA): formula, segnali e strategia
Inizia ora!
Registrati e accedi ai mercati globali in meno di 3 minuti

Contattaci









Contatti
Telefono: +61 2 8036 8388
Fax: +61 2 8036 8388
Email: support@tmgm.com



Le informazioni fornite su questo sito web hanno esclusivamente carattere generale e non costituiscono consulenza finanziaria personalizzata. Prima di agire sulla base di qualsiasi informazione presente su questo sito web, dovresti valutarne l'adeguatezza in relazione ai tuoi obiettivi, alla tua situazione finanziaria e alle tue esigenze. Investire in CFD e contratti FX con margine comporta rischi significativi e non è adatto a tutti gli investitori. Potresti perdere più del tuo deposito iniziale. Non possiedi, né hai, alcun interesse nell'attività sottostante. Ti raccomandiamo di richiedere una consulenza indipendente e di assicurarti di comprendere pienamente i rischi connessi prima di fare trading. È importante leggere e valutare il documento informativo prima di acquisire qualsiasi prodotto elencato sul sito web. Le informazioni e le pubblicità offerte su questo sito web non sono destinate all'uso da parte di persone in paesi o giurisdizioni in cui tale utilizzo sarebbe contrario alle leggi e ai regolamenti locali. I Prodotti e Servizi offerti su questo sito web non sono destinati ai residenti degli Stati Uniti, della Malesia e della Thailandia.
TMGM è autorizzata e regolamentata in diverse giurisdizioni.
Trademax Australia Limited, operante come TMGM, è regolamentata dalla Australian Securities and Investments Commission (ASIC), AFSL n. 436416 e si trova a Level 28, One International Tower, 100 Barangaroo Avenue, 2000 Sydney, NSW Australia.
Email: support@tmgm.com.au
Trademax Global Limited, operante come TMGM, è autorizzata e regolamentata dalla Vanuatu Financial Services Commission (VFSC), numero di registrazione 40356 e registrata a 1276, Kumul Highway, Port Vila, Vanuatu, Repubblica di Vanuatu.
Email: support@tmgm.com
Trademax Global Markets (SE) Limited, operante con il nome TMGM, è autorizzata e regolamentata dalla Financial Services Authority (FSA) delle Seychelles, con numero di licenza SD224. La società è registrata presso l’Ufficio n. 13, Providence Estate ABIS Centre, Mahé, Seychelles.
Email: support@tmgm.com
Trademax Global Markets (International) Pty Ltd, operante come TMGM, è autorizzata e regolamentata dalla Financial Services Commission, Mauritius (FSC) con licenza n. GB22201012, e registrata al 33, Edith Cavell Street C/o IQ EQ Fund Services (Mauritius) Ltd Port Louis, 11324 Mauritius.
Email: support@tmgm.com
Copyright © TMGM. Tutti i diritti riservati