


Dow Jones Industrial Average gives back Friday's rally on a Boeing delay
- DJIA gives back most of Friday's rally to close just under 51,500 on a Boeing delay.
- Boeing at its lowest of 2026 after the FAA holds up the 737 Max 10.
- Core PCE forecast to rise to 3.4% YoY on Wednesday.
A software bug at Boeing (BA) cost the Dow Jones Industrial Average more points than a record $150 billion buyback at Nvidia (NVDA) put back. The index closed just under 51,500, handing back about two-thirds of Friday's rally. Treasury yields climbed again, and the week's inflation and jobs numbers decide whether the Federal Reserve (Fed) follows them in October.

The FAA's fix for one 737 bug came with another
The Federal Aviation Administration (FAA) said on Monday it won't certify the 737 Max 10 until it has assessed a newly flagged software issue, and Boeing closed nearly 7% lower at its weakest level of 2026. Boeing had expected approval within weeks. FAA Administrator Bedford said the agency certified the smaller Max 7 in August on a software version that fixed one known bug and introduced a new one. US airlines said they have gone back to older software where needed, so the delay lands on new deliveries rather than on planes already flying.
The Dow weights its 30 members by share price rather than company size, so a dollar lost on any member moves the index by the same number of points. Boeing lost more than $12 a share. Nvidia rose 1.7% on the buyback and gained less than $4, which means the planemaker's slide outweighed the chipmaker's gain in index points by better than three to one. At Monday's price, Nvidia's new $150 billion authorization is roughly Boeing's entire market value.
The index still fell by less than the S&P 500 and the Nasdaq Composite, because the heaviest AI losses sat mostly outside it. Meta Platforms (META) fell 4.8% and isn't a member, while Microsoft (MSFT) and Amazon (AMZN), which are, slipped about 1%. The software itself came from GE Aerospace (GE), which isn't a member either.
A 70% hike with three reports still to come
The 10-year Treasury yield rose above 5.2% and the 30-year to about 5.5%, near their highest since 2007 and 2004. The two-year yield, the one most tied to Fed expectations, rose about 0.17 of a point in the week to September 25. The Fed raised its rate to 3.75%-4.00% on September 16, its first increase since 2023, and futures put the chance of another quarter-point on October 28 near 70%. A government bond paying more than 5% for a decade competes directly for the money that owns Dow members valued on profits several years out. Counting the day of the hike, the index has fallen in six of the nine sessions since.
Tuesday brings August job openings at 14:00 GMT, forecast at 7.23 million from 7.271 million, and six scheduled Fed speeches, the first of 14 on the calendar before Friday. Wednesday carries the August Personal Consumption Expenditures Price Index (PCE) at 12:30 GMT, the inflation measure the Fed prefers, with the core reading forecast at 0.3% MoM and 3.4% YoY, up from 3.3%. A core reading at or above forecast would keep October's odds where they are and give the 10-year yield no reason to fall.
Thursday's Institute for Supply Management (ISM) manufacturing Purchasing Managers Index (PMI) at 14:00 GMT is forecast at 54.9. Friday's September Nonfarm Payrolls (NFP) report at 12:30 GMT is forecast to show 84K jobs against 162K in August, with unemployment steady at 4.1% and hourly earnings up 0.3% MoM. A weak jobs count with steady pay could pull yields lower on the headline and leave the October case standing on wages. The first revision to Friday's count arrives with the October report in November, after the Fed has voted on the number it replaces.
The map into Wednesday's inflation number
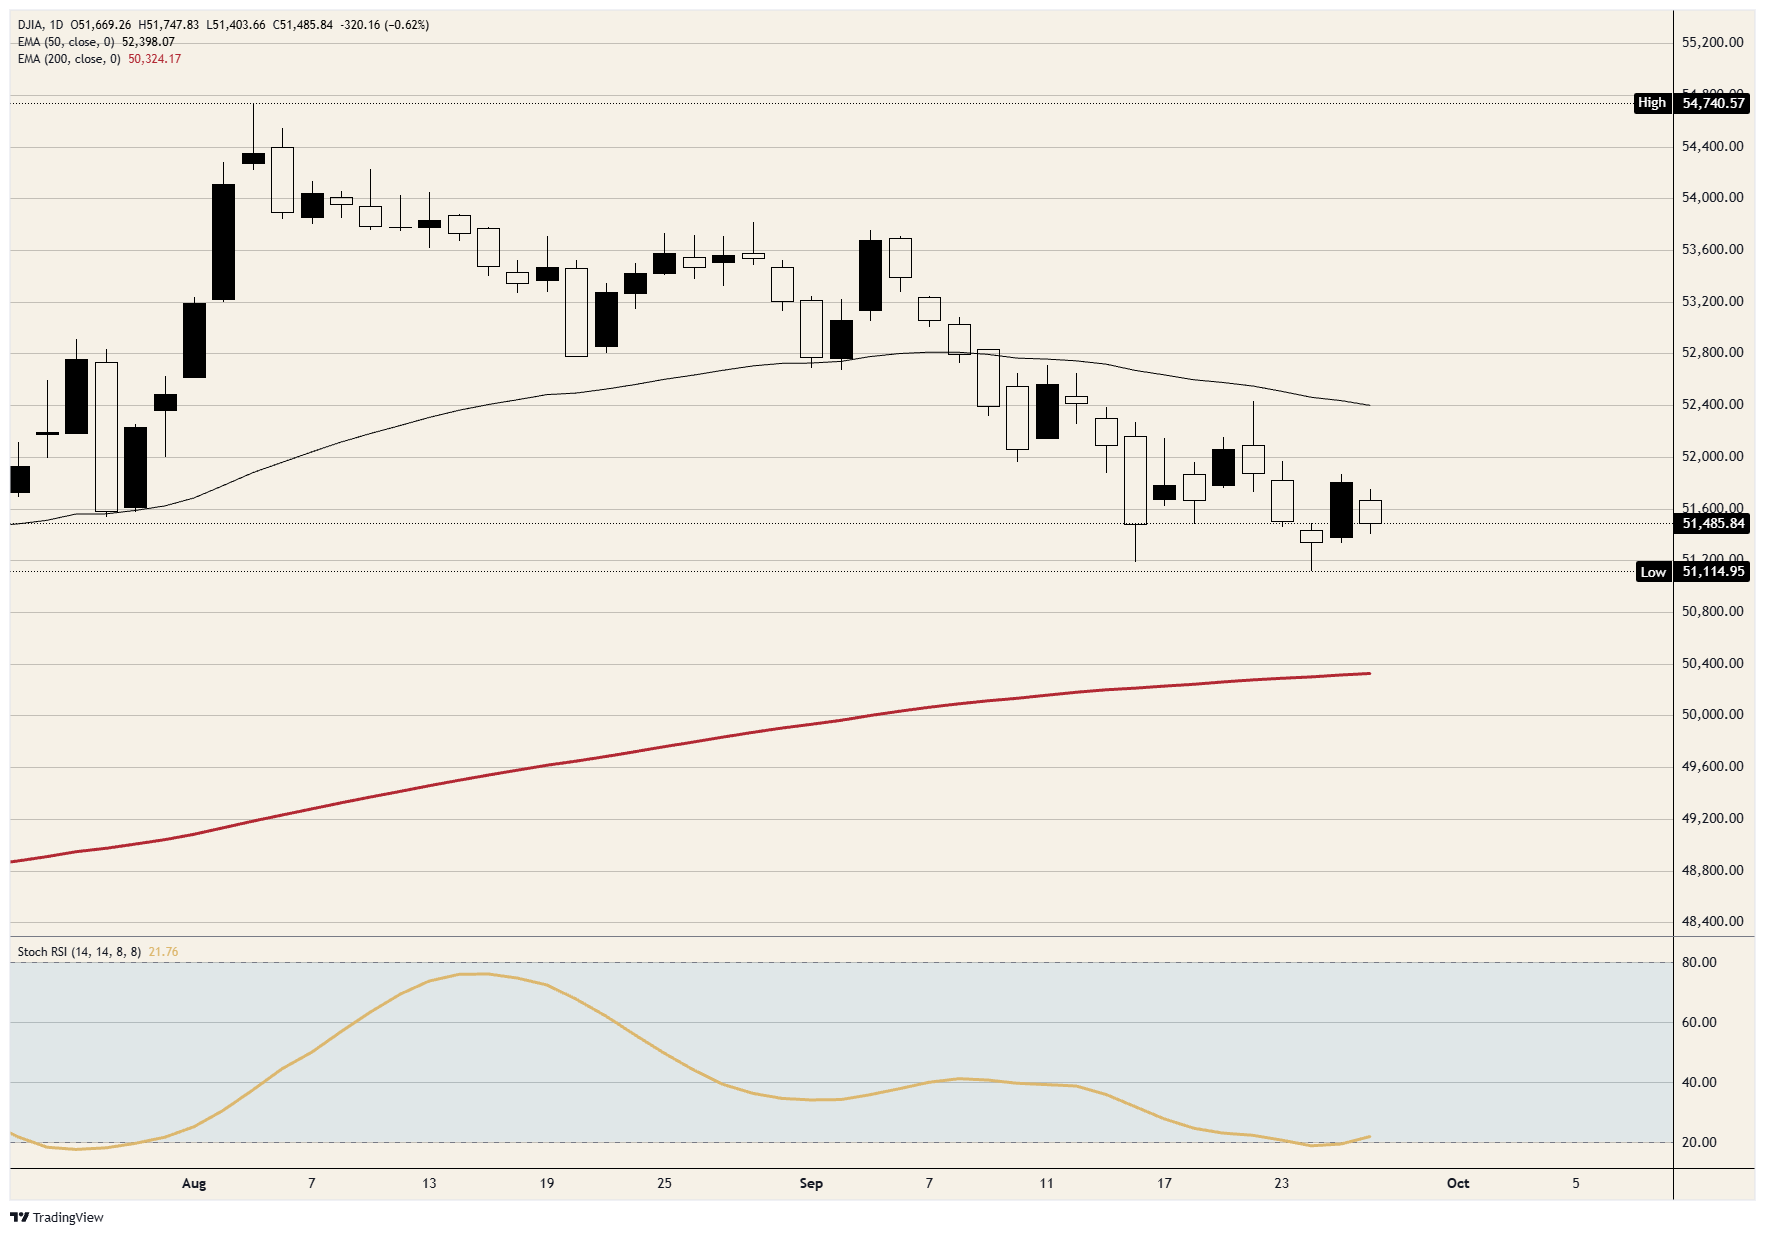
Resistance: The index hasn't closed above 52,000 since September 21, and Friday's high just under 51,900 was as far as the rally got. The 50-day Exponential Moving Average (EMA) near 52,400 is where the September 22 bounce stopped, so it caps any recovery that clears 52,000.
Support: Monday's low near 51,400 comes first. Beneath it, the 51,100 to 51,200 area has held twice this month, on September 16 and September 24.
Bias: Risk-reward skews lower while 52,000 caps on a closing basis, with 51,100 the first objective and the 200-day EMA near 50,300 after that. Momentum on the daily Stochastic Relative Strength Index (Stoch RSI) has turned up from around 22, near the bottom of its range, so a bounce toward 52,000 could come before the next leg down. The call is wrong on a daily close above 52,000.
Dow Jones daily chart
Dow Jones FAQs
The Dow Jones Industrial Average, one of the oldest stock market indices in the world, is compiled of the 30 most traded stocks in the US. The index is price-weighted rather than weighted by capitalization. It is calculated by summing the prices of the constituent stocks and dividing them by a factor, currently 0.152. The index was founded by Charles Dow, who also founded the Wall Street Journal. In later years it has been criticized for not being broadly representative enough because it only tracks 30 conglomerates, unlike broader indices such as the S&P 500.
Many different factors drive the Dow Jones Industrial Average (DJIA). The aggregate performance of the component companies revealed in quarterly company earnings reports is the main one. US and global macroeconomic data also contributes as it impacts on investor sentiment. The level of interest rates, set by the Federal Reserve (Fed), also influences the DJIA as it affects the cost of credit, on which many corporations are heavily reliant. Therefore, inflation can be a major driver as well as other metrics which impact the Fed decisions.
Dow Theory is a method for identifying the primary trend of the stock market developed by Charles Dow. A key step is to compare the direction of the Dow Jones Industrial Average (DJIA) and the Dow Jones Transportation Average (DJTA) and only follow trends where both are moving in the same direction. Volume is a confirmatory criteria. The theory uses elements of peak and trough analysis. Dow’s theory posits three trend phases: accumulation, when smart money starts buying or selling; public participation, when the wider public joins in; and distribution, when the smart money exits.
There are a number of ways to trade the DJIA. One is to use ETFs which allow investors to trade the DJIA as a single security, rather than having to buy shares in all 30 constituent companies. A leading example is the SPDR Dow Jones Industrial Average ETF (DIA). DJIA futures contracts enable traders to speculate on the future value of the index and Options provide the right, but not the obligation, to buy or sell the index at a predetermined price in the future. Mutual funds enable investors to buy a share of a diversified portfolio of DJIA stocks thus providing exposure to the overall index.
인기 기사
1South Korea BOK Manufacturing BSI dipped from previous 81 to 79 in October2Dow Jones Industrial Average gives back Friday's rally on a Boeing delay3Gold price crashes as 2007-era yields trigger brutal sell-off4Ethereum Price Forecast: BitMine holdings top 6 million ETH amid geopolitical tensions5Japanese Yen trades cautiously as intervention risk clashes with Fed rate hike bets6Strategy buys 1,665 Bitcoin amid renewed geopolitical tensions7Forex Today: The RBA and Fedspeak grab all the attention8US 10-year yield revisits 2007 heights as curve flirts with inversion9Crude Oil round-trips between a rejected Iran plan and a sanctions offer



소셜 미디어












이 웹사이트에 제공된 정보는 일반적인 성격의 정보일 뿐이며 개인 맞춤형 금융 자문을 구성하지 않습니다. 이 웹사이트의 정보를 바탕으로 행동하기 전에, 귀하의 목표, 재정 상황 및 필요에 비추어 해당 정보의 적합성을 고려해야 합니다. CFD 및 FX 마진 계약에 대한 투자는 상당한 위험을 수반하며 모든 투자자에게 적합하지 않을 수 있습니다. 귀하는 최초 예치금보다 더 큰 손실을 입을 수 있습니다. 귀하는 기초자산에 대한 소유권이나 어떠한 이해관계도 보유하지 않습니다. 거래를 시작하기 전에 독립적인 자문을 구하고 관련 위험을 충분히 이해하시기를 권장합니다. 웹사이트에 기재된 상품을 취득하기 전에 공시 문서를 읽고 검토하는 것이 중요합니다. 이 웹사이트에서 제공되는 정보 및 광고는 그러한 사용이 현지 법률 및 규정에 위배되는 국가 또는 관할권의 개인이 사용하도록 의도된 것이 아닙니다. 이 웹사이트에서 제공되는 상품 및 서비스는 미국, 말레이시아 및 태국 거주자를 대상으로 하지 않습니다.
TMGM은 다양한 관할권에서 승인 및 규제를 받고 있습니다.
TMGM으로 거래하는 Trademax Australia Limited는 호주 증권투자위원회(ASIC)의 규제를 받으며, AFSL 번호 436416이고 Level 28, One International Tower, 100 Barangaroo Avenue, 2000 Sydney, NSW Australia에 위치하고 있습니다.
이메일: support@tmgm.com.au
TMGM으로 거래하는 Trademax Global Limited는 바누아투 금융서비스위원회(VFSC)의 승인 및 규제를 받으며, 등록 번호 40356이고 1276, Kumul Highway, Port Vila, Vanuatu, Republic of Vanuatu에 등록되어 있습니다.
이메일: support@tmgm.com
Trademax Global Markets (SE) Limited(이하 TMGM)는 세이셸 금융청(FSA)의 인가 및 규제를 받으며, 허가 번호는 SD224입니다. 회사는 세이셸 마헤, 프로비던스 에스테이트 ABIS 센터, 사무실 번호 13에 등록되어 있습니다.
이메일: support@tmgm.com
TMGM으로 거래하는 Trademax Global Markets (International) Pty Ltd는 모리셔스 금융서비스위원회(FSC)의 승인 및 규제를 받으며 라이선스 번호 GB22201012이고, 33, Edith Cavell Street C/o IQ EQ Fund Services (Mauritius) Ltd Port Louis, 11324 Mauritius에 등록되어 있습니다.
이메일: support@tmgm.com
Copyright © TMGM. All rights reserved