


Pi Network Price Forecast: PI halts decline at key support amid easing retail support
- PI Network is up nearly 2% on Thursday, ticking higher after a roughly 7% decline the previous day.
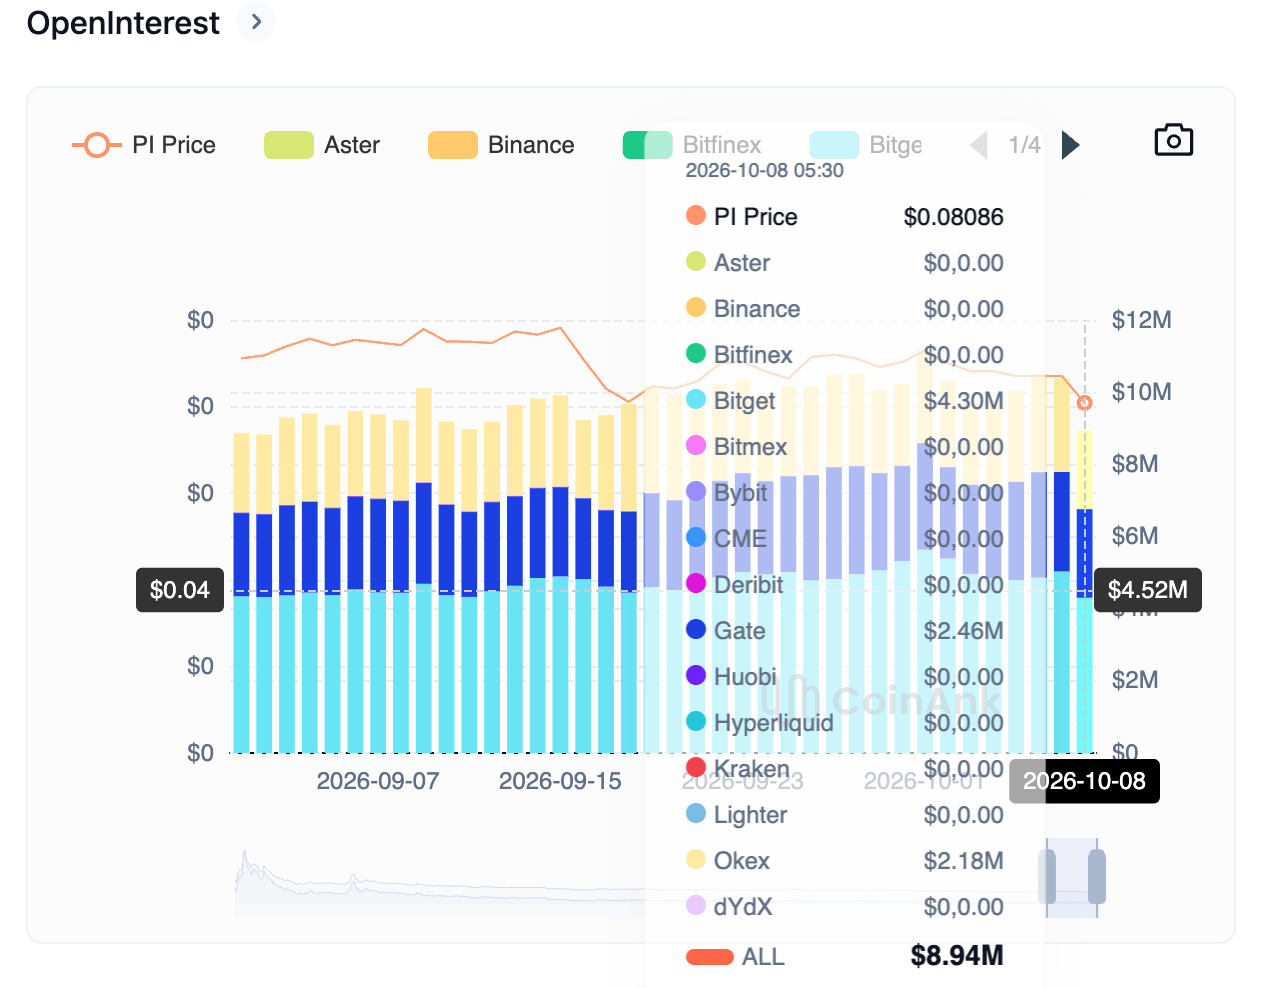
- PI futures Open Interest declines to $8.94 million, suggesting reduced risk appetite.
- The technical outlook for PI is bearish, as downside momentum prevails.
Pi Network (PI) price is up nearly 2% on Thursday, ticking higher after seven consecutive bearish daily closes, including a 7% decline the previous day. Despite the mild recovery, retail support is lacking as PI futures Open Interest declines to $8.94 million, from $10.38 million the previous day. The technical outlook for the PI token is bearish as downside pressure mounts on the $0.0800 support level.

Pi Network is losing retail demand despite elevated social chatter
Pi Network futures witness a decline in the notional value of all open positions. CoinAnk data shows the PI futures Open Interest (OI) down to $8.94 million from $10.38 million the previous day, suggesting a reduced value due to a spot price decline or a possible positional wipeout.
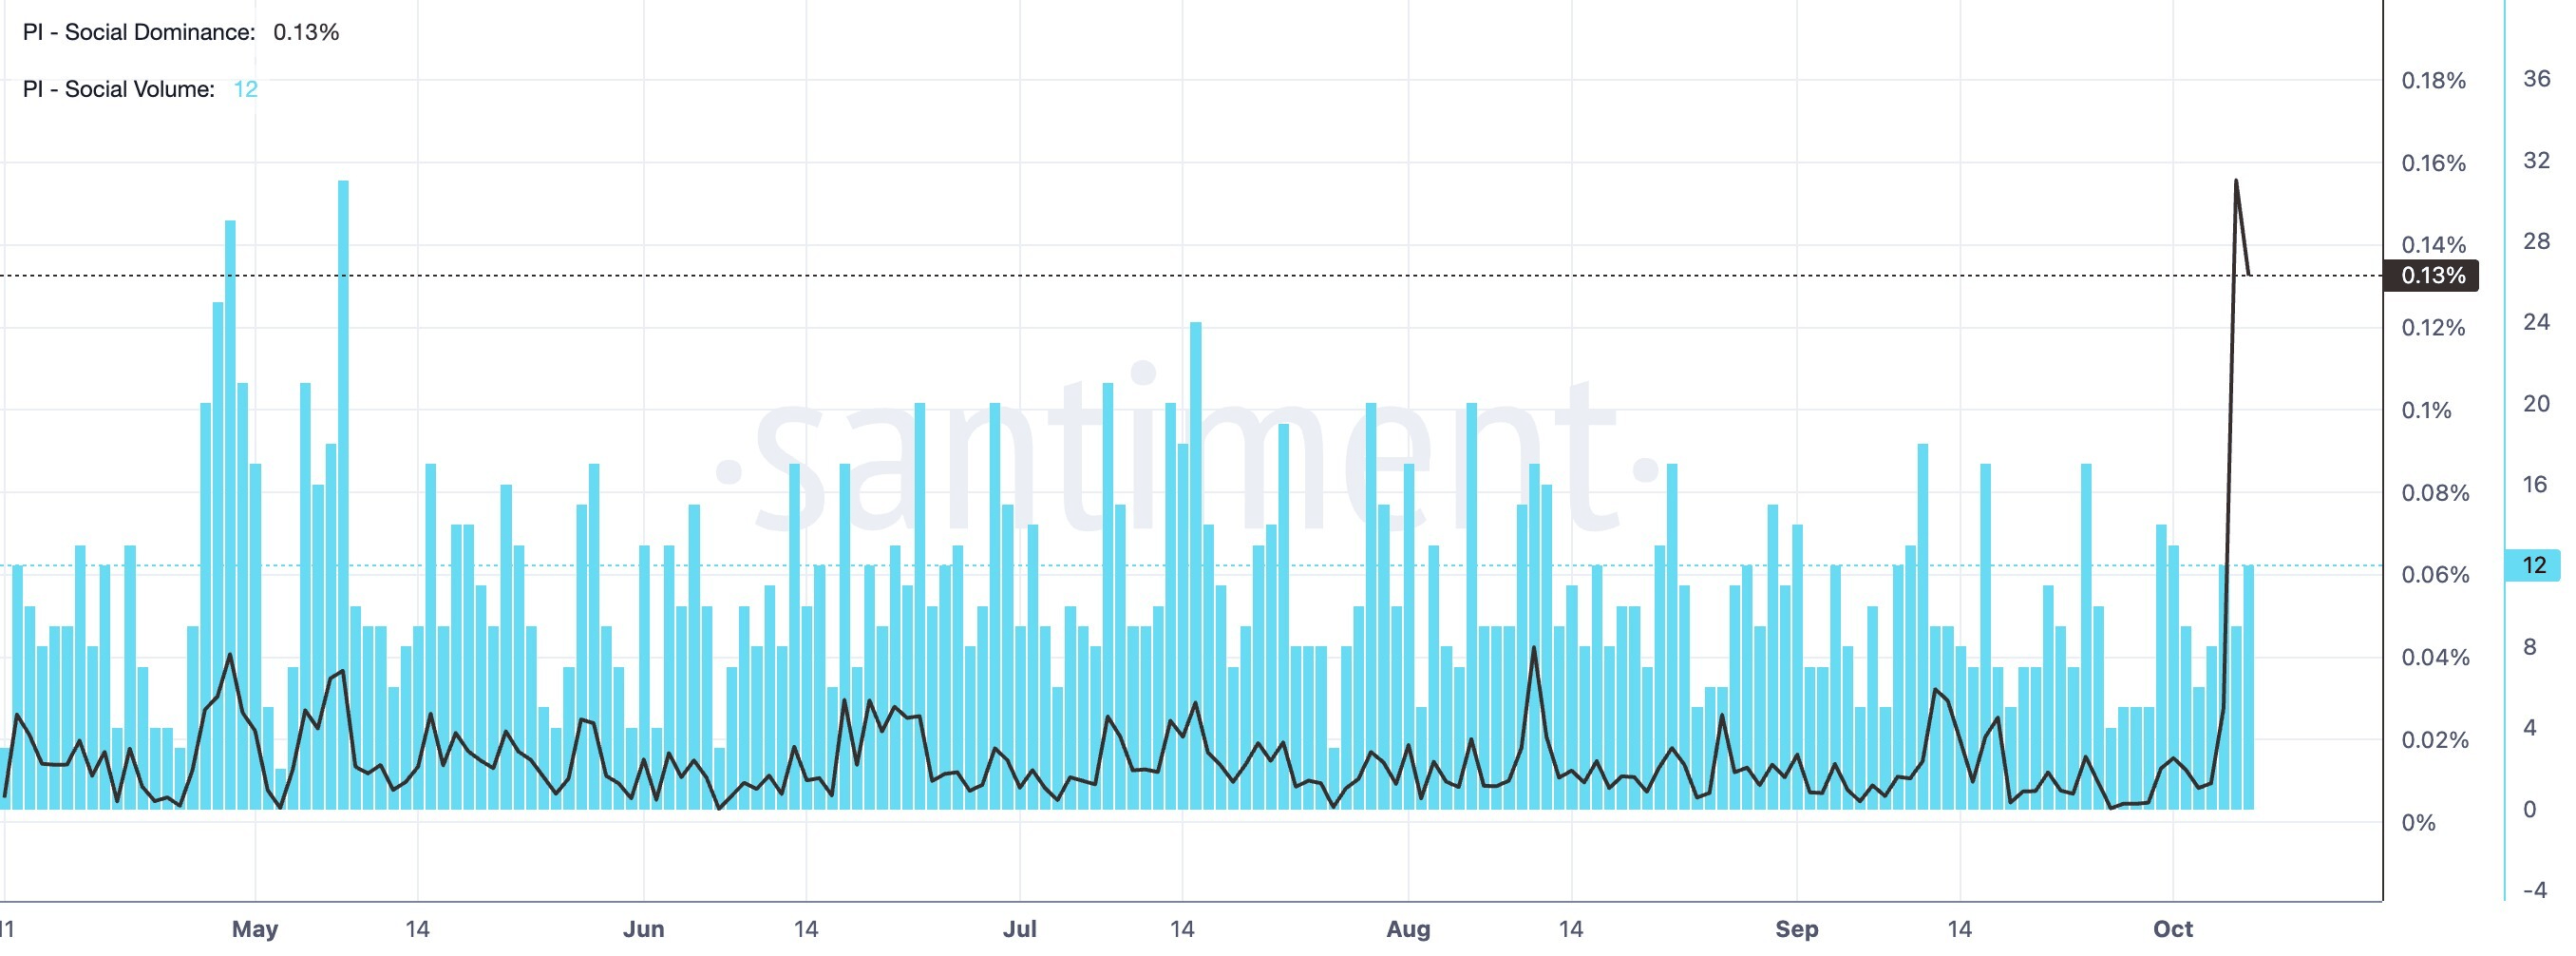
On the other hand, Santiment data shows elevated social buzz for the PI token, with the social dominance score at 0.13%, after a surge to 0.14% the previous day.
Technical outlook: Pi Network hints at a rebound
Pi Network trades around $0.0823 at press time on Thursday, extending a mild rebound from the $0.0801 support level set by the July 31 low. The PI token maintains a bearish near-term tone as it holds beneath both the 50-day and 200-day Exponential Moving Averages (EMAs) at $0.0902 and $0.1247, respectively.
From a technical perspective, PI trades below the 23.6% Fibonacci retracement at $0.0827, measured from $0.1341 to $0.0704, keeping the broader downside bias intact. For a sustained recovery, PI must reclaim the $0.0827 level, which could pave the path toward the 50-day EMA at $0.0902.
Momentum remains soft on the daily chart, with the Relative Strength Index (RSI) around 38, suggesting firm selling pressure rather than outright oversold conditions. At the same time, the Moving Average Convergence Divergence (MACD) line declines below the signal line into the negative territory, hinting that bearish momentum is gaining strength.
On the downside, the only nearby structural support is at the July 31 low of $0.0801, guarding the Fibonacci anchor around $0.0704, where buyers may attempt to build a more durable floor.
(The technical analysis of this story was written with the help of an AI tool. Know more.)
인기 기사
1Indian Rupee: Broadening price pressures challenge RBI – Societe Generale2Dow Jones futures drop as US Treasury yields surge3CEE FX: Dovish stance keeps Zloty and Leu under pressure – ING4Japanese Yen: Bullish bias within broad range against US Dollar – UOB5British Pound bounces off weekly low vs fragile Yen; intervention risks cap upside6US Dollar Index Price Forecast: Hawkish Fed bets build case for more upside towards 102.857Euro: Fed and ECB policy outlooks in focus - Danske Bank8WTI Oil rushes above $90.00 as tensions in the Middle East grow9EUR/JPY Price Forecast: Rebounds above 177.00, oversold territory
실시간 시세


TECHNICAL에 대한 모든 것
ICT 트레이딩이란 무엇인가요? 이너 서클 트레이더(Inner Circle Trader) 개념 설명
지지선과 저항선: 의미, 유형, 레벨을 그리는 방법 및 트레이딩 전략
유동성이란 무엇인가요? 트레이딩 및 금융시장에서의 의미
유동성 스윕: 의미, 예시 및 트레이딩 전략
트레이딩의 시장 구조: 완벽 가이드 (상승장, 하락장, 횡보장)
캐릭터 변화 (CHoCH): 정의, 예시 및 전략
다크 클라우드 커버 패턴이란 무엇이며, 이를 어떻게 트레이딩하나요?
피어싱 라인 캔들스틱 패턴이란 무엇이며, 이를 어떻게 트레이딩하나요?
트위저 탑 및 바닥 캔들스틱 패턴이란 무엇인가요?

소셜 미디어












이 웹사이트에 제공된 정보는 일반적인 성격의 정보일 뿐이며 개인 맞춤형 금융 자문을 구성하지 않습니다. 이 웹사이트의 정보를 바탕으로 행동하기 전에, 귀하의 목표, 재정 상황 및 필요에 비추어 해당 정보의 적합성을 고려해야 합니다. CFD 및 FX 마진 계약에 대한 투자는 상당한 위험을 수반하며 모든 투자자에게 적합하지 않을 수 있습니다. 귀하는 최초 예치금보다 더 큰 손실을 입을 수 있습니다. 귀하는 기초자산에 대한 소유권이나 어떠한 이해관계도 보유하지 않습니다. 거래를 시작하기 전에 독립적인 자문을 구하고 관련 위험을 충분히 이해하시기를 권장합니다. 웹사이트에 기재된 상품을 취득하기 전에 공시 문서를 읽고 검토하는 것이 중요합니다. 이 웹사이트에서 제공되는 정보 및 광고는 그러한 사용이 현지 법률 및 규정에 위배되는 국가 또는 관할권의 개인이 사용하도록 의도된 것이 아닙니다. 이 웹사이트에서 제공되는 상품 및 서비스는 미국, 말레이시아 및 태국 거주자를 대상으로 하지 않습니다.
TMGM은 다양한 관할권에서 승인 및 규제를 받고 있습니다.
TMGM으로 거래하는 Trademax Australia Limited는 호주 증권투자위원회(ASIC)의 규제를 받으며, AFSL 번호 436416이고 Level 28, One International Tower, 100 Barangaroo Avenue, 2000 Sydney, NSW Australia에 위치하고 있습니다.
이메일: support@tmgm.com.au
TMGM으로 거래하는 Trademax Global Limited는 바누아투 금융서비스위원회(VFSC)의 승인 및 규제를 받으며, 등록 번호 40356이고 1276, Kumul Highway, Port Vila, Vanuatu, Republic of Vanuatu에 등록되어 있습니다.
이메일: support@tmgm.com
Trademax Global Markets (SE) Limited(이하 TMGM)는 세이셸 금융청(FSA)의 인가 및 규제를 받으며, 허가 번호는 SD224입니다. 회사는 세이셸 마헤, 프로비던스 에스테이트 ABIS 센터, 사무실 번호 13에 등록되어 있습니다.
이메일: support@tmgm.com
TMGM으로 거래하는 Trademax Global Markets (International) Pty Ltd는 모리셔스 금융서비스위원회(FSC)의 승인 및 규제를 받으며 라이선스 번호 GB22201012이고, 33, Edith Cavell Street C/o IQ EQ Fund Services (Mauritius) Ltd Port Louis, 11324 Mauritius에 등록되어 있습니다.
이메일: support@tmgm.com
Copyright © TMGM. All rights reserved