

Negociação
Explore uma ampla variedade de mercados com preços competitivos, alta liquidez e ferramentas de negociação avançadas.
Saiba Mais 
Plataforma
Negocie sem interrupções com a poderosa plataforma da TMGM, desenvolvida para velocidade, precisão e uma experiência de negociação superior.
Saiba Mais Plataforma de Negociação
Ferramentas de Negociação
Academia
Aprenda os fundamentos da negociação com recursos para iniciantes, incluindo guias, webinars e insights de mercado.
Saiba Mais TMGM Academy
Notícias & Análise
Receba atualizações de mercado em tempo real e análises de especialistas para se antecipar às oportunidades de negociação.
Saiba Mais Notícias & Análise
Sobre
Descubra o que diferencia a TMGM — nossa presença global, força regulatória e compromisso com a inovação em negociação.
Saiba Mais Por Que Escolher a TMGM
Ripple and Stellar outlook: Facing pullback amid broader uptrend
- XRP steadies near $1.509 on Thursday after declining 4.56% the previous day.
- XLM pulls back toward $0.202 after falling 6.52% mid-week; remains within the broader uptrend.
- Robust institutional demand through XRP ETFs and continued network partnerships for Stellar back a constructive outlook for both altcoins.
Ripple (XRP) and Stellar (XLM) faces a healthy correction following their recent strong rallies. XRP trades near $1.509 after falling 4.56% the previous day, while XLM hovers around $0.202 following a 6.52% decline. Despite the short-term pullback, renewed institutional demand for XRP through spot Exchange Traded Funds (ETFs) and continued developments and partnerships across the Stellar network support a constructive outlook for both altcoins.

XRP sees further growth in institutional demand
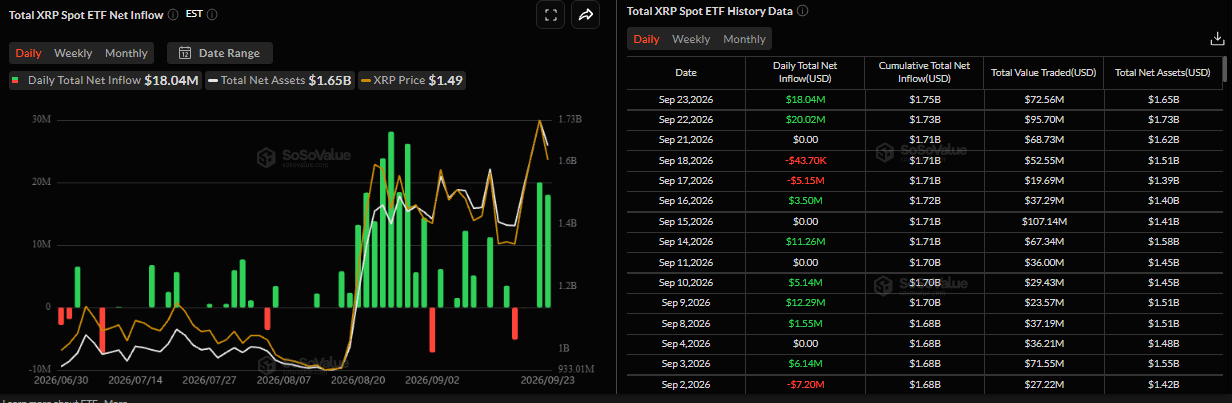
SoSoValue data showed that spot XRP ETFs recorded an inflow of $18.04 million on Wednesday, after a $20.02 million inflow on Tuesday, indicating strong investor demand. If these inflows continue and intensify throughout this week, XRP could extend the ongoing rally in the coming days.
XLM’s growing partnerships
Stellar’s official X account announced on Tuesday that its blockchain is now live on BVNK Finance.
“This integration gives enterprise customers access to the blockchain designed for high-volume, sub-penny digital asset transfers. Cross-border payments, remittances, and treasury management,” said Stellar in its post.
This partnership indicates growing institutional adoption of the Stellar network. In addition, the collaboration could expand access and strengthen the network, supporting a bullish long-term outlook for Stellar and its native token, XLM.
Some signs of caution
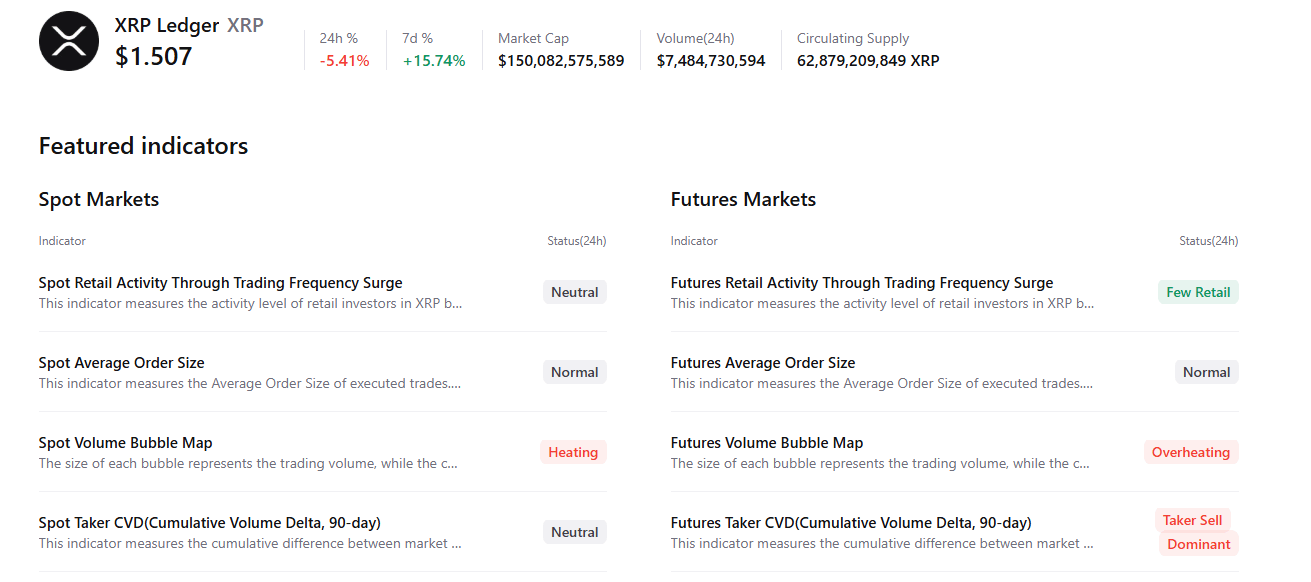
CryptoQuant’s summary data shows cautious signs for XRP and XLM. XRP’s futures markets show sell-side dominance and overheating conditions, with few retail investors actively following the massive price surge. In addition, spot markets show heating conditions while other metrics remain neutral, highlighting a mildly bearish, cautious sentiment bias among XRP traders.
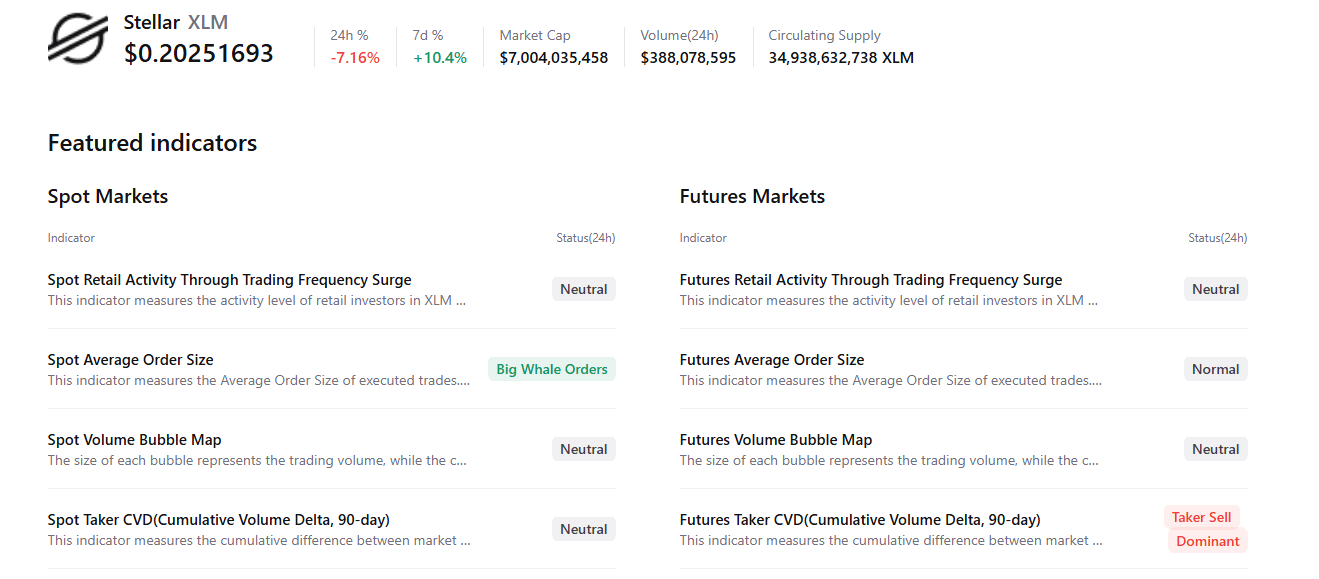
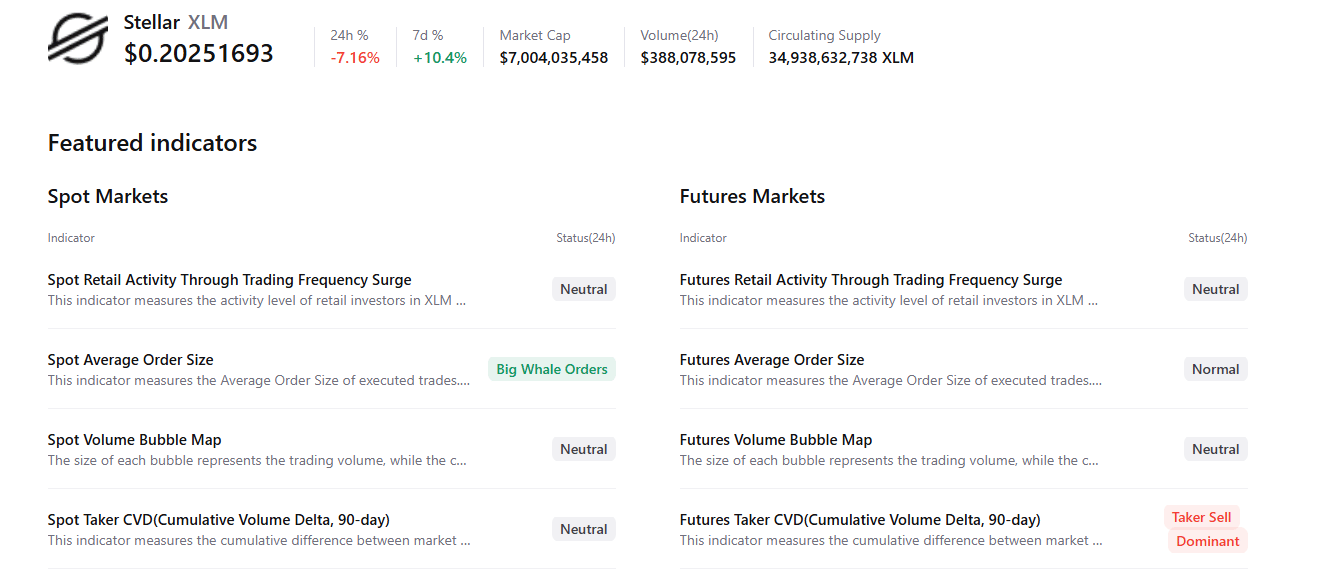
Similarly, XLM futures markets show sell-side dominance, while spot markets show large whale orders; other metrics remain neutral, signaling a cautious sentiment bias among XLM traders.
XRP technical outlook: Bulls remain in control
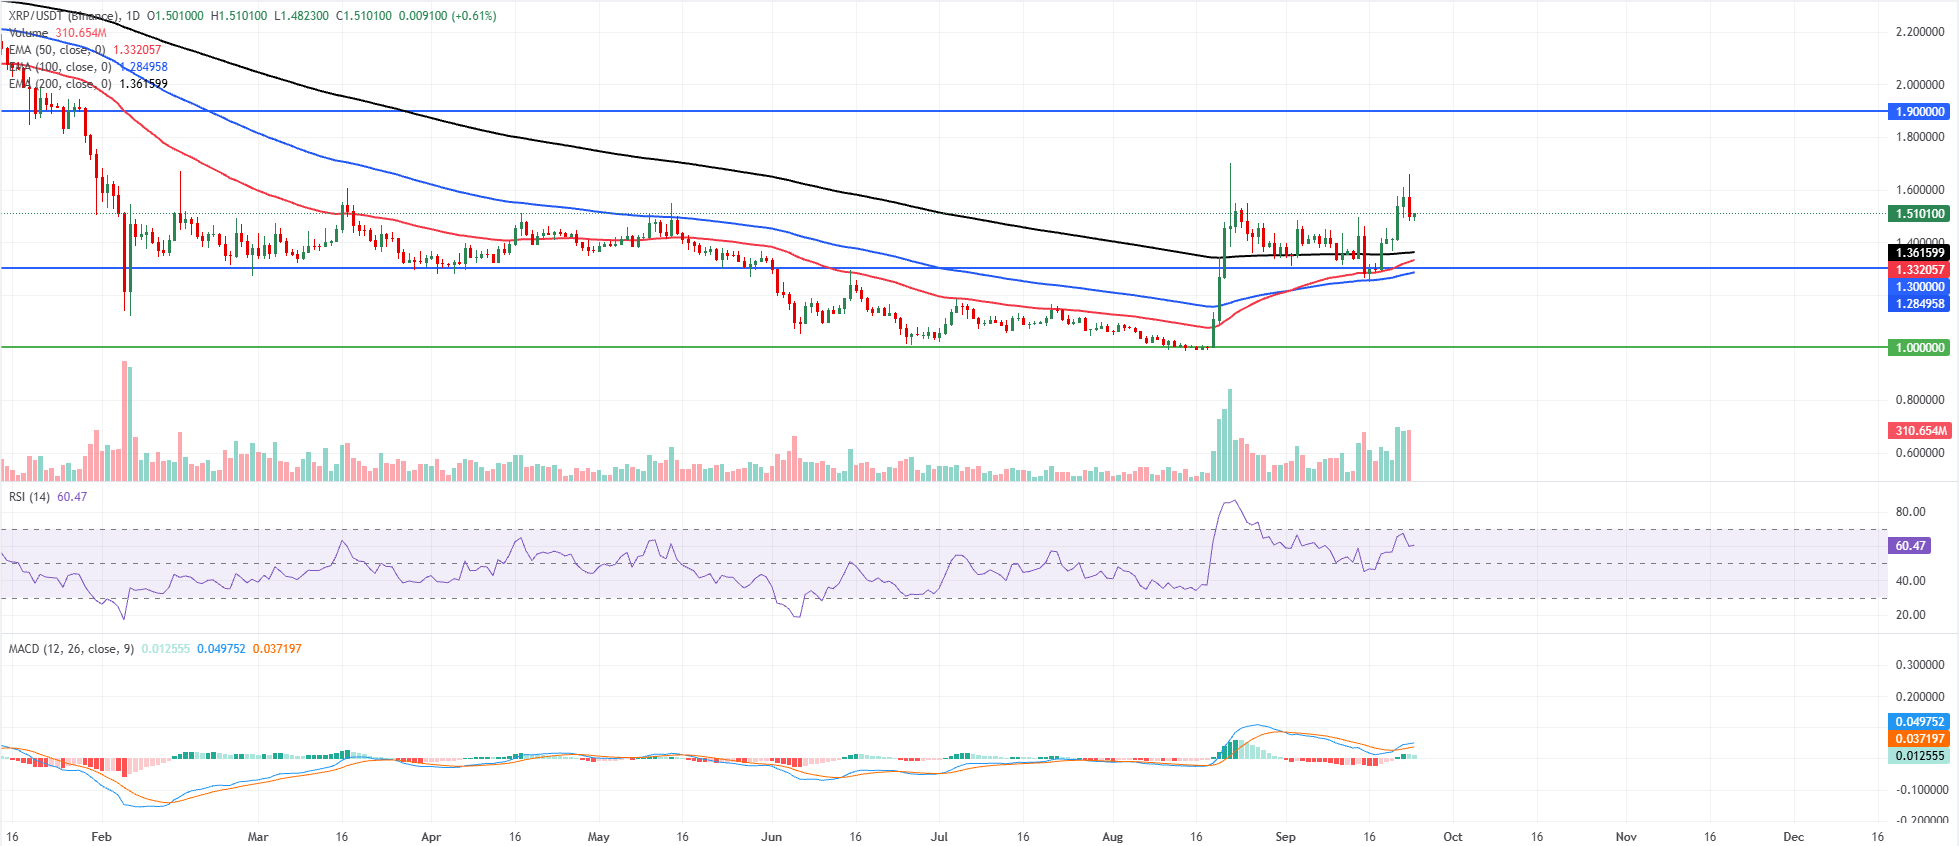
XRP price trades at $1.509 on Thursday, extending a bullish near-term bias as it holds well above the 50-day, 100-day and 200-day Exponential Moving Averages (EMAs), clustered between roughly $1.280 and $1.360.
This positioning suggests underlying demand remains firm after the recent advance, while the Relative Strength Index (RSI) around 60 keeps momentum constructive without signaling overbought conditions. The Moving Average Convergence Divergence (MACD) indicator remains marginally positive, with the MACD line above zero and a modestly positive histogram, reinforcing the view of a still-supportive trend rather than an overextended spike.
On the downside, immediate support is seen at the 200-day EMA near $1.361, followed by the 50-day EMA at $1.332 and the horizontal level at $1.300, which together define a broader demand zone before deeper bids are expected around the 100-day EMA at $1.284 and the structural floor at $1.000.
On the topside, the next notable resistance is the horizontal barrier at $1.900, and a sustained break above this cap would open the way for continued upside. At the same time, failure to overcome it could trigger consolidation back toward the EMA cluster.
XLM technical outlook: Holds above key EMAs
XLM price trades at $0.202 on Thursday, holding comfortably above the 50-day, 100-day, and 200-day EMAs at $0.185, $0.183, and $0.189, respectively, reinforcing a constructive near-term bias.
The RSI around 58 stays in positive territory without being overbought. At the same time, the MACD remains positive with the line above zero, suggesting bullish momentum persists even as the recent advance starts to consolidate.
On the downside, initial support sits at the EMA cluster between the 200-day EMA at $0.189 and the 50-day EMA at $0.185, followed by the 100-day EMA at $0.183, where buyers could try to defend the short-term trend. A deeper pullback would expose the horizontal support level near $0.177, with a more distant structural floor at $0.142, which would come into play only if selling pressure accelerates and the broader bullish context deteriorates.
(The technical analysis of this story was written with the help of an AI tool. Know more.)
ARTIGOS POPULARES
1EUR/USD Price Forecast: Trades below 1.1400, near two-month low ahead of Trump-Xi summit2Swiss Franc strengthens ahead of SNB policy decision3India Gold price today: Gold steadies, according to FXStreet data4Crypto Market Overview: Bitcoin slips to $84,000 on rate hike bets – Worldcoin, Pepe lead losses5New Zealand Dollar consolidates around 0.5675 vs USD as bears await Trump-Xi summit6EUR/JPY Price Forecast: Softens below 180.00, bearish bias persists below 100-day SMA7Ripple and Stellar outlook: Facing pullback amid broader uptrend8Gold struggles below $4,300, one-week low as Fed hike bets and Iran risks underpin USD9Canadian Dollar holds steady amid oil uncertainties, hawkish Fed sentiment
COTAÇÕES AO VIVO


TUDO SOBRE TECHNICAL
O que é o padrão Dark Cloud Cover e como negociá-lo?
O que é o padrão de candlestick Piercing Line e como negociá-lo?
O que são os padrões de candlestick Tweezer Top e Tweezer Bottom?
Padrão de Candlestick Inside Bar: O Que É, Como Identificá-lo e Como Negociá-lo
Padrão de Candlestick Hanging Man: Como Identificá-lo e Negociá-lo
Como Desenhar o Retraçamento de Fibonacci: Dominando a Proporção Áurea no Trading
O que é MACD e Como Encontrar Pontos de Entrada e Saída
O que é o RSI, o Índice de Força Relativa
Comece Agora!
Cadastre-se e acesse os Mercados Globais em menos de 3 minutos

Conecte-se Conosco









Contatos
Telefone: +61 2 8036 8388
Fax: +61 2 8036 8388
Email: support@tmgm.com



As informações fornecidas neste website são apenas de natureza geral e não constituem aconselhamento financeiro pessoal. Antes de agir com base em qualquer informação neste website, deve considerar a adequação da informação em relação aos seus objetivos, situação financeira e necessidades. Investir em CFDs e contratos de margem de FX envolve riscos significativos e não é adequado para todos os investidores. Poderá perder mais do que o seu depósito inicial. Não possui, nem detém, qualquer interesse no ativo subjacente. Recomendamos que procure aconselhamento independente e que se certifique de que compreende plenamente os riscos envolvidos antes de negociar. É importante que leia e considere o documento de divulgação antes de adquirir qualquer produto listado no website. As informações e os anúncios oferecidos neste website não se destinam a ser utilizados por qualquer pessoa em qualquer país ou jurisdição onde tal utilização seja contrária às leis e regulamentos locais. Os Produtos e Serviços oferecidos neste website não se destinam a residentes dos Estados Unidos, da Malásia e da Tailândia.
A TMGM é autorizada e regulada em várias jurisdições.
Trademax Australia Limited, operando como TMGM, é regulada pela Comissão Australiana de Valores Mobiliários e Investimentos (ASIC), AFSL nº 436416 e está localizada no Level 28, One International Tower, 100 Barangaroo Avenue, 2000 Sydney, NSW Austrália.
Email: support@tmgm.com.au
Trademax Global Limited, operando como TMGM, é autorizada e regulada pela Comissão de Serviços Financeiros de Vanuatu (VFSC), número de registro 40356 e registrada em 1276, Kumul Highway, Port Vila, Vanuatu, República de Vanuatu.
Email: support@tmgm.com
Trademax Global Markets (SE) Limited, operando como TMGM, é autorizada e regulada pela Autoridade de Serviços Financeiros (FSA) das Seychelles, sob o número de licença SD224. A empresa está registrada no Escritório nº 13, Providence Estate ABIS Centre, Mahe, Seychelles.
Email: support@tmgm.com
Trademax Global Markets (International) Pty Ltd, operando como TMGM, é autorizada e regulada pela Comissão de Serviços Financeiros de Maurício (FSC) com licença nº GB22201012, e registrada em 33, Edith Cavell Street C/o IQ EQ Fund Services (Mauritius) Ltd Port Louis, 11324 Maurício.
Email: support@tmgm.com
Copyright © TMGM. Todos os direitos reservados