

XRP and XLM outlook: Derivatives traders turn bearish, caps upside momentum
- XRP price hovers near the 50-day EMA support at $1.40 on Thursday, if it closes below, it suggests further correction.
- XLM price faces rejection from the 50-day EMA, hinting at a downside move.
- Derivatives metrics for both altcoins turn bearish, as funding rates weaken and short positions climb near monthly highs.
Ripple (XRP) and Stellar (XLM) trade in the red on Thursday as bearish sentiment builds in the derivatives market. XRP hovers near its key support, while XLM faces rejection from a similar resistance zone, signaling weakening bullish strength. Moreover, rising short positions and deteriorating funding rates across both altcoins suggest traders are increasingly positioning for further downside.

Derivatives metrics show bearish sentiment
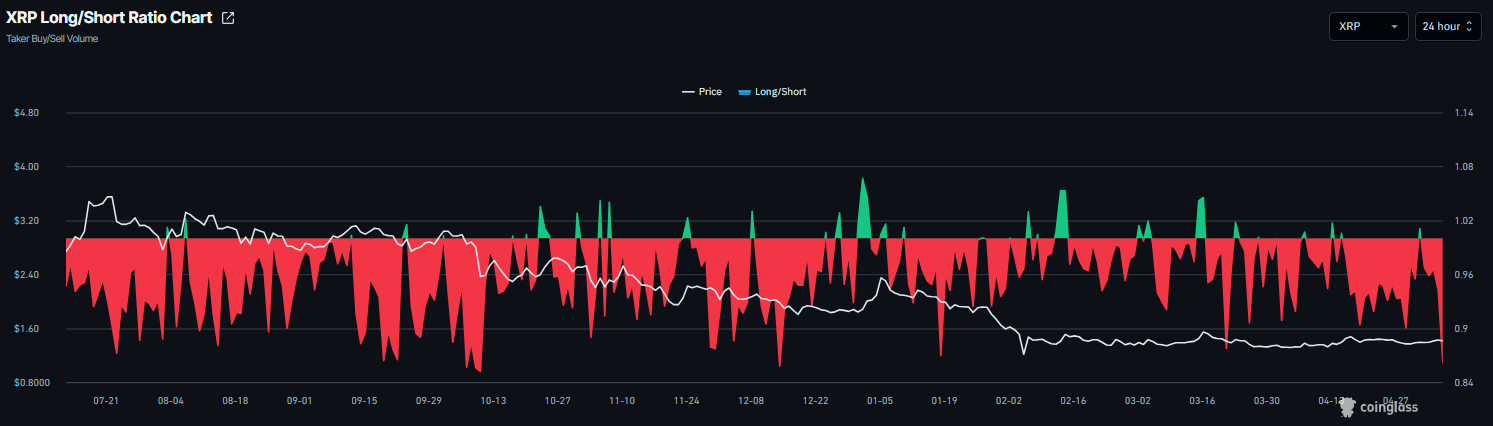
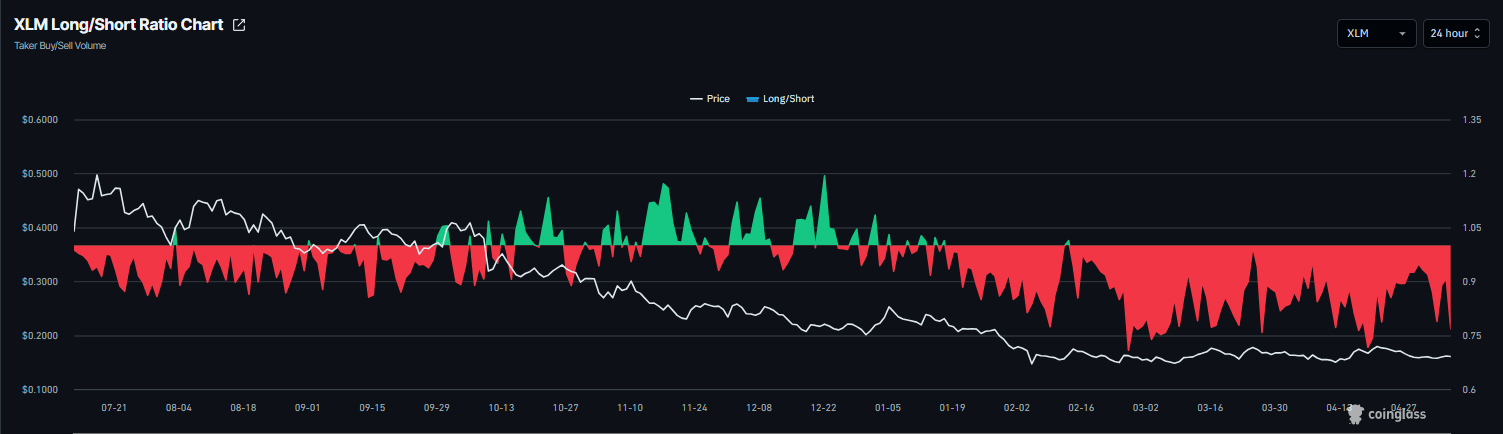
Derivatives data for both XRP and XLM turn negative. CoinGlass’ long-to-short ratios for XRP and XLM are 0.86 and 0.76, respectively, on Thursday, both near their lowest levels over the month. This ratio, being below one, reflects bearish sentiment in the market, as more traders are betting on the asset price to fall.
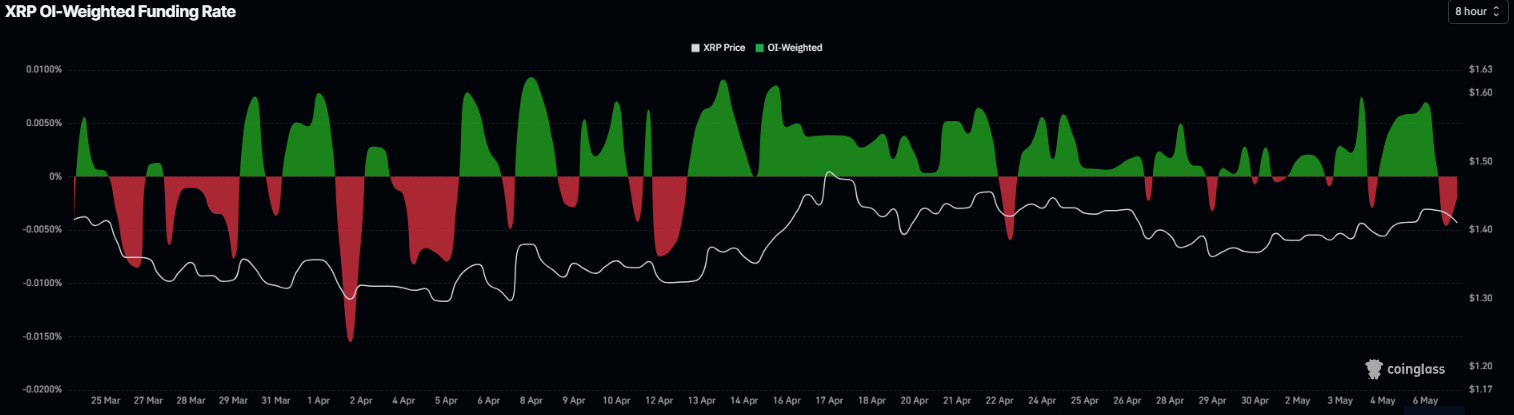
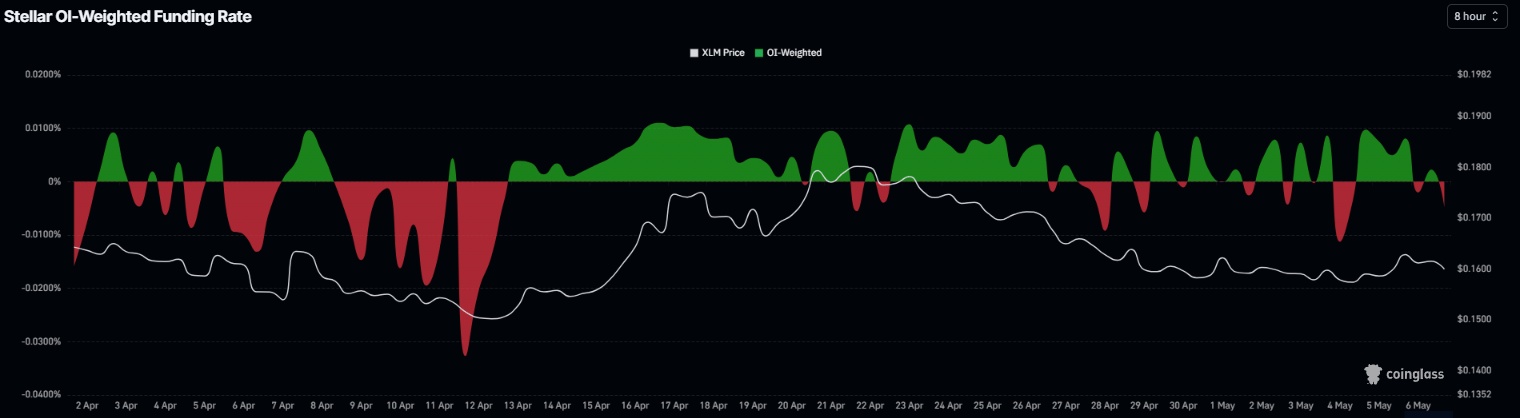
In addition to the rising short bets, the funding rates for both altcoins have also turned negative. CoinGlass’ OI-Weighted Funding Rate data for XRP and XLM read -0.0020% and -0.0048% on Thursday, respectively, further fueling the bearish outlook.
XRP technical outlook: Slips to key support zone
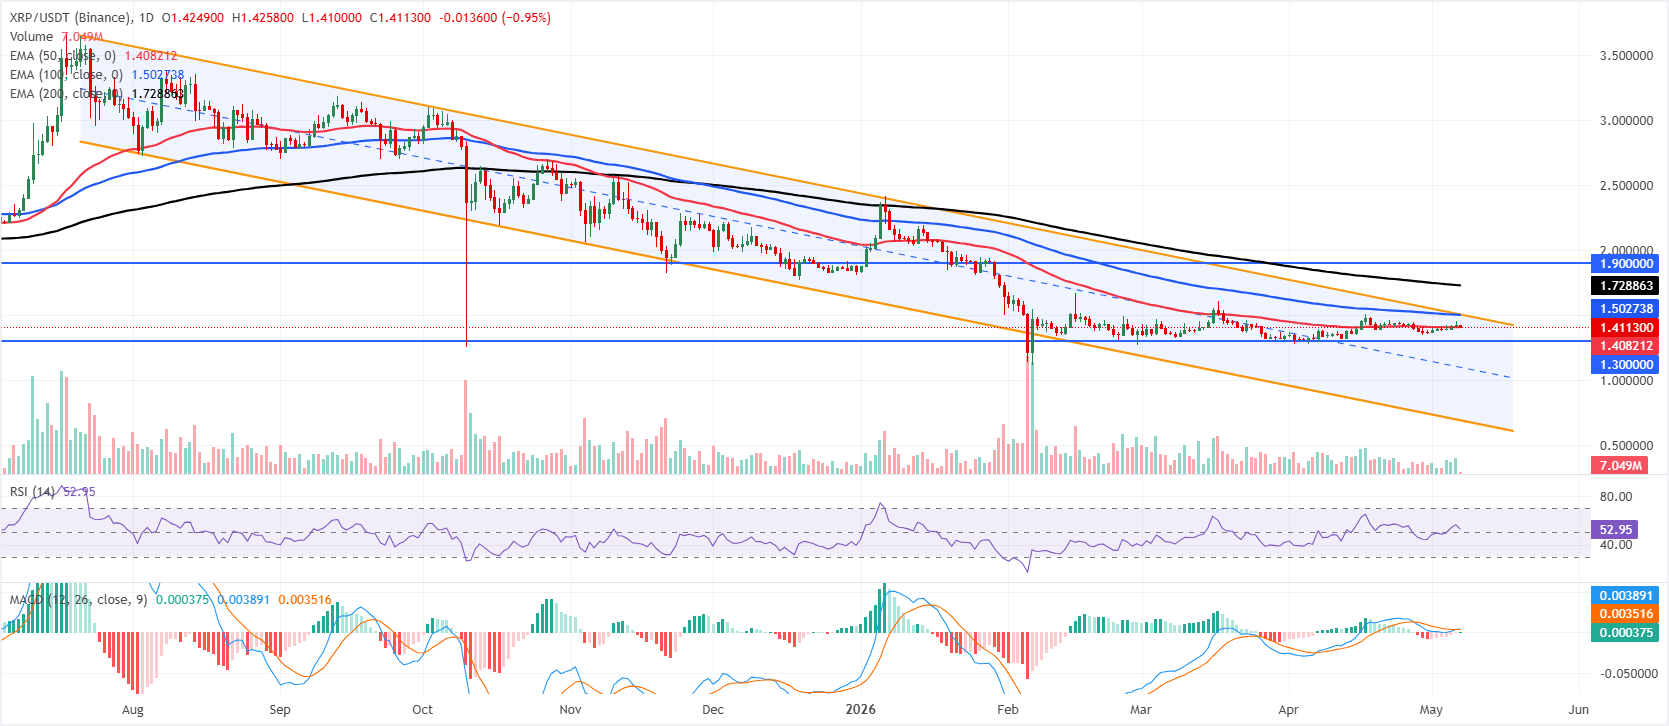
XRP price is trading at $1.41 on Thursday, below the 100-day and 200-day Exponential Moving Averages (EMAs) at $1.50 and $1.72, keeping the broader tone capped within a downward parallel channel, while it holds just above the 50-day EMA at $1.40, which acts as immediate dynamic support.
The Relative Strength Index (RSI) on the daily chart around 52 hints at mildly positive but non-impulsive momentum, and the Moving Average Convergence Divergence (MACD) has inched back above the zero line, suggesting that downside pressure is easing rather than decisively reversing the prevailing corrective structure.
On the topside, initial resistance is seen near the 100-day EMA at $1.50, closely followed by the upper boundary of the descending channel at $1.51; a clear break above this cluster would be needed to open the way toward the 200-day EMA at $1.72 and the more distant horizontal barrier at $1.90.
On the downside, immediate support is provided by the 50-day EMA at $1.40, with a more substantial floor at the horizontal level of $1.30; a sustained drop below that area would expose the channel’s lower boundary near $0.69.
Stellar technical outlook: Faces rejection from 50-day EMA
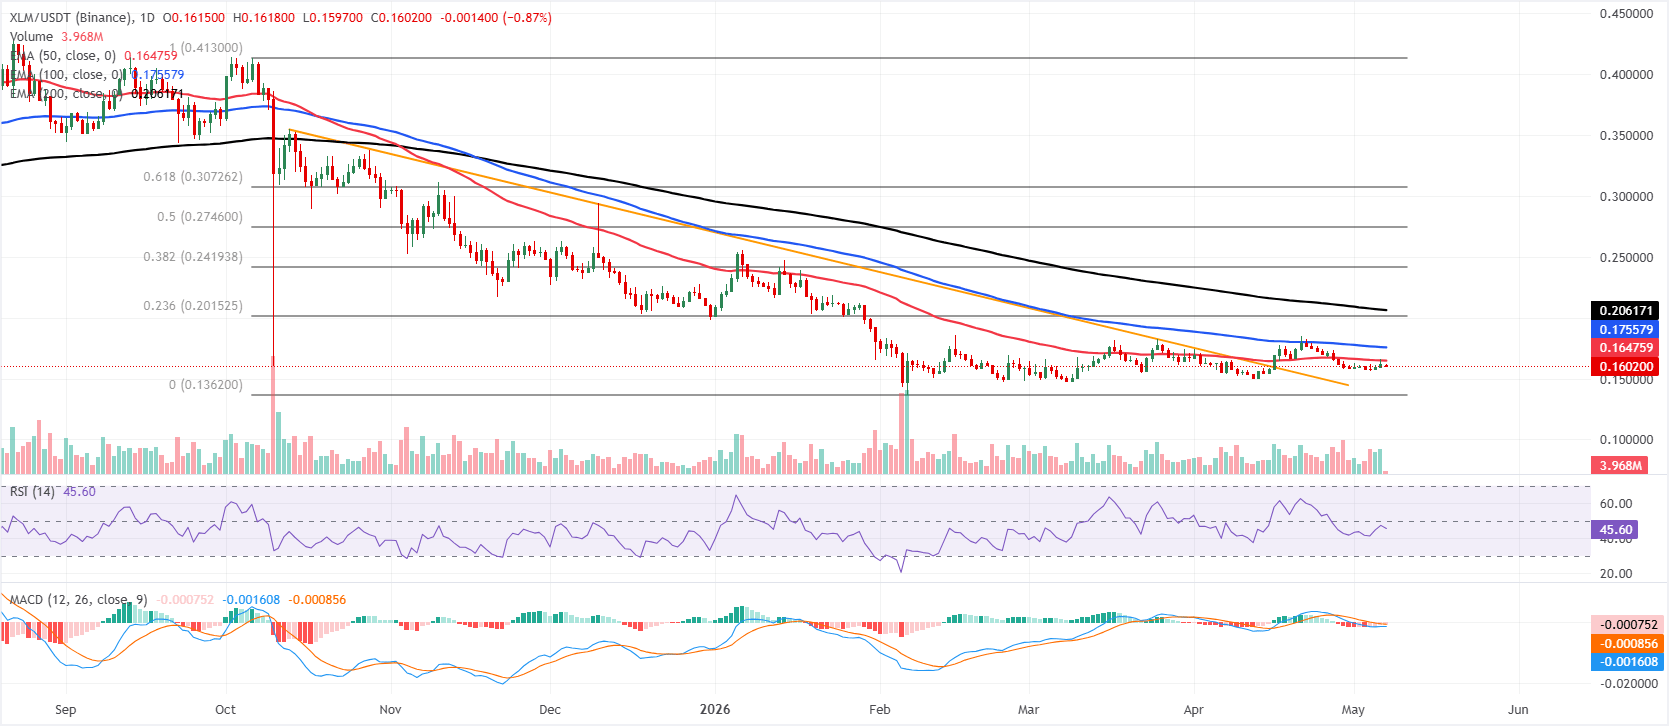
Stellar price is trading at $0.160 on Thursday, clinging to a downward resistance trendline that now acts as a pivotal cap around $0.157. XLM remains clearly below the 50-day, 100-day and 200-day EMAs at $0.164, $0.175 and $0.206, respectively, keeping the broader bias bearish despite the recent attempt to stabilize.
The RSI on the daily chart hovers just below the neutral 50 mark, while the MACD indicator stays marginally below zero, both hinting that downside pressure persists but lacks strong momentum for now.
On the topside, initial resistance lies at the 50-day EMA at $0.164, followed by the 100-day EMA at $0.175. Higher up, the 23.6% Fibonacci retracement of the broader downswing at $0.201 aligns with the 200-day EMA at $0.206 to form a more significant supply zone, with successive Fibonacci barriers emerging at $0.241 and $0.274. With no clear structural supports defined below the current price from the provided levels, a clean break back under the trendline pivot near $0.157 would expose XLM to fresh downside exploration until a new demand floor is established on the chart.
(The technical analysis of this story was written with the help of an AI tool.)













