

Top Altcoins Price Forecast: Ripple, Cardano, Dogecoin – Downside risk looms amid market uncertainties
- Ripple edges higher to $1.30 on Thursday, supported by its 50-day EMA at $1.28.
- Cardano holds near the short-term support trendline, with bulls attempting to reclaim the 50-day EMA at $0.1994.
- Dogecoin hovers around $0.0800, facing downside risks as momentum shifts bearish.
Top altcoins, including Ripple (XRP), Cardano (ADA), and Dogecoin (DOGE), face imminent downside risk as prevailing upside momentum recedes toward neutral. The broader market uncertainties linked to the CLARITY Act failing to advance to the US Senate floor for a cloture vote and the US Federal Reserve raising interest rates by 25 basis points to the 3.75%-4% range weigh on crypto 'investors' demand. The technical outlook for XRP, ADA, and DOGE is bearish, with the immediate support levels at risk as upside momentum weakens.

Ripple under stress with CLARITY Act delay
Ripple trades around $1.30 at press time on Thursday, holding steady after a 10% drop on Tuesday. This double-digit loss was linked to the delay in the CLARITY Act, which could have catalyzed institutional adoption of XRP by potentially granting it "Commodity" status.
Still, XRP holds a neutral near-term tone, consolidating above the 50-day and 100-day Exponential Moving Averages (EMAs) at $1.2844 and $1.2561, but remains capped below the longer-term 200-day EMA at $1.3818. In addition, the 50% retracement level of the latest swing from $0.9888 to $0.1699 at $1.2964 reinforces the underlying demand zone.
A confirmed breakout below the 100-day EMA at $1.2561 could signal a demand-zone breakout, positioning the 23.6% Fibonacci retracement level at $1.1236 as the next level where traders could buy the dip.
The Moving Average Convergence Divergence (MACD) remains below its signal line on the daily chart, inching closer to zero as the bearish profile widens, indicating renewed downside pressure. At the same time, the Relative Strength Index (RSI) hovers near 47, hinting at fading bullish momentum.
On the topside, initial resistance emerges at the 200-day EMA at 1.3818, with a subsequent barrier at the 78.6% Fibonacci retracement near $1.5137.
Cardano near key support trendline risks a bearish breakout
Cardano trades below $0.20 at press time on Thursday, stalling after Tuesday's 6% decline. ADA has bounced modestly off the rising trendline at $0.1936 but remains bearish in the near term, trading below the 50-, 100-, and 200-day EMAs at $0.1994, $0.2001, and $0.2436, respectively.
The MACD and signal line decline toward the negative territory, indicating a bearish shift in momentum, while the RSI at 46 slips below the midline, hinting at a soft momentum backdrop.
Cardano must reclaim the overhead resistance cluster of the 50-day EMA at $0.1994 and the 50% retracement level at $0.1999, measured over the downswing from $0.2887 to $0.1385. A confirmed breakout above this region could open the path toward the 200-day EMA near $0.2436, which capped gains on August 22.
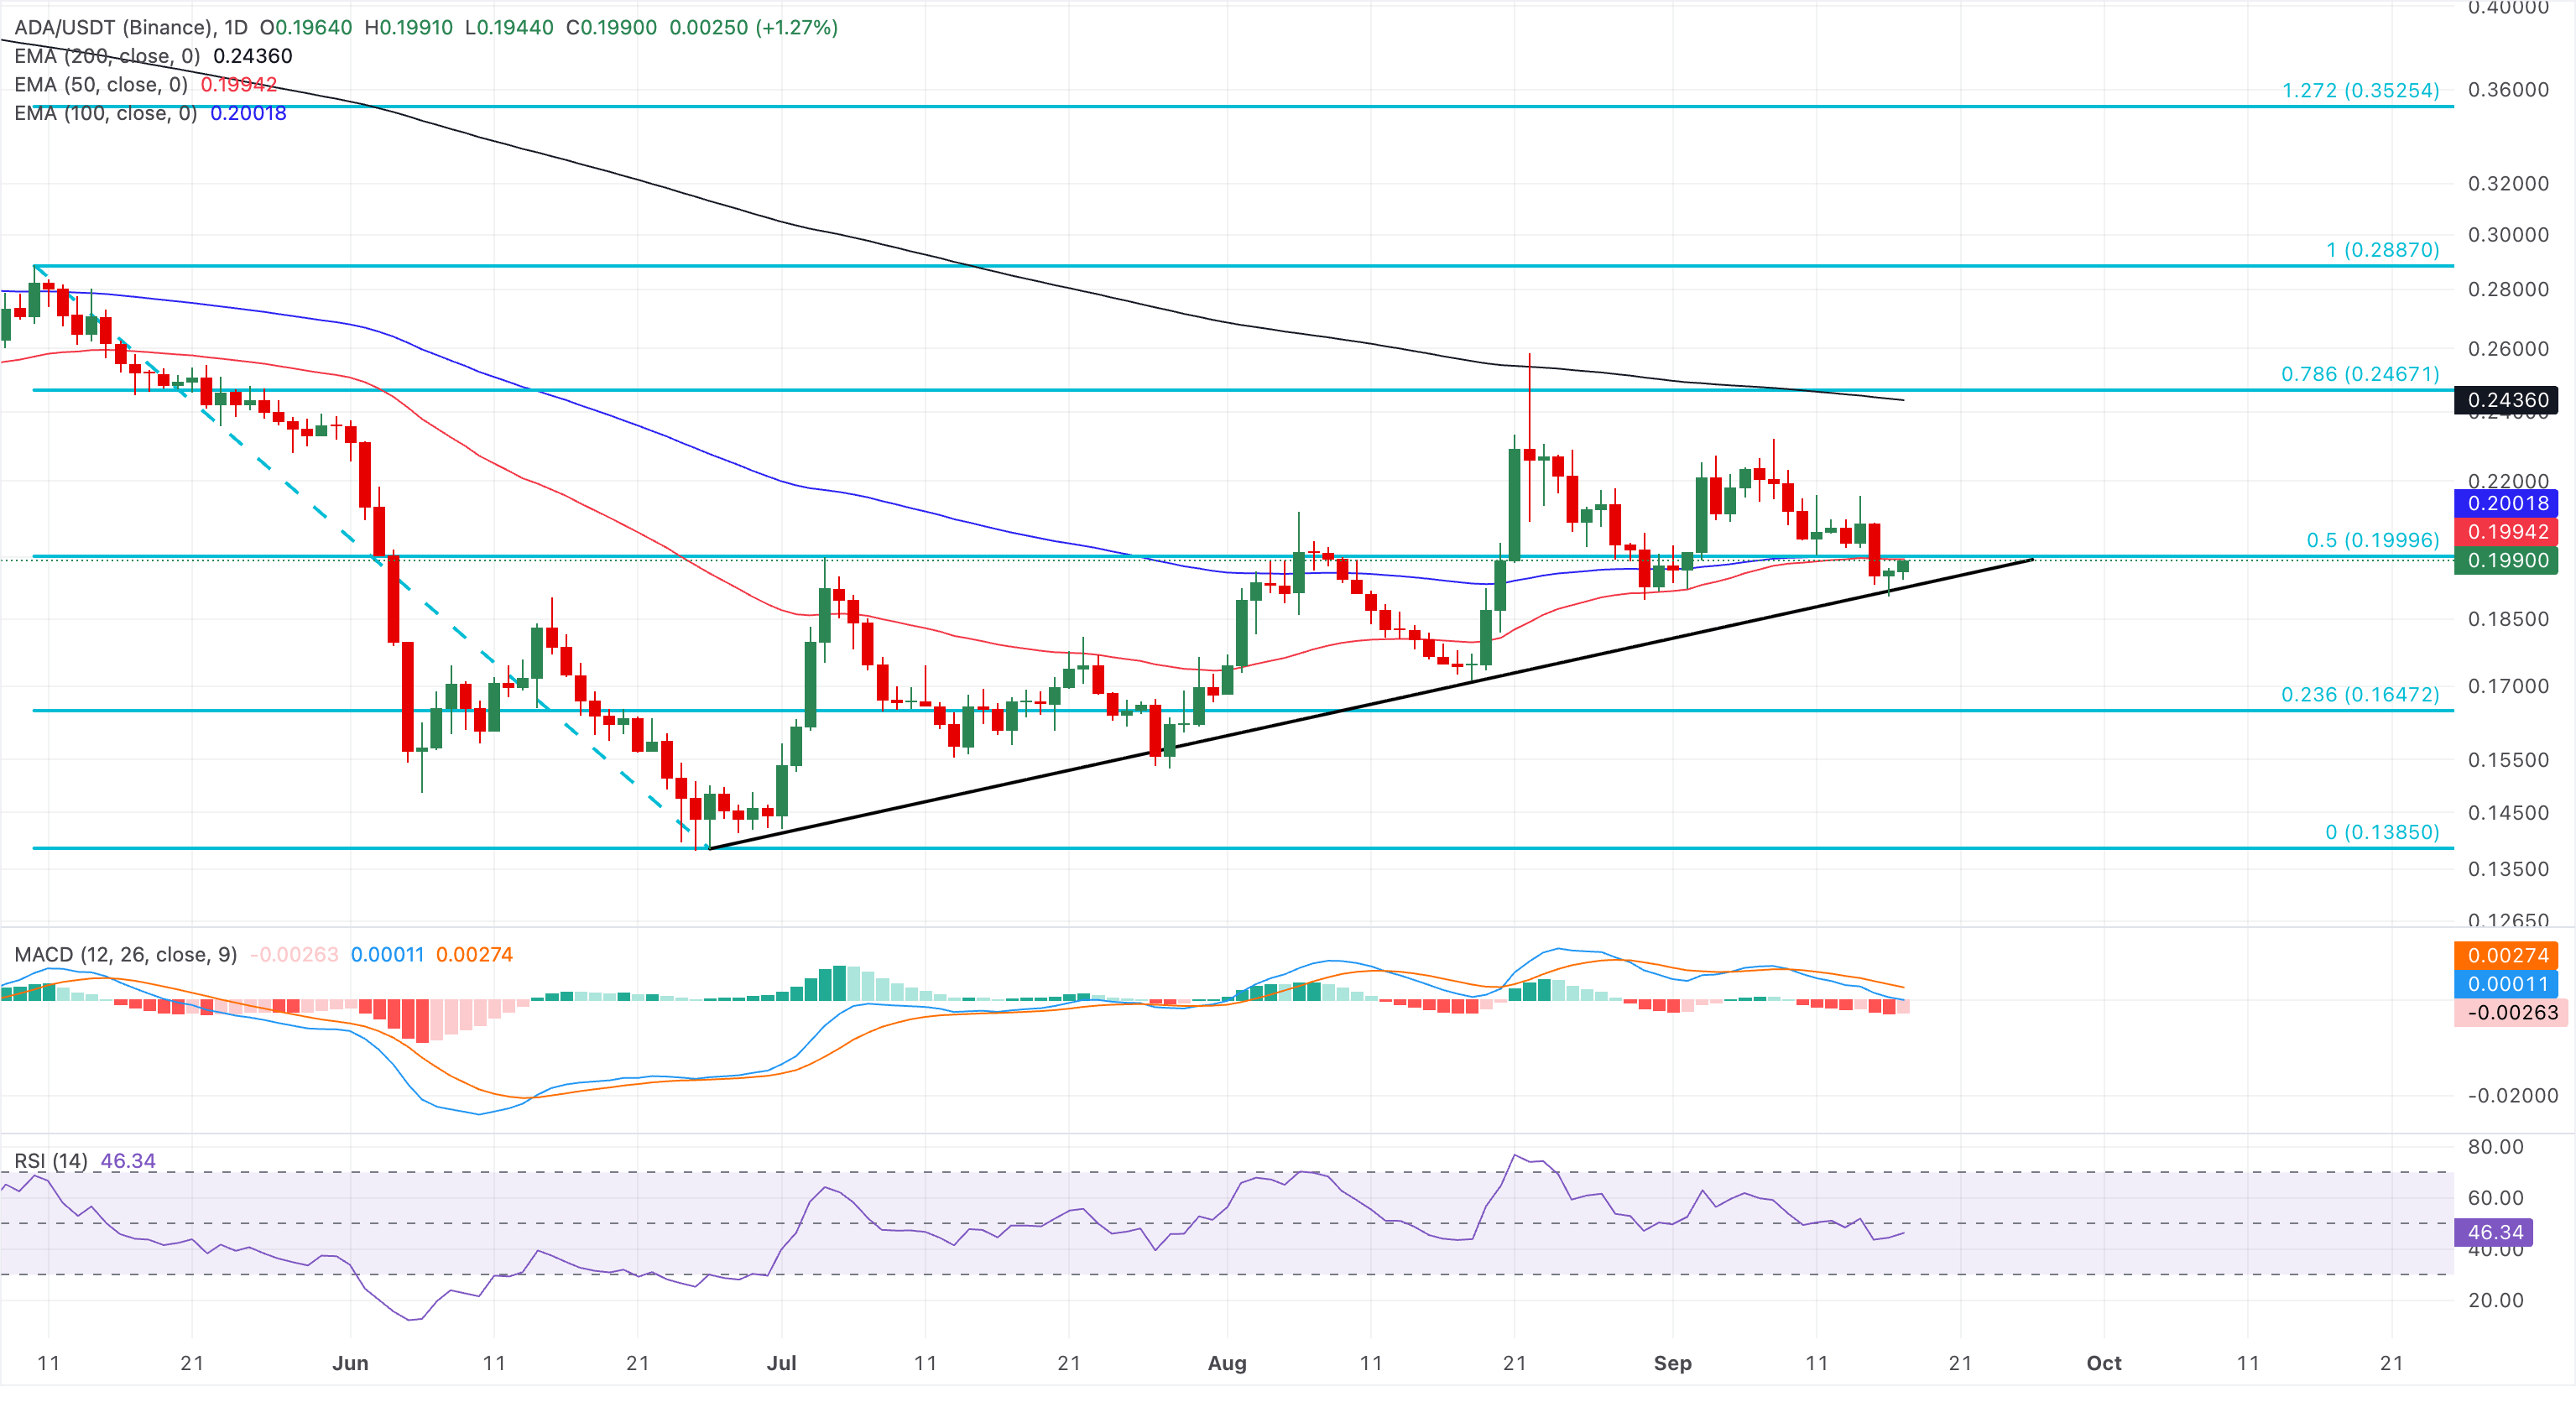
On the downside, immediate support aligns with the rising trendline near $0.1936, followed by the 23.6% Fibonacci retracement level at $0.1647.
Dogecoin below crucial EMAs risks extended weakness
Dogecoin sustains above $0.0800 on Thursday but maintains a bearish near-term bias. The meme coin trades below a tight band between the 50- and 100-day EMAs, at $0.08152 and $0.08254, suggesting that rallies are being capped by short- and medium-term trend resistance. Meanwhile, the longer-term 200-day EMA at $0.09400 reinforces the broader topside lid.
Momentum is subdued, with the RSI near 46 and sloping below the midline, while the MACD and signal line are approaching the negative zone, suggesting that downside pressure remains persistent.
Dogecoin must surpass the 50-day and 100-day EMAs at $0.08152 and $0.08254 for a sustained recovery toward the overhead resistance trendline near $0.08800. Beyond this, the 200-day EMA at $0.09400 serves as the long-term resistance guarding the upside to the $0.1000 psychological level.
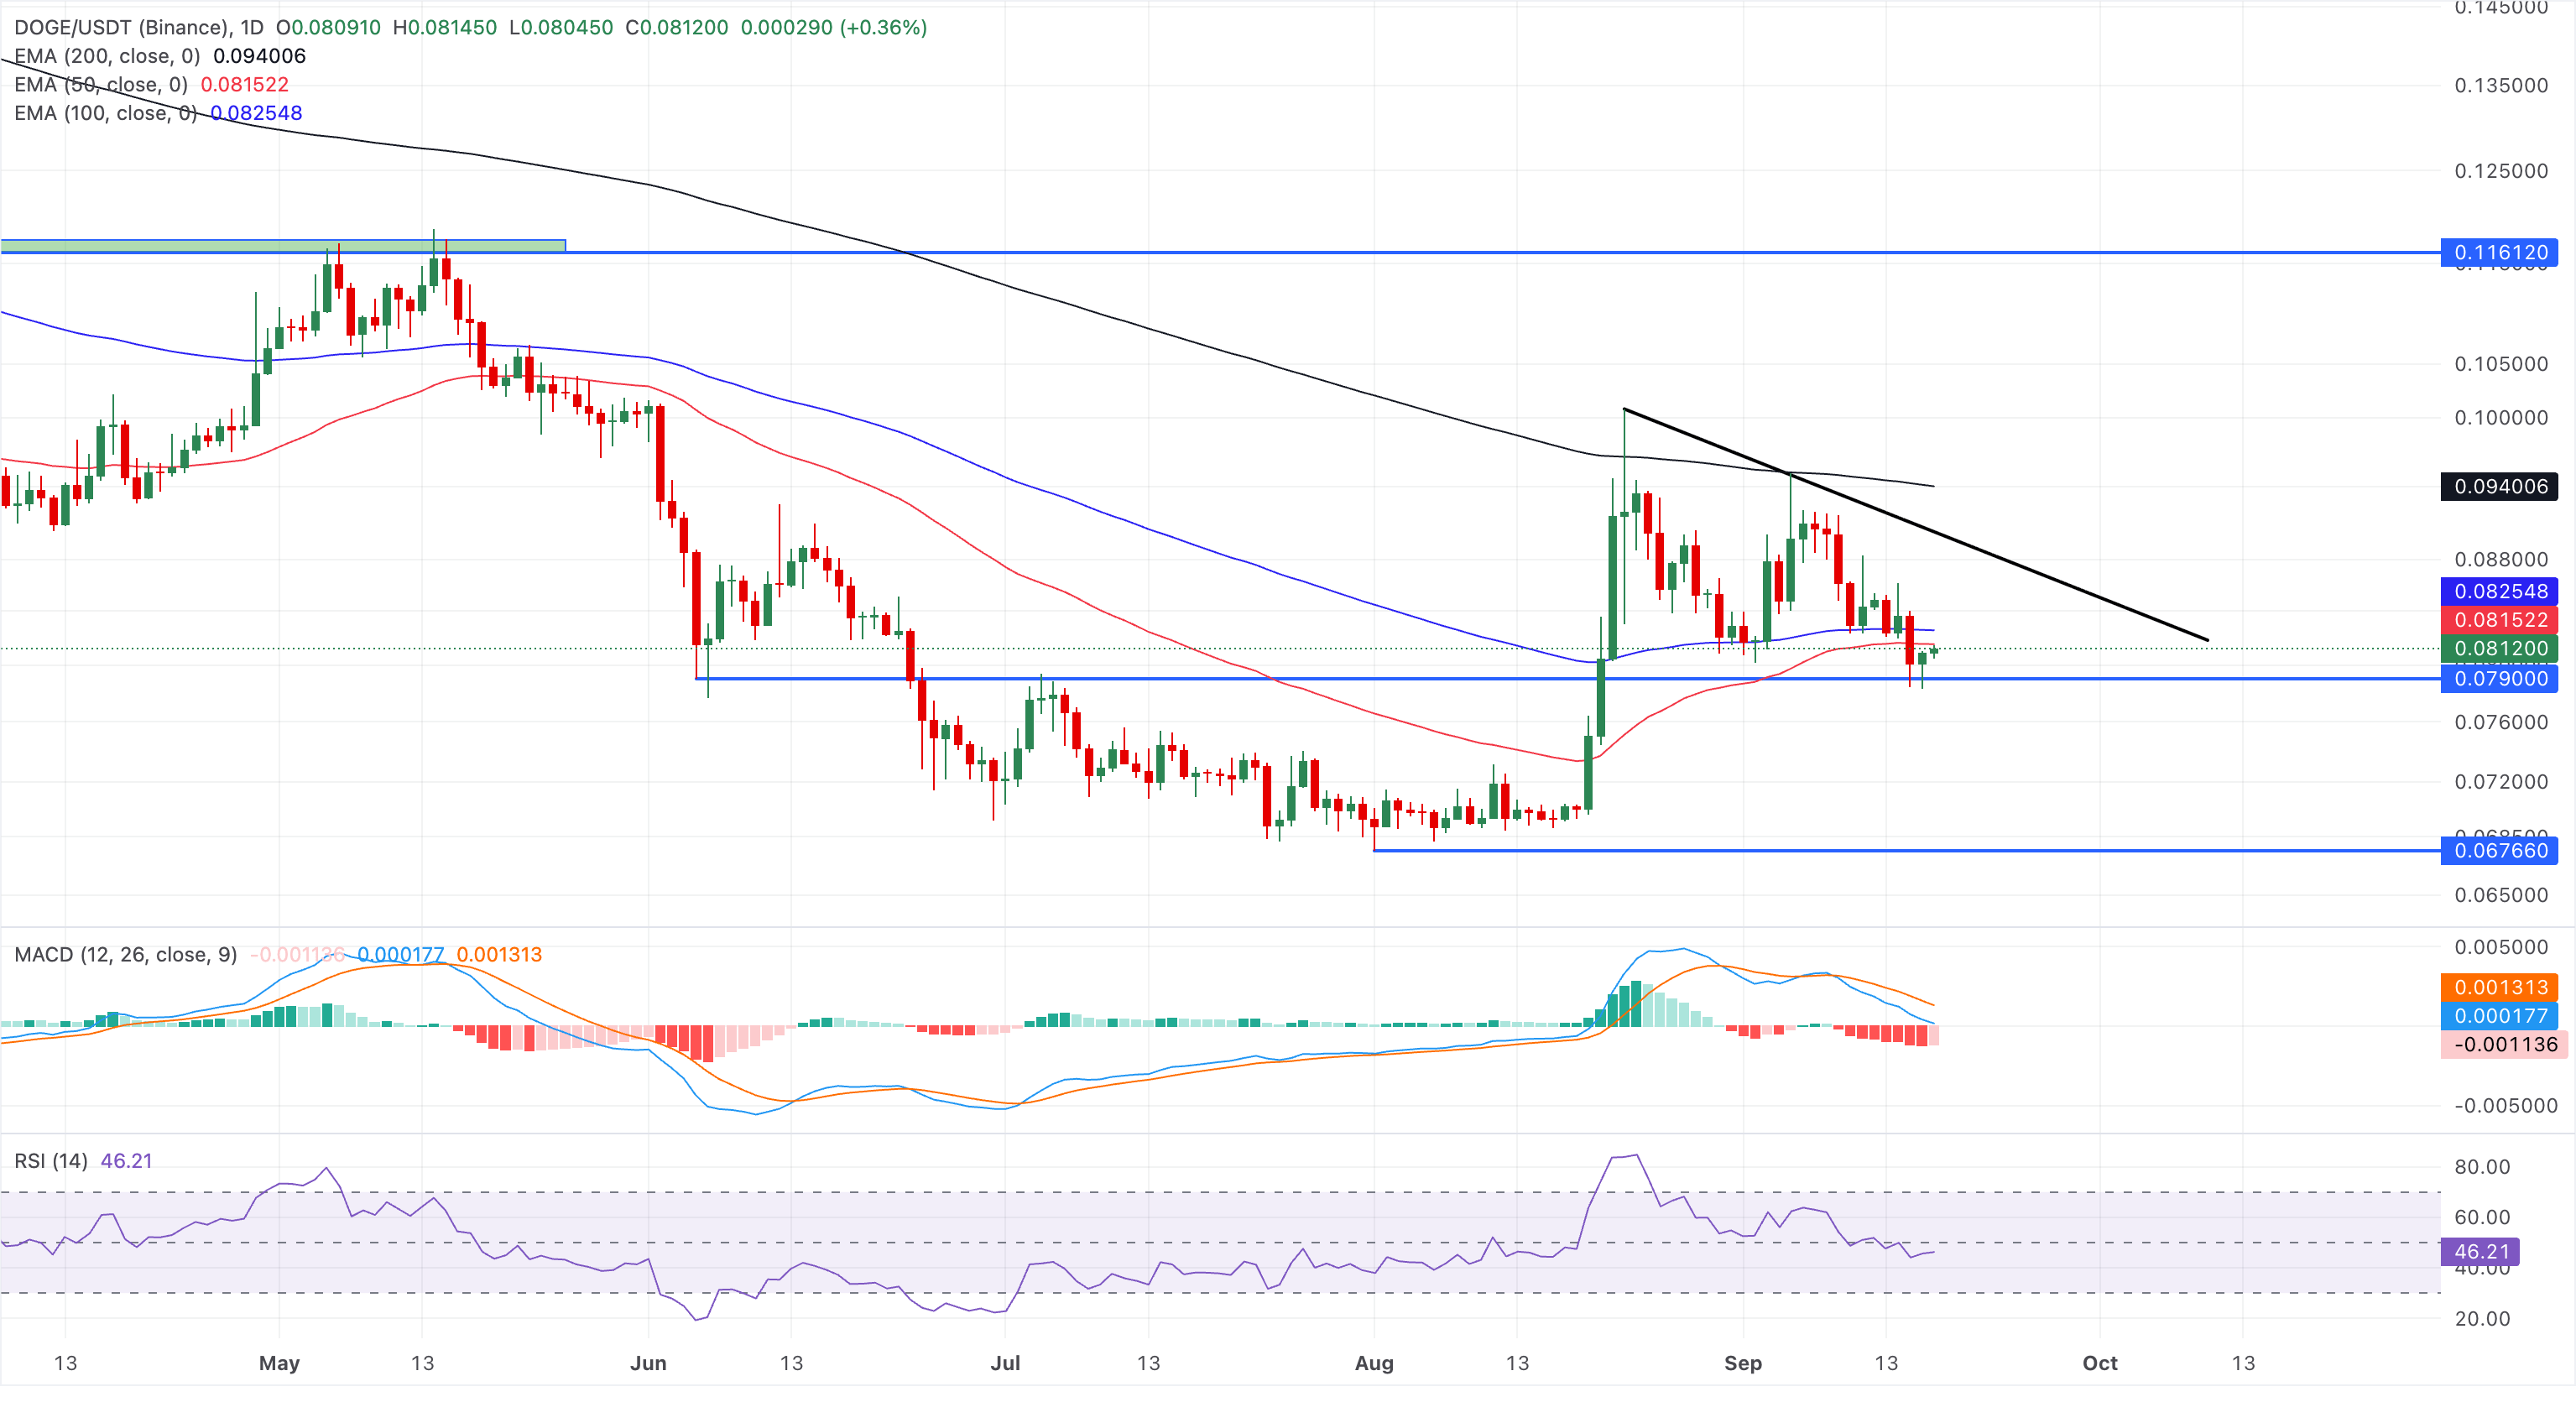
On the flip side, a confirmed breakout below the June 6 low of $0.07900 could signal a steeper correction toward the August 1 low of $0.06766.
(The technical analysis of this story was written with the help of an AI tool. Know more.)














