Reversal Candlestick Patterns
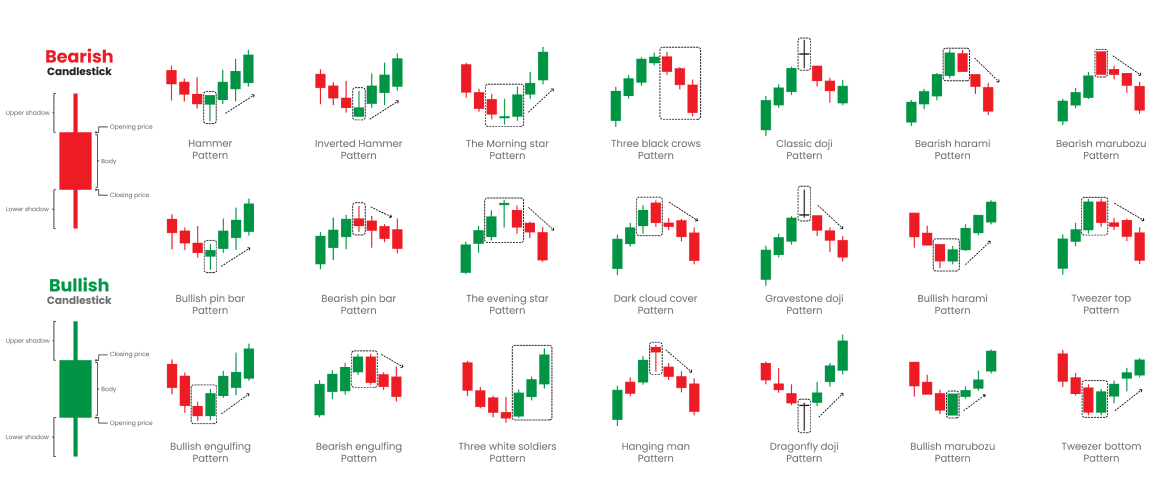
What is Price Action? A Quick Overview
Before diving into reverse candlesticks, it's important to grasp the basics of price action. Price action is the study of historical prices to identify patterns and make trading decisions.
Unlike other forms of analysis that rely on indicators or algorithms, price action focuses purely on the price itself. This approach is particularly popular among traders using platforms like TMGM, where a direct understanding of the market's movements can give you a strategic edge.
Reverse Candlesticks: Your Key to Market Reversals
Reverse candlesticks are specific patterns within price action that indicate a potential reversal in market direction. These patterns are formed when a bullish or bearish trend begins to lose momentum, and a shift in the opposite direction is likely to occur.
Recognizing these patterns can be particularly advantageous when trading on TMGM, as they offer early warning signs that allow you to adjust your strategy accordingly.
Key Reverse Candlestick Patterns
Doji Candlestick
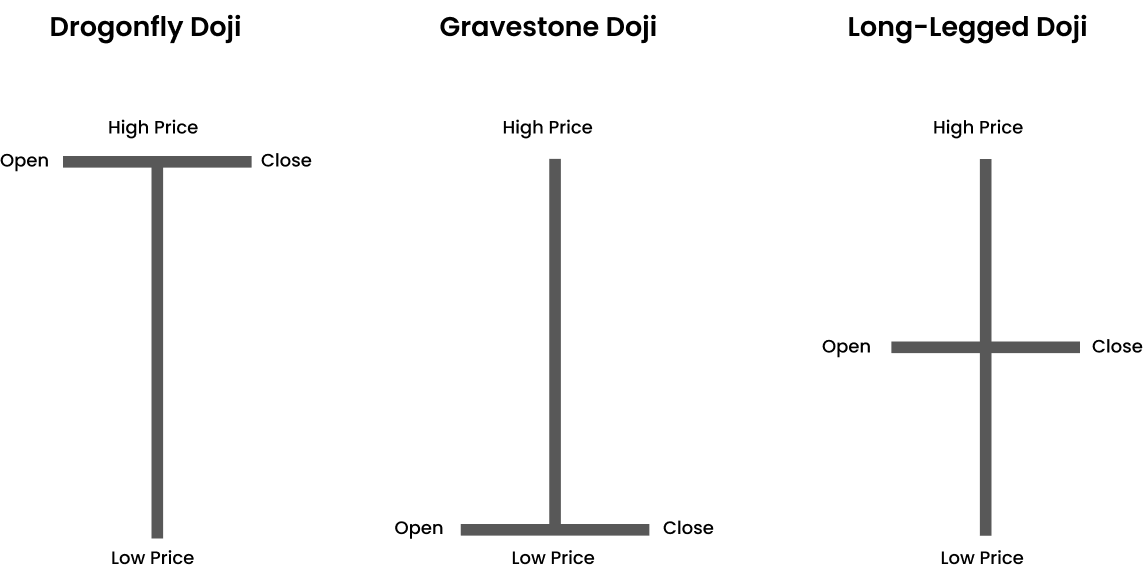
The Doji is a common reverse candlestick pattern that occurs when the open and close prices are almost identical, signaling indecision in the market. On TMGM, spotting a Doji after a strong trend may indicate a potential reversal.
Hammer and Inverted Hammer
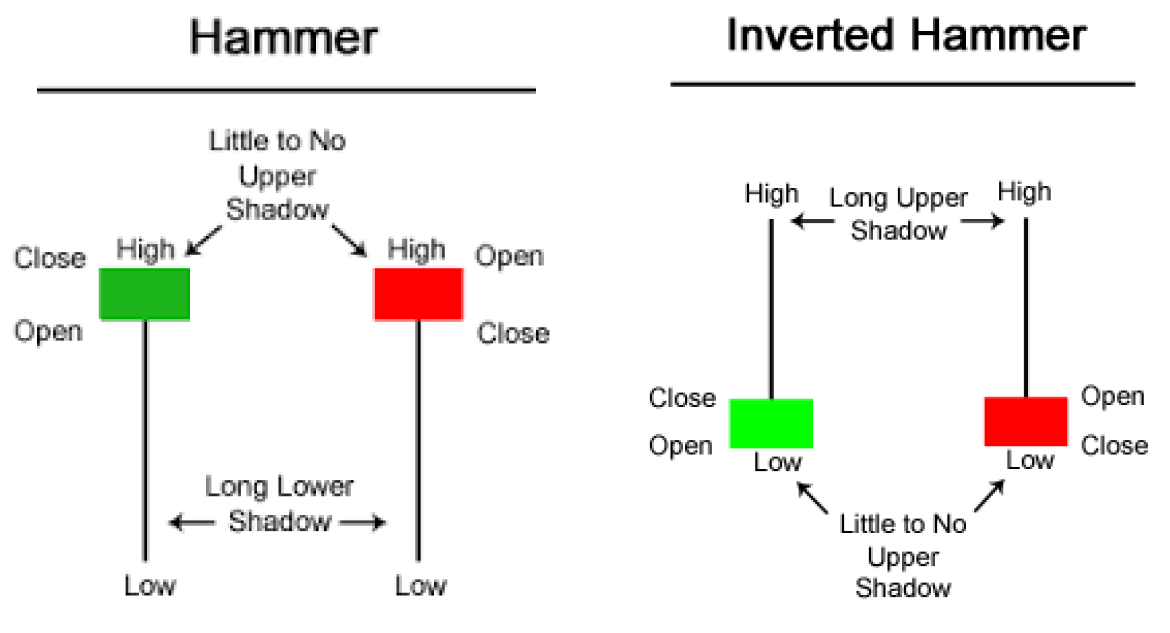
Source: Commodity.com
These patterns are characterized by a small body and a long lower or upper wick. A Hammer forms after a downtrend, suggesting a potential bullish reversal, while an Inverted Hammer appears after an uptrend, signaling a possible bearish reversal. Recognizing these on the TMGM platform can help you anticipate shifts in price action.
Engulfing Candlestick
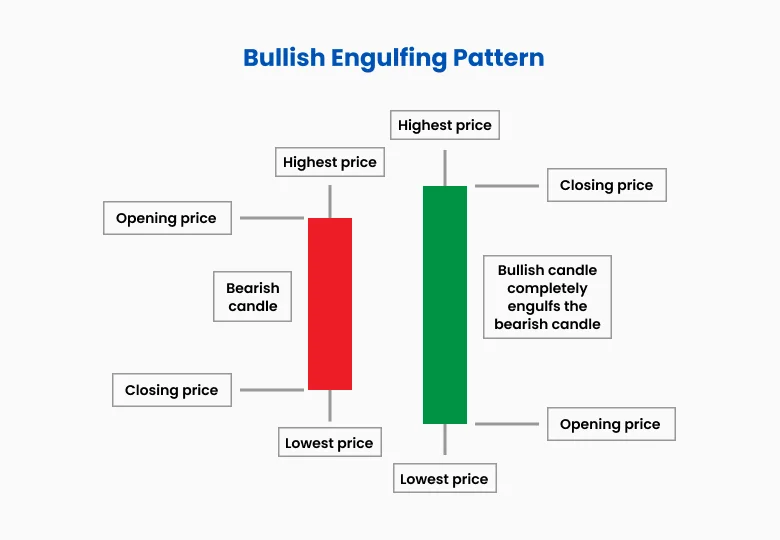
An Engulfing pattern occurs when a small candle is followed by a larger candle that completely "engulfs" the previous one. A Bullish Engulfing pattern after a downtrend can indicate the beginning of an upward trend, while a Bearish Engulfing pattern after an uptrend can suggest a downturn is imminent.
How to Trade Reverse Candlesticks on TMGM : A Step-by-Step Guide
Step 1: Monitor Price Action Closely
To effectively trade reverse candlesticks on TMGM, closely monitor your chosen asset's price action. Look for signs of exhaustion in the current trend, which often precedes a reversal. Understanding price action becomes crucial here, as it allows you to identify potential entry and exit points with greater accuracy.
Step 2: Identify Reverse Candlestick Patterns
Once you've established a baseline for the price action, start looking for reverse candlestick patterns. Whether it's a Doji, Hammer, or Engulfing pattern, these formations can signal that a reversal is likely. On TMGM, you can use advanced charting tools to spot these patterns in real-time, ensuring you’re always one step ahead of the market.
Step 3: Confirm the Signal
Before making a trade based on a reverse candlestick pattern, confirming the signal is essential. This can be done by looking at additional price action indicators, such as support and resistance levels, or by observing the volume to see if it aligns with the reversal signal. TMGM's platform offers various tools to help you validate these patterns before taking action.
Step 4: Execute Your Trade
Once you’ve confirmed the reversal signal, executing your trade is time-consuming. Whether you’re entering a new position or exiting an existing one, use TMGM’s order execution features to set up stop-losses and take-profit levels, effectively managing your risk.
Trading Safely with TMGM
When trading on TMGM, it’s important to ensure that your strategies comply with regulations set by major authorities such as the EU and the Australian Securities and Investments Commission (ASIC).
Understanding price action and reverse candlesticks can help you make informed decisions that comply with these regulations. Additionally, to protect your capital, always employ risk management techniques, such as setting stop-loss orders and limiting exposure.
Leveraging Price Action and Reverse Candlesticks on TMGM
Mastering price action, especially through the lens of reverse candlestick patterns, can significantly enhance your trading performance on TMGM. By understanding and identifying these key patterns, you’ll be better equipped to anticipate market reversals and make strategic trades. As with all trading strategies, continuous learning and practice are essential, so take the time to refine your skills and explore the powerful tools available on TMGM.
Check More Neutral Candlestick Patterns
Neutral Pattern | Features |
|---|
Doji Pattern | The doji is a single candle that opens and closes at or near the same price, which shows indecision between buyers and sellers. 1. The body is very small or appears as a thin line. 2. The upper and lower shadows can be any length. 3. A doji after a strong trend can warn of a reversal, and traders wait for the next candle to confirm the reversal. |
Pin Bar Pattern | The pin bar is a single-candle reversal pattern that can be bullish or bearish. 1. The candle has a small body at one end of its range. 2. One long shadow, called the tail, makes up most of the candle range. 3. A bullish pin bar has a long lower shadow, and a bearish pin bar has a long upper shadow. |
Marubozu Pattern | The marubozu is a single candle with a long body that shows strong buying or strong selling. 1. The candle has a long body. 2. The candle has no upper or lower shadow, or only very small shadows. 3. A bullish marubozu opens at the low and closes at the high, and a bearish marubozu opens at the high and closes at the low. |
Harami Pattern | The harami is a two-candle reversal pattern that can be bullish or bearish. 1. The first candle is a large candle. 2. The second candle is a small candle with a body that sits completely inside the body of the first candle. 3. A bullish harami forms after a downtrend, and a bearish harami forms after an uptrend. |
Engulfing Pattern | The engulfing is a two-candle reversal pattern that can be bullish or bearish. 1. The first candle is a small candle. 2. The second candle is a larger candle of the opposite colour, with a body that completely engulfs the body of the first candle. 3. A bullish engulfing forms after a downtrend, and a bearish engulfing forms after an uptrend. |
Inside Bar Pattern | The inside bar is a two-candle pattern that can signal a continuation or a reversal. 1. The first candle is a large candle, often called the mother bar. 2. The second candle has a high and low that stay inside the high and low of the first candle. 3. Traders trade the breakout above the high or below the low of the first candle. |
Morning Star and Evening Star Pattern | The morning star and evening star are three-candle reversal patterns, one bullish and one bearish. 1. The first candle is a long candle in the direction of the existing trend. 2. The second candle is a small-bodied candle that can be bullish or bearish. 3. The third candle is a long candle in the opposite direction that closes past the midpoint (50%) of the first candle body. 4. A morning star forms after a downtrend, and an evening star forms after an uptrend. |
Check More Bearish Candlestick Patterns
Bearish Pattern | Features |
|---|
Hanging Man Pattern | The hanging man is a single-candle bearish reversal pattern that forms at the top of an uptrend. 1. The candle has a small body at the top of its range. 2. The lower shadow is at least twice the length of the body. 3. The candle has little or no upper shadow. |
Shooting Star Pattern | The shooting star is a single-candle bearish reversal pattern that forms after an uptrend. 1. The candle has a small body at the bottom of its range. 2. The upper shadow is at least twice the length of the body. 3. The candle has little or no lower shadow. |
Bearish Engulfing Pattern | The bearish engulfing is a two-candle bearish reversal pattern that forms after an uptrend. 1. The first candle is a small bullish candle. 2. The second candle is a larger bearish candle with a body that completely engulfs the body of the first candle. |
Bearish Harami Pattern | The bearish harami is a two-candle bearish reversal pattern that forms after an uptrend. 1. The first candle is a large bullish candle. 2. The second candle is a small candle, usually bearish, with a body that sits completely inside the body of the first candle. |
Dark Cloud Cover Pattern | Dark cloud cover is a two-candle bearish reversal pattern that forms after an uptrend. 1. The first candle is a long bullish candle. 2. The second candle is a bearish candle that opens above the close of the first candle. 3. The second candle closes below the midpoint (50%) of the first candle body. |
Tweezer Top Pattern | The tweezer top is a two-candle bearish reversal pattern that forms at the end of an uptrend. 1. The first candle is a bullish candle. 2. The second candle is a bearish candle. 3. Both candles have the same, or nearly the same, high. |
Evening Star Pattern | The evening star is a three-candle bearish reversal pattern that forms after an uptrend. 1. The first candle is a long bullish candle. 2. The second candle is a small-bodied candle that can be bullish or bearish. 3. The third candle is a long bearish candle that closes below the midpoint (50%) of the first candle body. |
Three Black Crows Pattern | Three black crows is a three-candle bearish reversal pattern that forms after an uptrend. 1. Three long bearish candles with small shadows form in a row. 2. Each candle opens inside the body of the previous candle. 3. Each candle closes lower than the previous candle. |
Check More Bullish Candlestick Patterns
Bullish Pattern | Features |
|---|
Hammer Pattern | The hammer is a single-candle bullish reversal pattern that forms after a downtrend. 1. The candle has a small body at the top of its range. 2. The lower shadow is at least twice the length of the body. 3. The candle has little or no upper shadow. |
Inverted Hammer Pattern | The inverted hammer is a single-candle bullish reversal pattern that forms after a downtrend. 1. The candle has a small body at the bottom of its range. 2. The upper shadow is at least twice the length of the body. 3. The candle has little or no lower shadow. |
Dragonfly Doji Pattern | The dragonfly doji is a single-candle bullish reversal pattern that forms at the bottom of a downtrend. 1. The open and close are at or near the high of the candle. 2. The candle has a long lower shadow. 3. The candle has little or no upper shadow. |
Bullish Engulfing Pattern | The bullish engulfing is a two-candle bullish reversal pattern that forms after a downtrend. 1. The first candle is a small bearish candle. 2. The second candle is a larger bullish candle with a body that completely engulfs the body of the first candle. |
Bullish Harami Pattern | The bullish harami is a two-candle bullish reversal pattern that forms after a downtrend. 1. The first candle is a large bearish candle. 2. The second candle is a small candle, usually bullish, with a body that sits completely inside the body of the first candle. |
Piercing Line Pattern | The piercing line is a two-candle bullish reversal pattern that forms after a downtrend. 1. The first candle is a long bearish candle. 2. The second candle is a bullish candle that opens below the close of the first candle. 3. The second candle closes above the midpoint (50%) of the first candle body. |
Bullish Kicker Pattern | The bullish kicker is a two-candle bullish reversal pattern that shows a sudden change from selling to buying. 1. The first candle is a bearish candle. 2. The second candle is a bullish candle that gaps up and opens at or above the open of the first candle. 3. The bodies of the two candles do not overlap. |
Tweezer Bottom Pattern | The tweezer bottom is a two-candle bullish reversal pattern that forms at the end of a downtrend. 1. The first candle is a bearish candle. 2. The second candle is a bullish candle. 3. Both candles have the same, or nearly the same, low. |
Morning Star Pattern | The morning star is a three-candle bullish reversal pattern that forms after a downtrend. 1. The first candle is a long bearish candle. 2. The second candle is a small-bodied candle that can be bullish or bearish. 3. The third candle is a long bullish candle that closes above the midpoint (50%) of the first candle body. |
Bullish Abandoned Baby Pattern | The bullish abandoned baby is a three-candle bullish reversal pattern that forms after a downtrend. 1. The first candle is a long bearish candle. 2. The second candle is a doji that gaps down below the first candle. 3. The third candle is a long bullish candle that gaps up above the doji. |
Three White Soldiers Pattern | Three white soldiers is a three-candle bullish reversal pattern that forms after a downtrend. 1. Three long bullish candles with small shadows form in a row. 2. Each candle opens inside the body of the previous candle. 3. Each candle closes higher than the previous candle. |
Three Inside Up Pattern | The three inside up is a three-candle bullish reversal pattern that forms after a downtrend. 1. The first candle is a large bearish candle. 2. The second candle is a small bullish candle that stays inside the first candle body and closes above the midpoint (50%) of the first candle body. 3. The third candle is a bullish candle that closes above the open of the first candle. |
Three Outside Up Pattern | The three outside up is a three-candle bullish reversal pattern that forms after a downtrend. 1. The first candle is a bearish candle. 2. The second candle is a bullish candle with a body that completely engulfs the body of the first candle. 3. The third candle is a bullish candle that closes above the close of the second candle. |