

Trading
Explore a wide range of markets with competitive pricing, deep liquidity, and advanced trading tools.
Learn More 
Platform
Trade seamlessly with TMGM's powerful platform, built for speed, precision, and a superior trading experience.
Learn More Trading Platform
Academy
Learn the fundamentals of trading with beginner-friendly resources, including guides, webinars, and market insights.
Learn More News & Analysis
Get real-time market updates and expert analysis to stay ahead of trading opportunities
Learn More News & Analysis
About
Learn what sets TMGM apart — our global presence, regulatory strength, and commitment to innovation in trading.
Learn More Why Choose TMGM
Sponsorship
Crypto Today: Bitcoin, Ethereum, XRP fall despite net ETF inflows
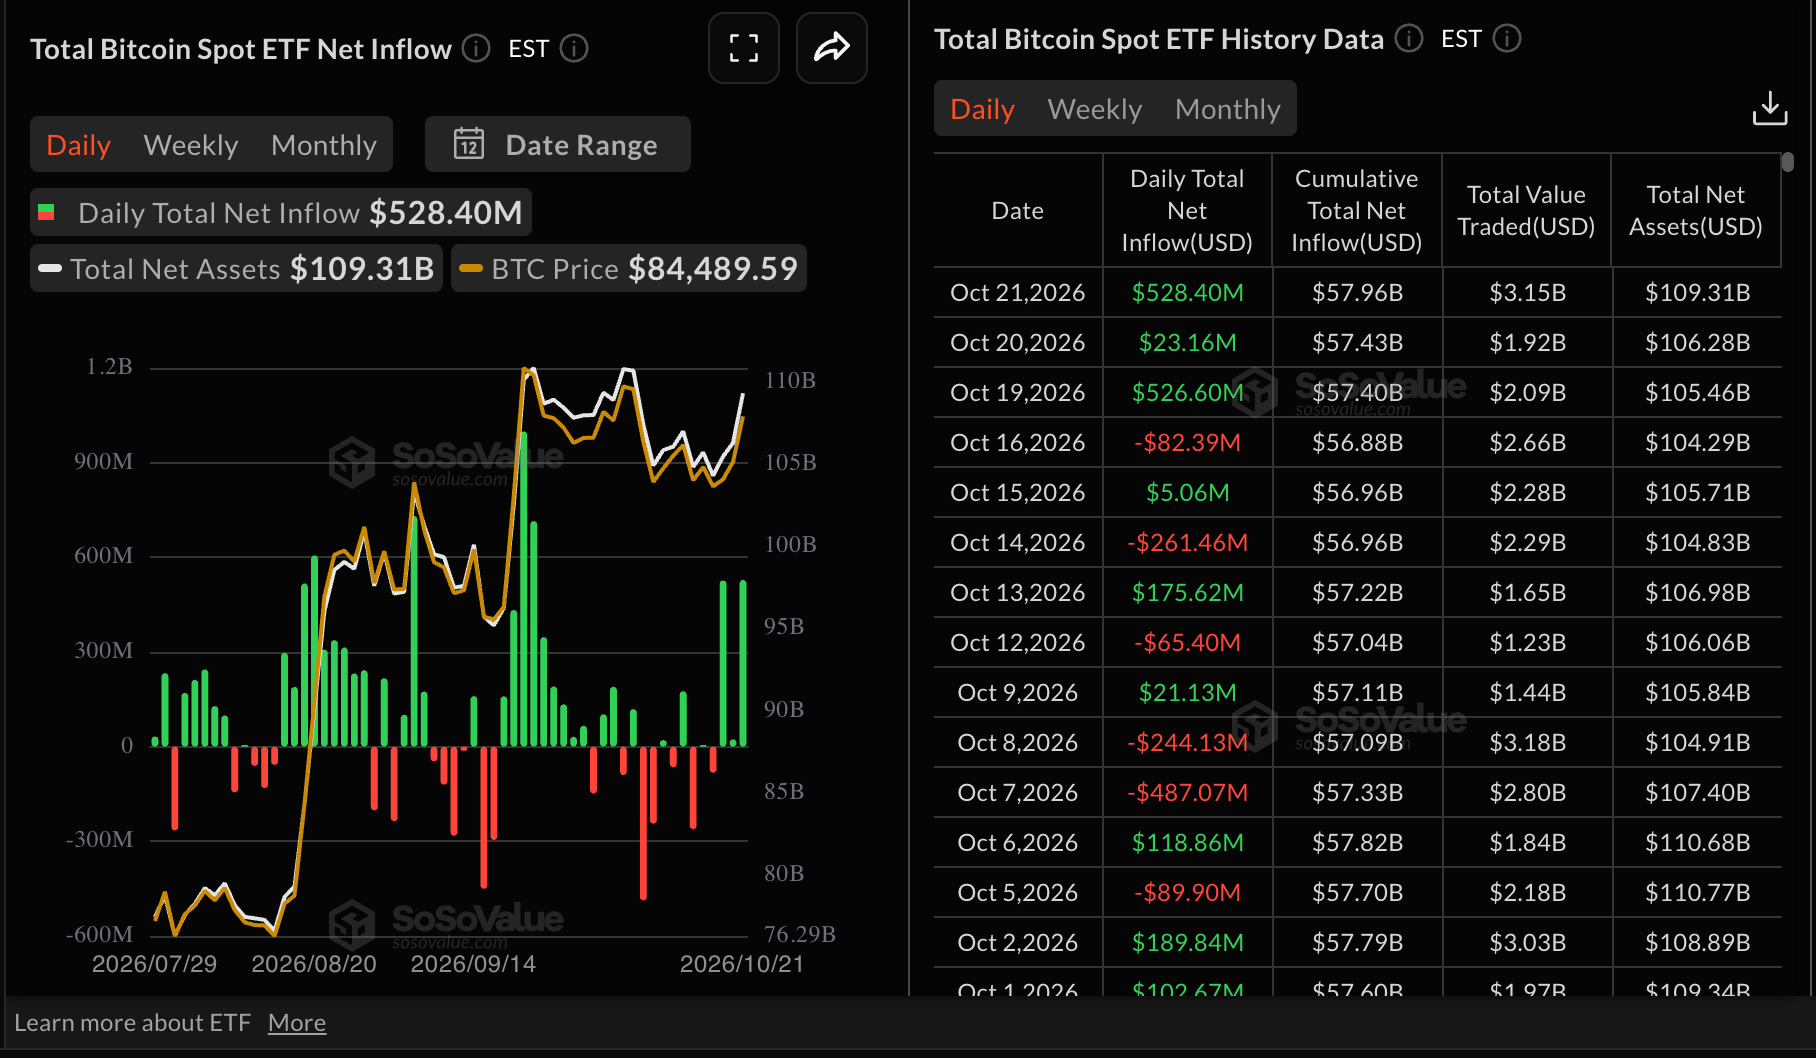
- Bitcoin declines near the $80,000-$82,000 support range as notable $528 million ETF inflows fail to absorb sell-side pressure.
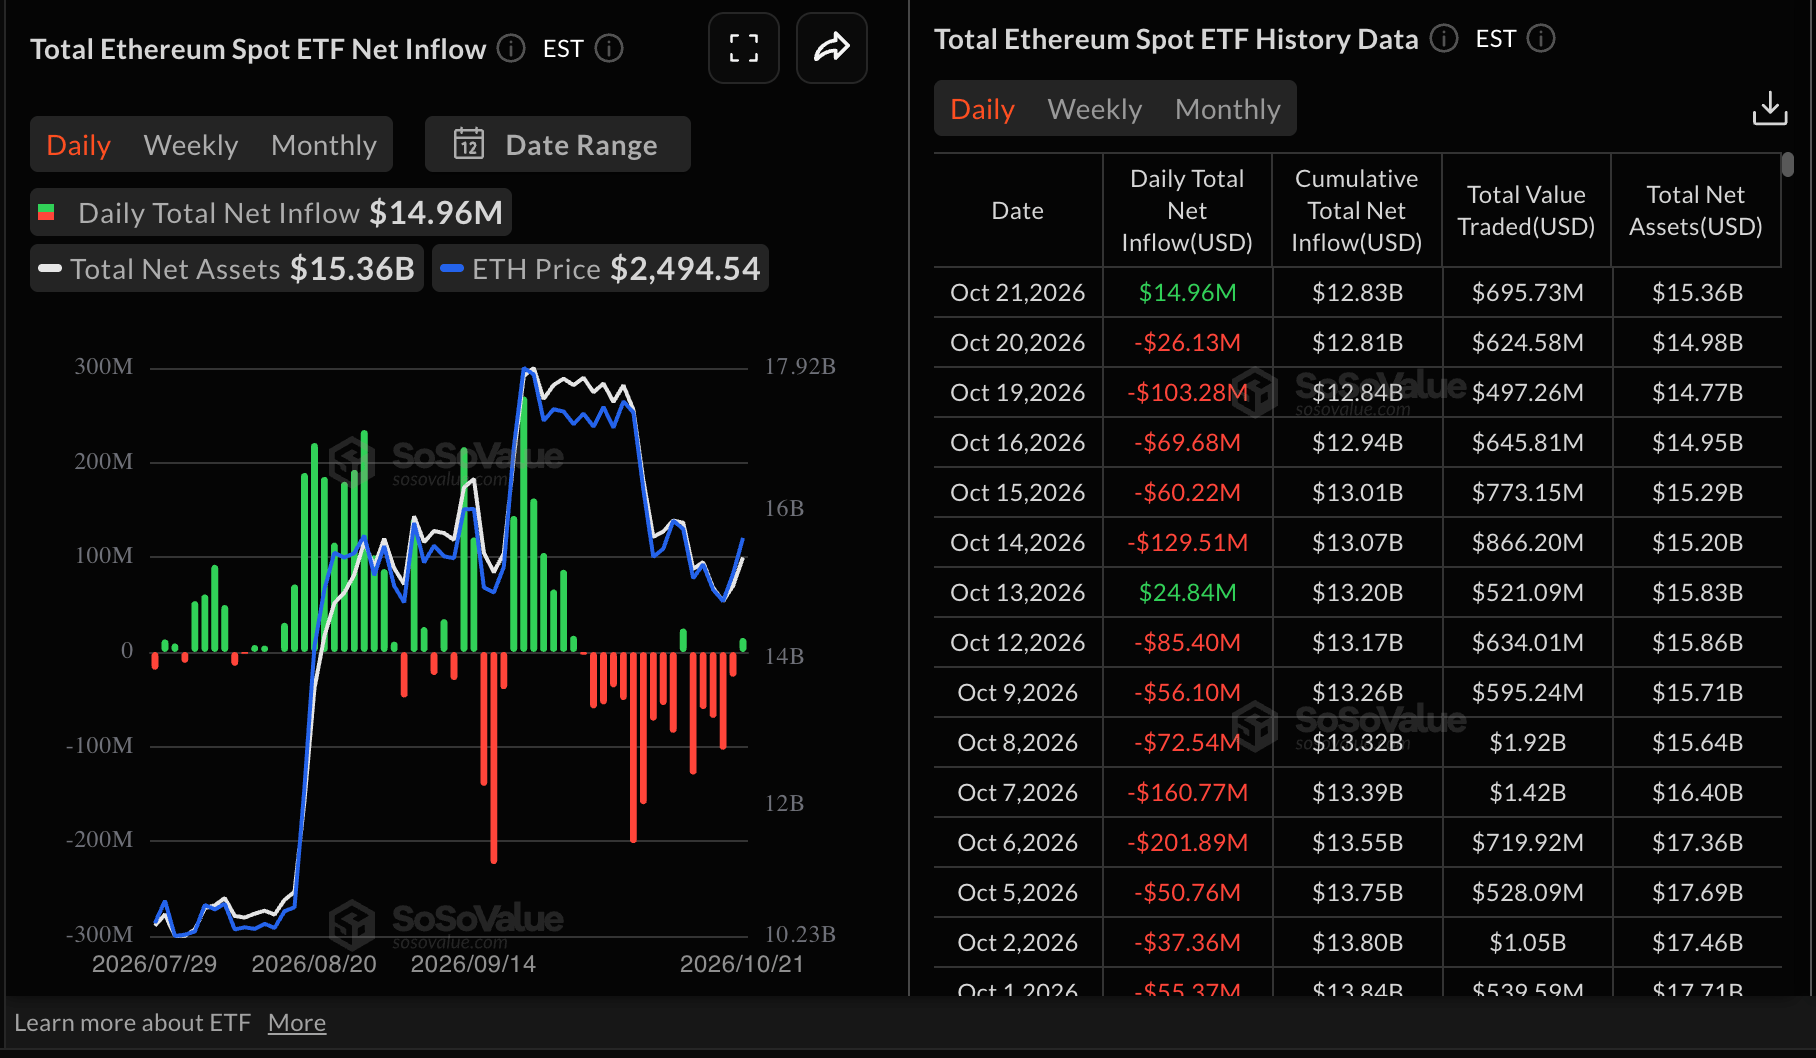
- Ethereum slips toward $2,400 as sellers return, seeking trend control despite returning ETF inflows.
- XRP slides below the 100-day EMA as bears stage a comeback targeting lows below $1.30.
Bitcoin (BTC) trades around $82,000 on Thursday, leading a broader cryptocurrency market correction. Early-week attempts to sustain recovery after testing support near $80,000 failed to breach the $84,000 hurdle, triggering the ongoing pullback amid buyer exhaustion.

Ethereum (ETH) mirrors Bitcoin’s dimmed outlook, sliding near $2,400. Meanwhile, Ripple’s (XRP) decline toward $1.30 reinforces the generally weak technical structure, raising the odds of a persistent sell-off.
ETFs attract inflows as headwinds persist
Appetite for digital asset investment products remains elevated despite the volatility, as evidenced by the uptake of Bitcoin spot Exchange-Traded Funds (ETFs) this week. Approximately $528 million in inflows was recorded on Wednesday, up from $23 million on Tuesday. So far, cumulative inflows this week stand at $1 billion through Wednesday, helping to cushion against selling pressure.
Ethereum spot ETFs similarly posted inflows, totaling $15 million on Wednesday. The comeback, albeit subtle, broke a five-day bearish streak with outflows of $26 million the previous day and $105 million on Monday. Across October, outflows stand at roughly $1 billion, according to SoSoValue.
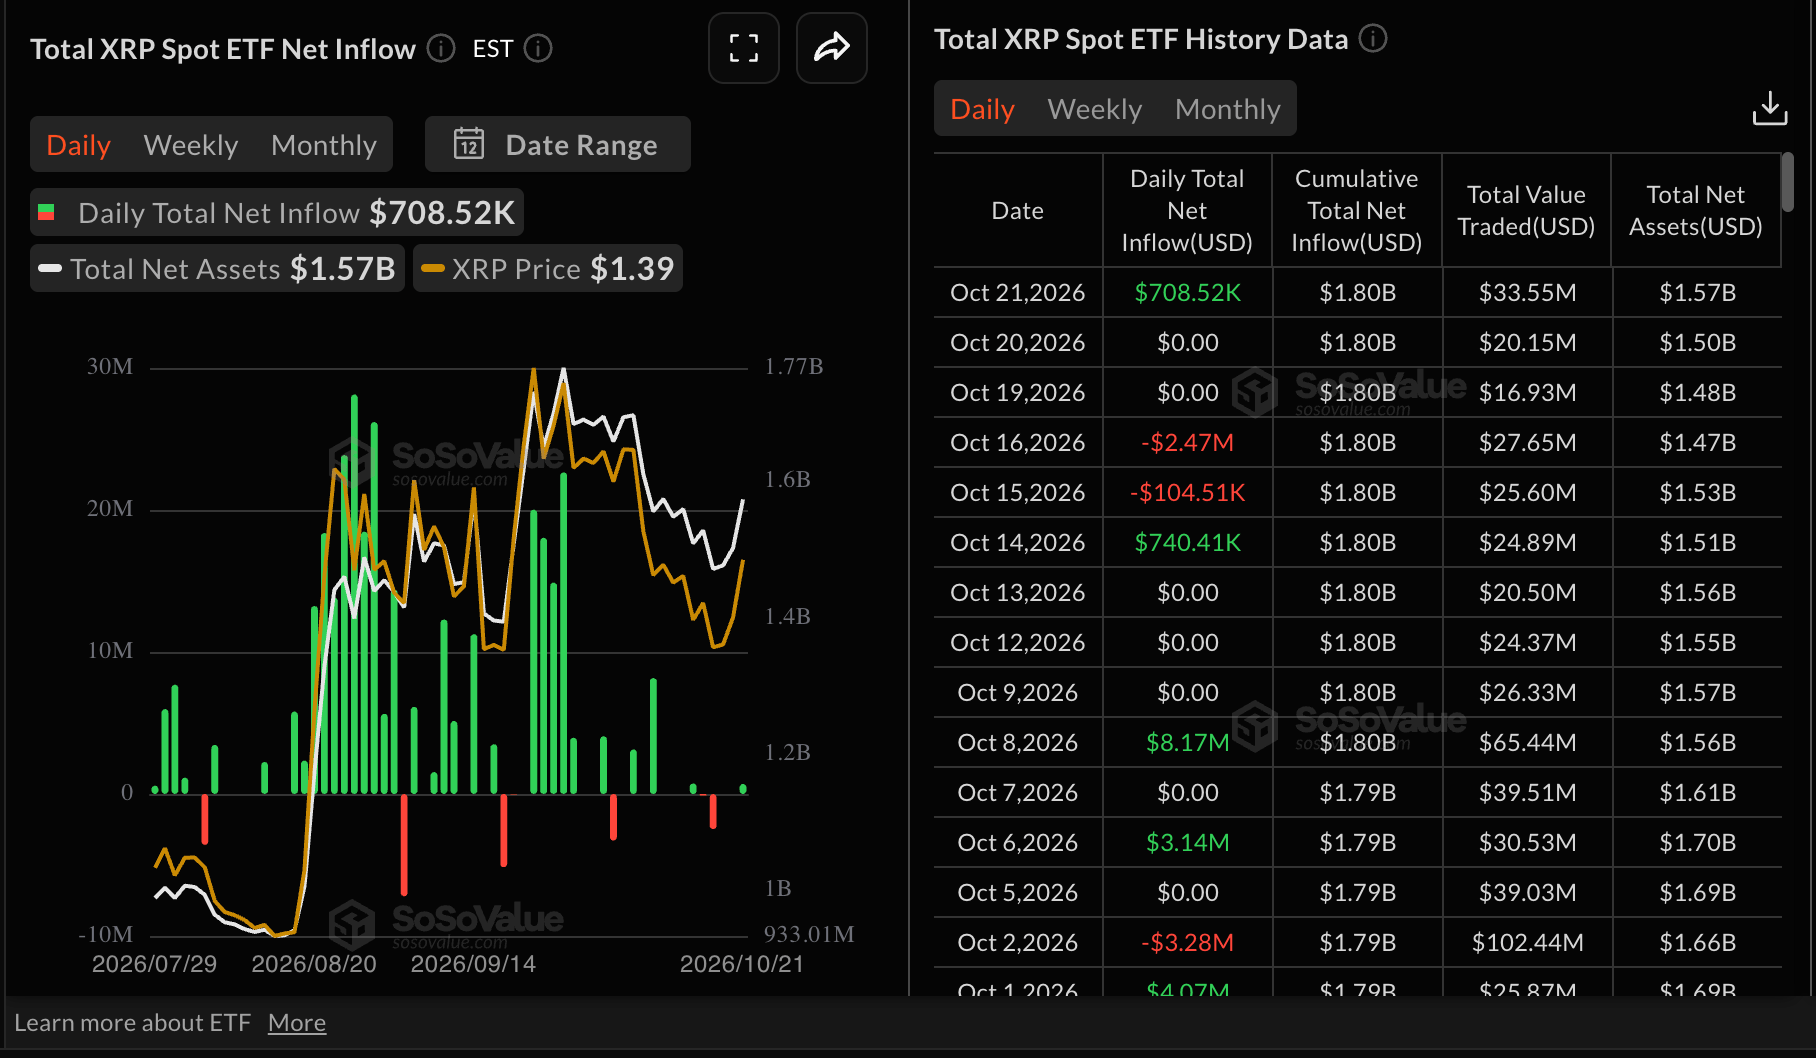
As for XRP spot ETFs, volatility continues to rock the market, defined by muted activity, outflows and mild inflows. Approximately $709,000 in inflows was recorded on Wednesday, following two consecutive days of muted activity. If inflows remain steady in the coming weeks, they could ease broader selling pressure, allowing XRP to consolidate ahead of another recovery attempt.
Technical analysis: Bitcoin slides as sell-side pressure intensifies
Bitcoin trades lower near $82,000 as overhead pressure increases in the broader crypto market. Despite the ongoing correction, BTC maintains a constructive bullish bias, holding comfortably above key Exponential Moving Averages, while the SuperTrend line at about $79,664 adds dynamic support.
However, momentum has cooled, with the Relative Strength Index (RSI) hovering near 48 and the Moving Average Convergence Divergence (MACD) in negative territory, suggesting upside impulses are losing strength even as the broader structure remains supported.
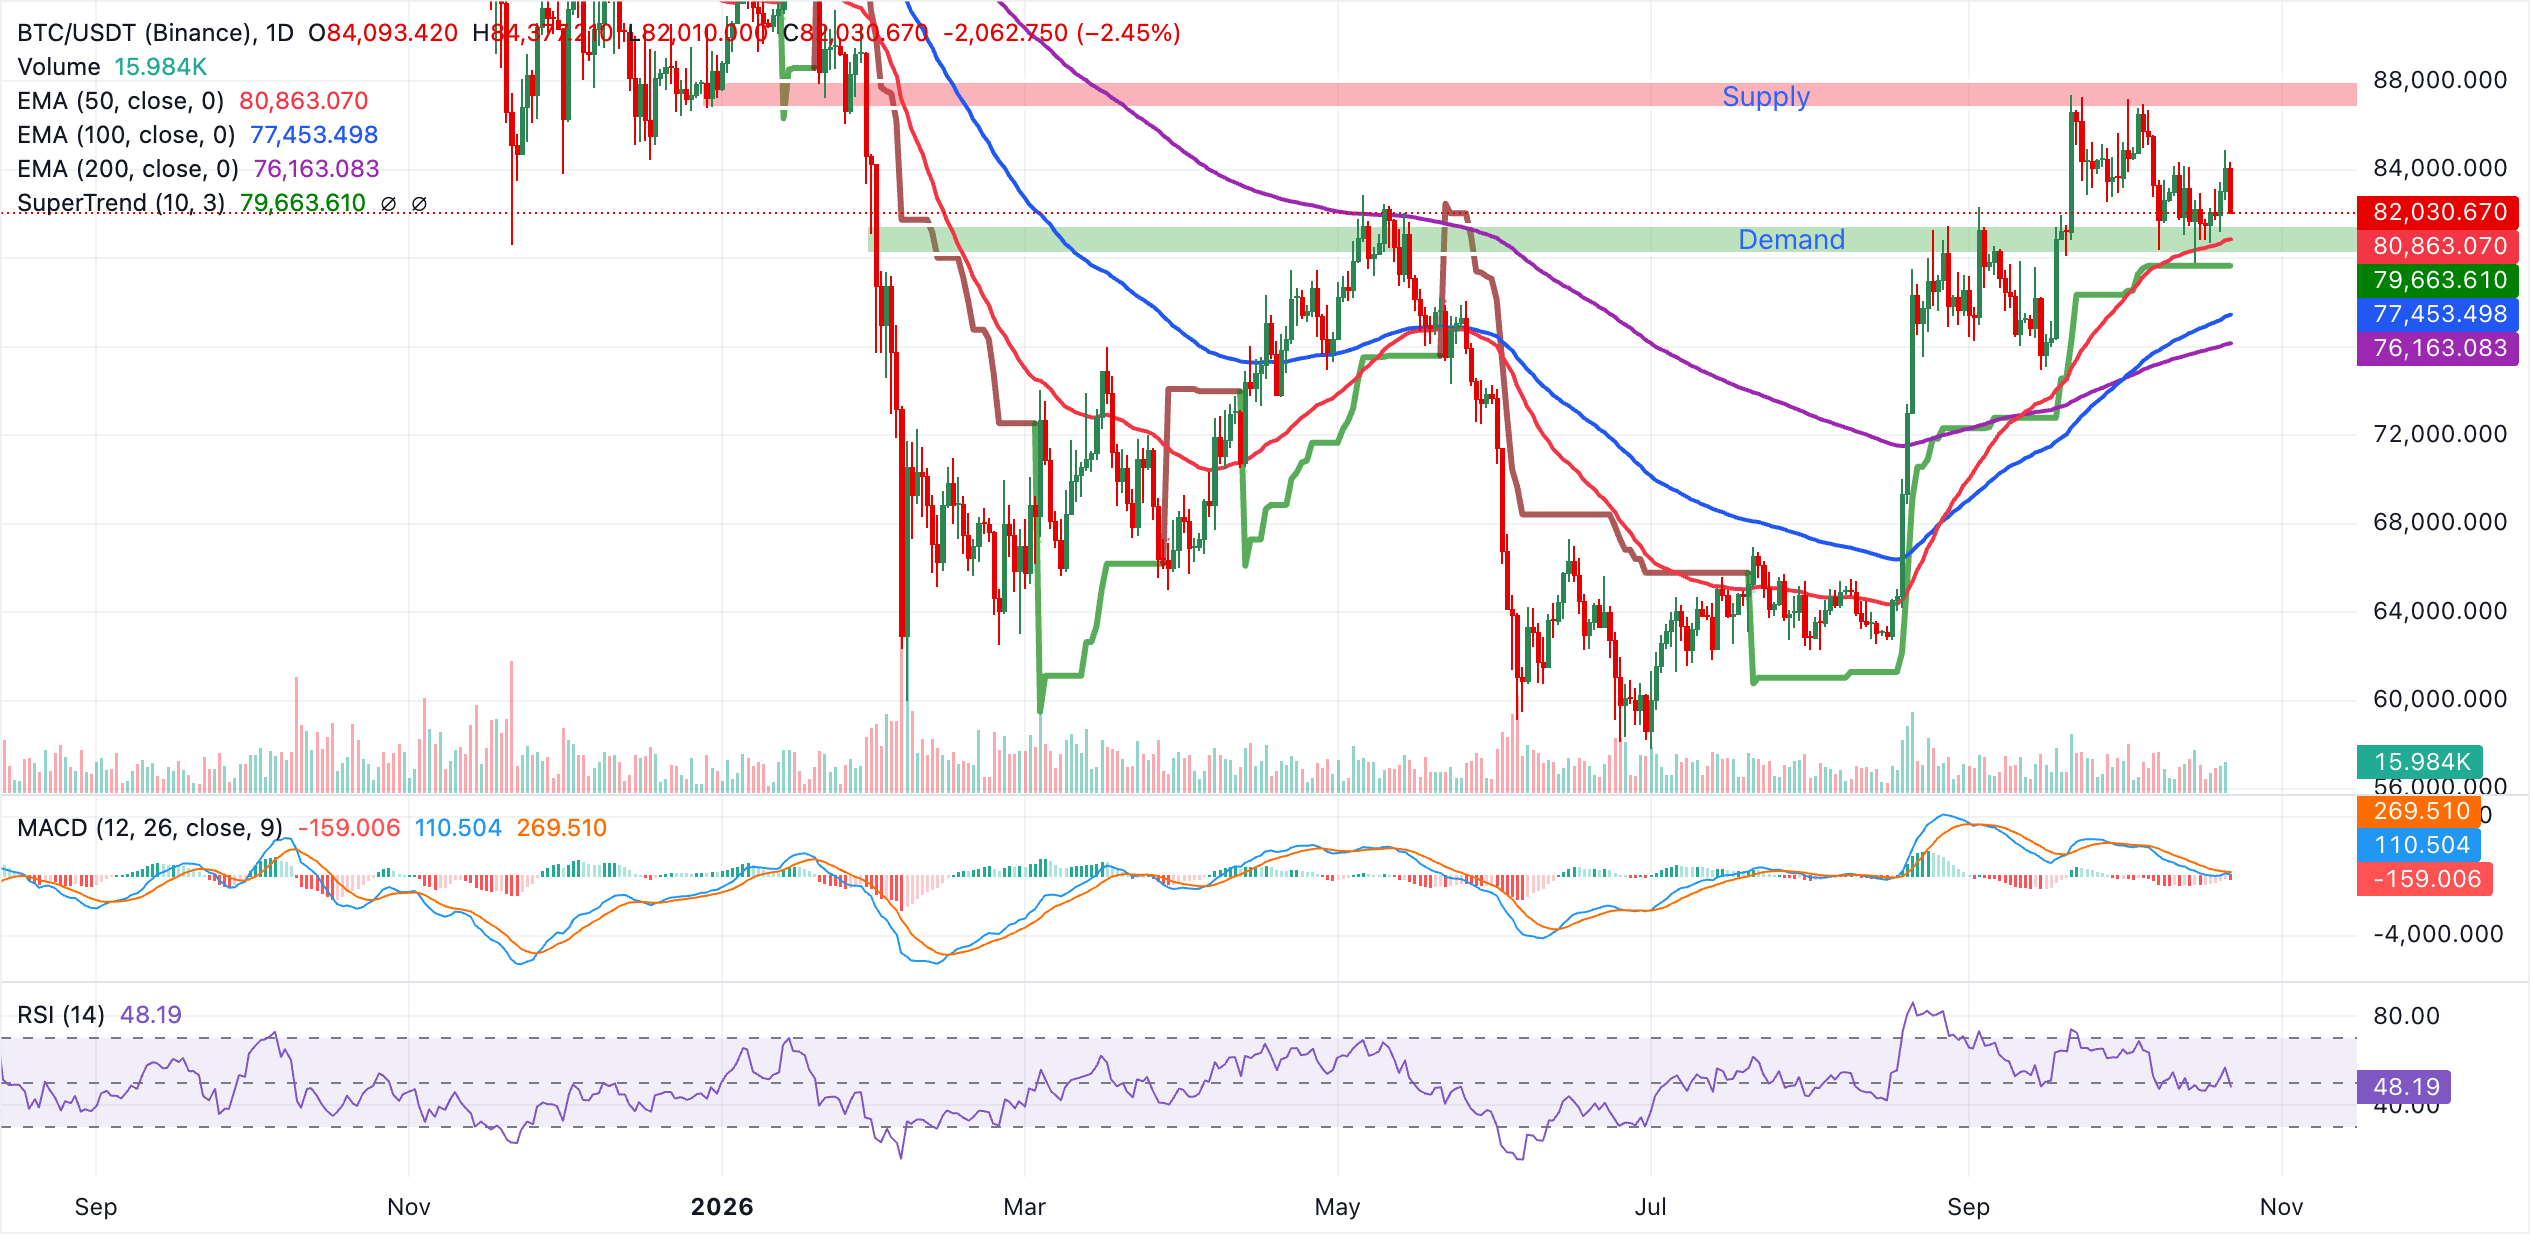
Initial support is seen at the 50-day EMA around $80,863, where a daily close below would expose the SuperTrend zone near $79,664 as the next demand area. A deeper slide could then target the 100-day EMA at roughly $77,453 ahead of the longer-term 200-day EMA near $76,163, where buyers would be expected to defend the broader bullish structure. As long as price holds above these clustered moving averages, pullbacks are likely to be treated as corrective within the prevailing uptrend.
Altcoins technical outlook: Ethereum and XRP bears fight to retain control
Ethereum edges lower toward $2,400, hovering between its key moving averages and leaving the near-term bias neutral to slightly bearish. Price holds above the 100-day and 200-day EMAs at roughly $2,365 and $2,318, which suggests underlying medium-term support, but it remains capped below the 50-day EMA near $2,479 and the SuperTrend line around $2,676.
The RSI near 40 points to subdued buying pressure, while the MACD stays in negative territory with a shallow bearish profile, hinting at waning downside momentum rather than a clear bullish turn.
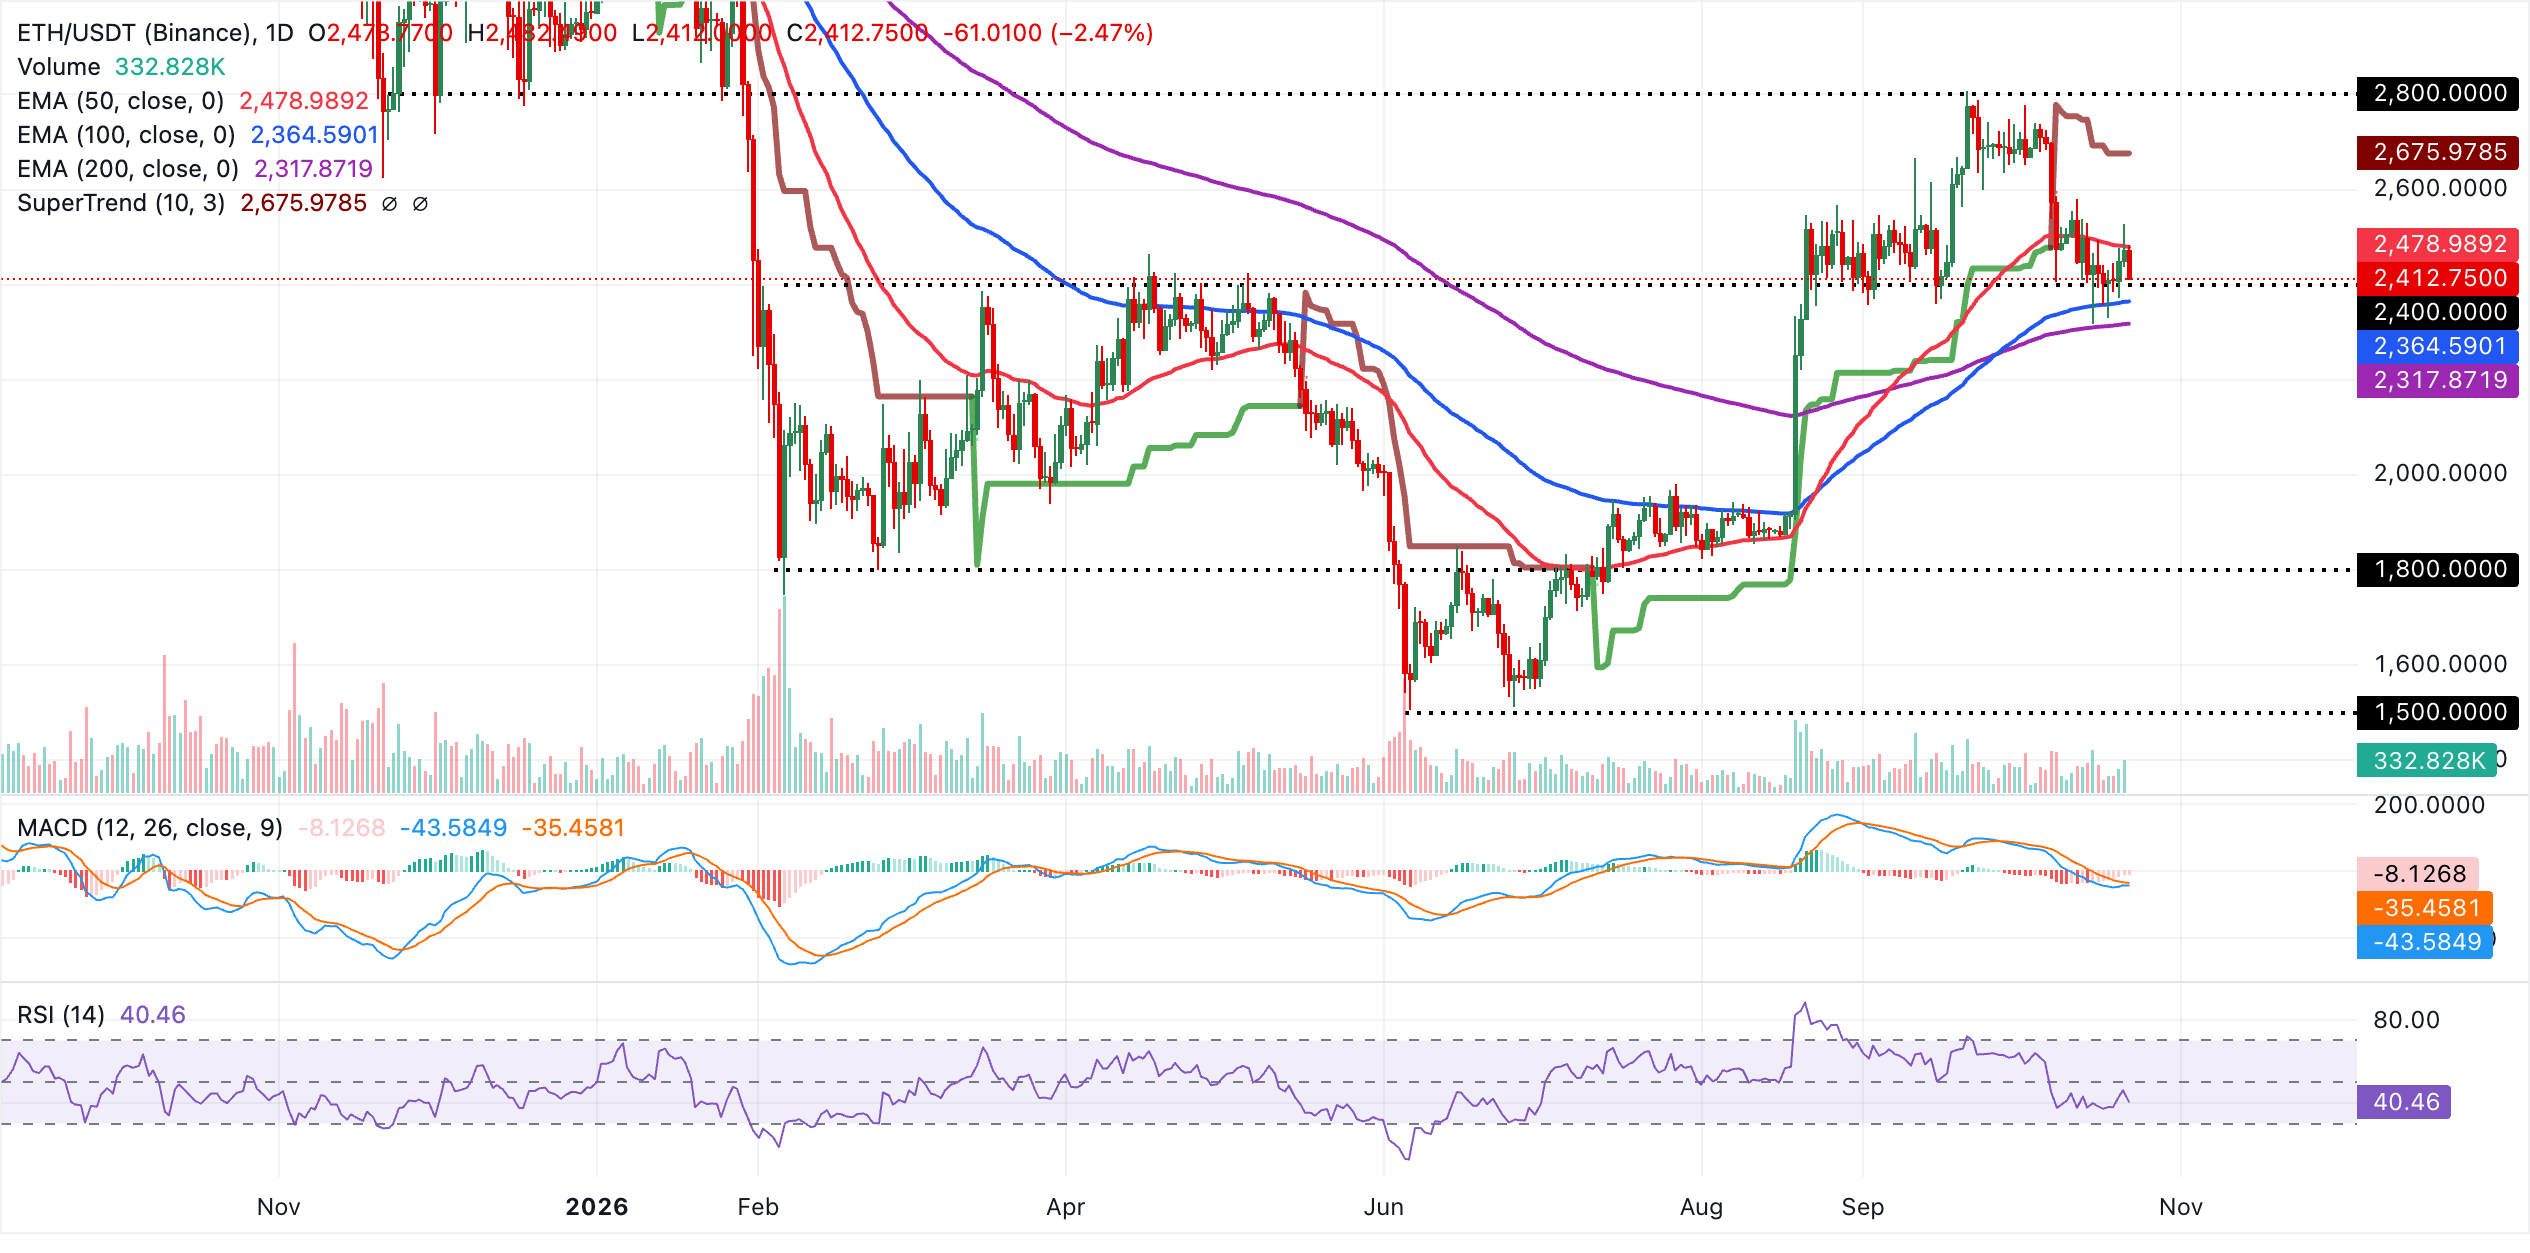
Initial resistance is seen at the 50-day EMA around $2,479, with a stronger barrier at the SuperTrend line near $2,676, where sellers are likely to re-emerge if price attempts a rebound. On the downside, immediate support comes from the 100-day EMA at about $2,364, followed by the 200-day EMA near $2,318. A daily close below this zone would reinforce the bearish tone and open the door to a deeper correction, while holding above it keeps ETH in a consolidative range inside its broader uptrend structure.
XRP, meanwhile, trades around $1.33, holding below the major moving averages and preserving a bearish near-term bias. The 100-day EMA at $1.34 is the nearest cap overhead, reinforced by the 50-day EMA at $1.37 and the 200-day EMA at $1.38, all aligning with the broader descending trendline structure and suggesting rallies remain vulnerable.
Momentum is subdued, with the RSI hovering near 43 and the MACD still marginally negative, suggesting any recovery attempts may struggle while price trades beneath these clustered averages.
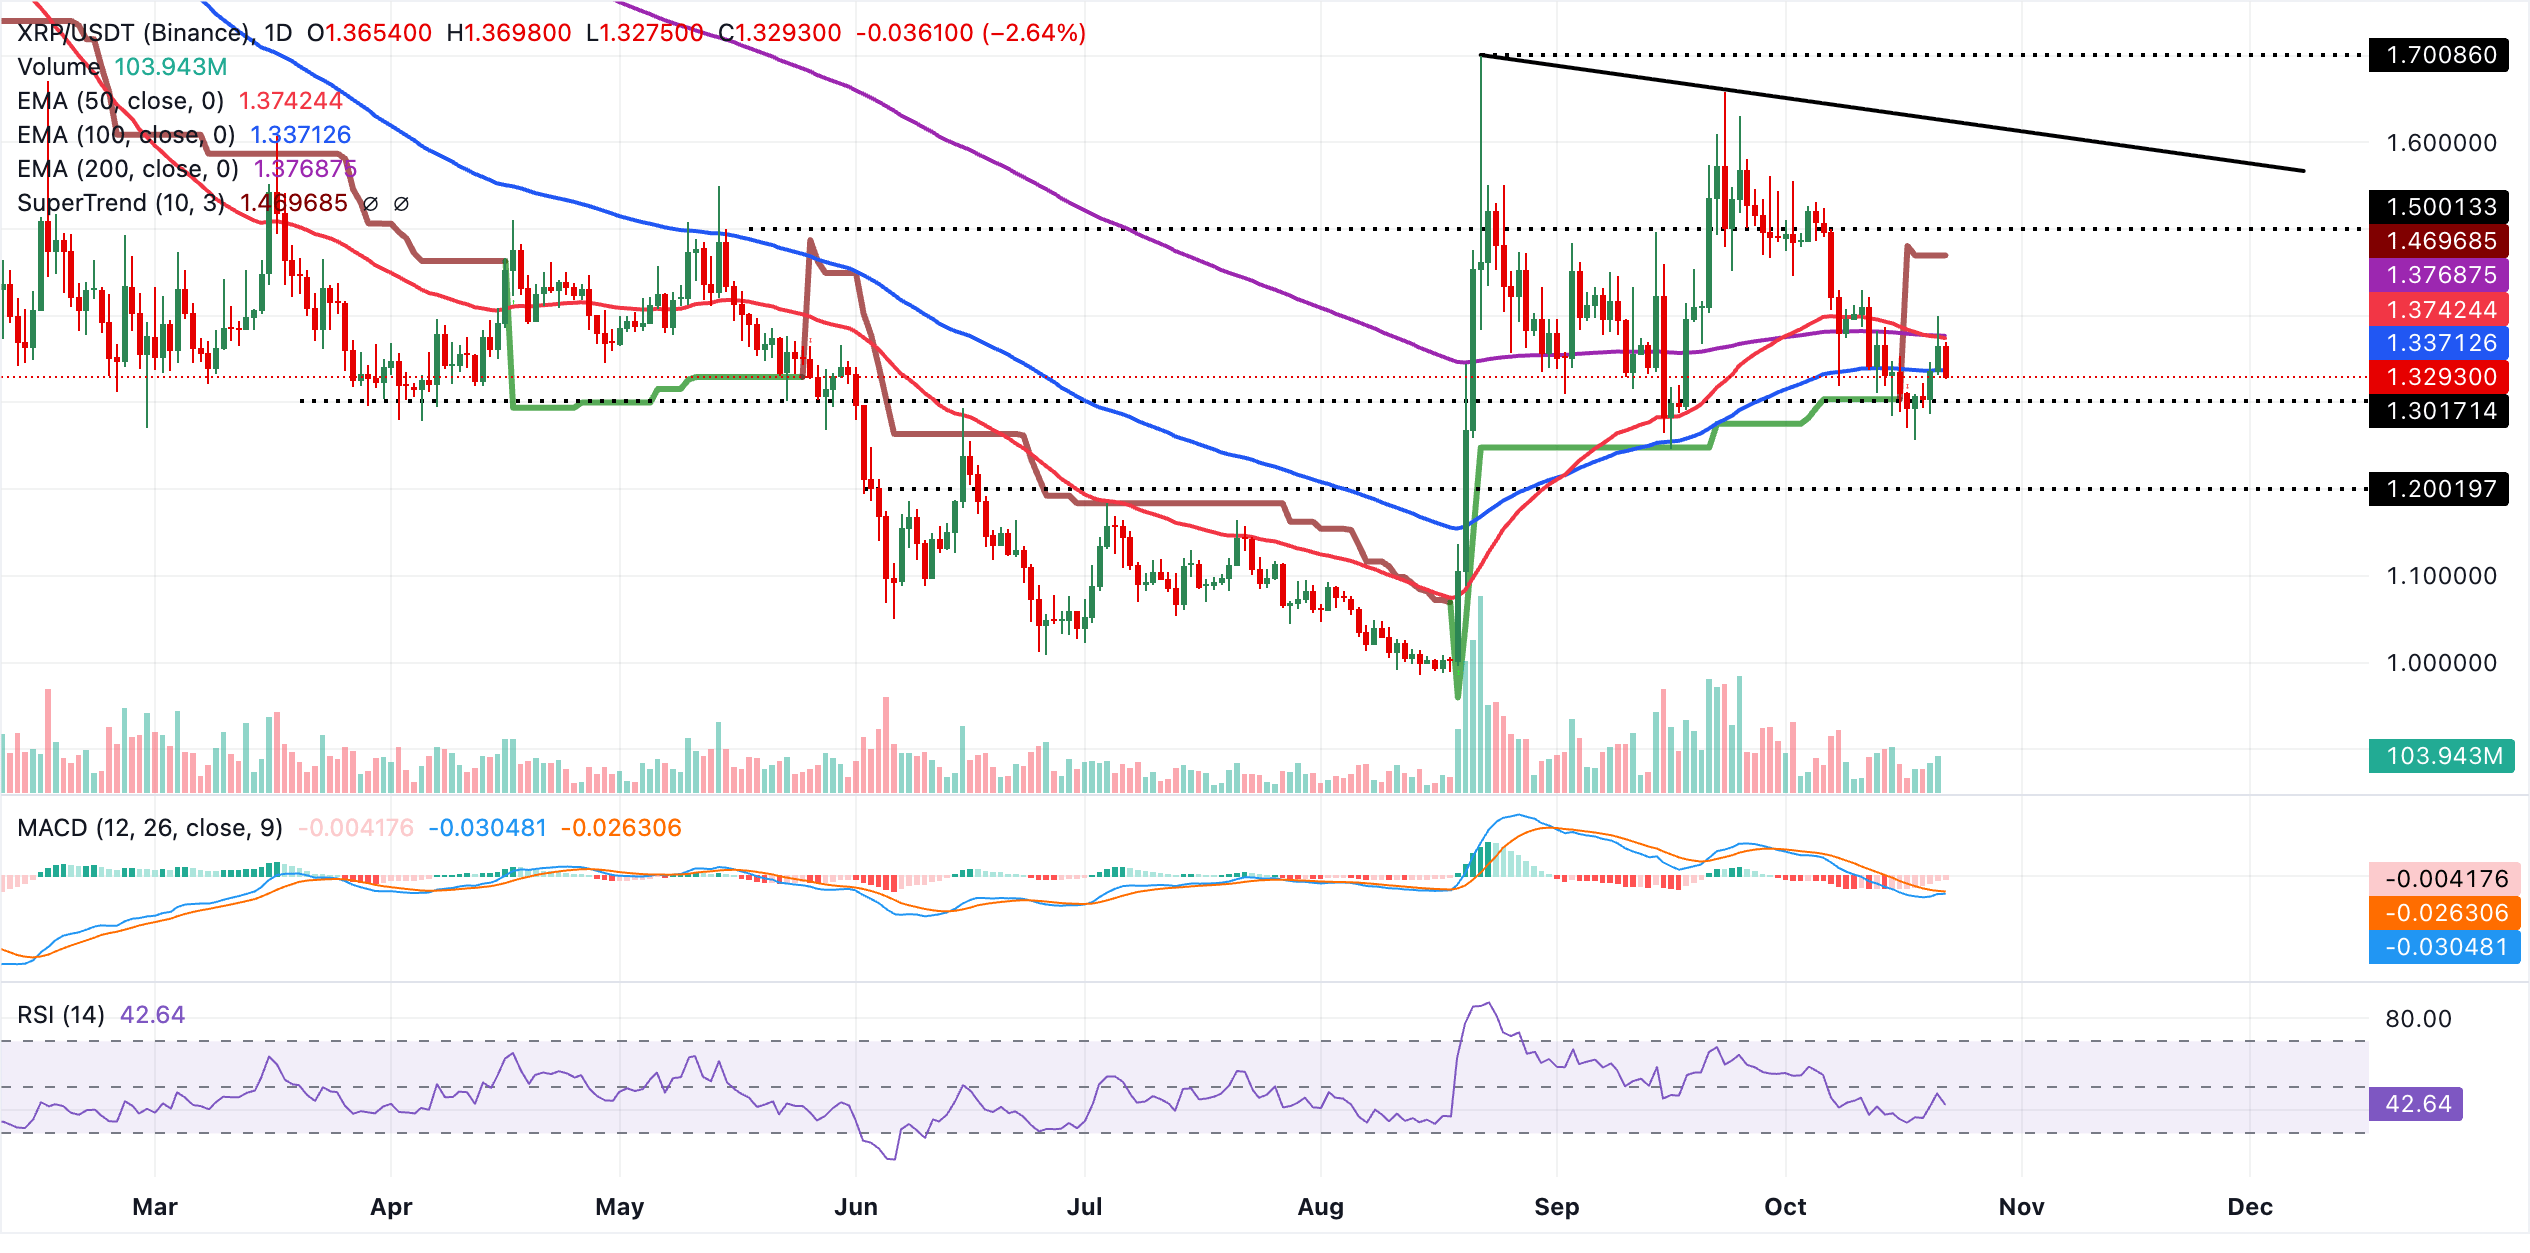
On the topside, initial resistance sits at the 100-day EMA around $1.34, followed by a thicker supply band between the 50-day EMA at roughly $1.37 and the 200-day EMA near $1.38, where the broader downtrend line is likely to add pressure. Beyond that, the SuperTrend indicator at $1.47 marks a more distant bearish trigger zone, which would need to be reclaimed to argue for a sustained shift away from the current downward bias.
(The technical analysis of this story was written with the help of an AI tool. Know more.)
Crypto ETF FAQs
An Exchange-Traded Fund (ETF) is an investment vehicle or an index that tracks the price of an underlying asset. ETFs can not only track a single asset, but a group of assets and sectors. For example, a Bitcoin ETF tracks Bitcoin’s price. ETF is a tool used by investors to gain exposure to a certain asset.
Yes. The first Bitcoin futures ETF in the US was approved by the US Securities & Exchange Commission in October 2021. A total of seven Bitcoin futures ETFs have been approved, with more than 20 still waiting for the regulator’s permission. The SEC says that the cryptocurrency industry is new and subject to manipulation, which is why it has been delaying crypto-related futures ETFs for the last few years.
Yes. The SEC approved in January 2024 the listing and trading of several Bitcoin spot Exchange-Traded Funds, opening the door to institutional capital and mainstream investors to trade the main crypto currency. The decision was hailed by the industry as a game changer.
The main advantage of crypto ETFs is the possibility of gaining exposure to a cryptocurrency without ownership, reducing the risk and cost of holding the asset. Other pros are a lower learning curve and higher security for investors since ETFs take charge of securing the underlying asset holdings. As for the main drawbacks, the main one is that as an investor you can’t have direct ownership of the asset, or, as they say in crypto, “not your keys, not your coins.” Other disadvantages are higher costs associated with holding crypto since ETFs charge fees for active management. Finally, even though investing in ETFs reduces the risk of holding an asset, price swings in the underlying cryptocurrency are likely to be reflected in the investment vehicle too.
Top Articles
1Japanese Yen: BoJ hawkish hold keeps January hike in focus – Standard Chartered2British Pound: Further rebound potential toward 1.3440 against US Dollar – UOB3Swiss Franc recovers its safe-haven status amid the turmoil in bond markets4AUD/USD Price Forecast: Rising oil prices push antipodeans under pressure5New Zealand Dollar: RBNZ hikes offer limited support against USD - BBH6Euro: Monetary reach and limits – Commerzbank7New Zealand Dollar underperforms as NZ inflation cools down8Gold slips below $4,100 as Middle East energy shock reinforces hawkish Fed outlook9Crypto Today: Bitcoin, Ethereum, XRP fall despite net ETF inflows
LIVE QUOTES


ALL ABOUT TECHNICAL
Order Block in Trading: What It Is and How to Trade It
Average True Range (ATR) Indicator: Formula, How to Read It, and How to Use It
Judas Swing: Meaning, ICT Trading Strategy and Examples
Butterfly Pattern Trading: How to Identify and Trade the Butterfly Harmonic Pattern
What Is a Rising Wedge Pattern and How Do You Trade It?
What Is a Descending Triangle Pattern and How Do You Trade It?
Accumulation, Manipulation and Distribution (AMD): ICT Power of 3 Trading Guide
Backtesting in Trading: What It Is and How to Backtest a Strategy
RSI Divergence: Bullish, Bearish and Hidden Divergence Explained
Get Started!
Sign up and access the Global Markets in less than 3 minutes

Connect With Us









Contacts
Phone: +61 2 8036 8388
Fax: +61 2 8036 8388
Email: support@tmgm.com



The information provided on this website is of a general nature only and does not constitute personal financial advice. Before acting on any information on this website, you should consider the suitability of the information in relation to your objectives, financial situation and needs. Investing in CFDs and FX Margin Contracts carries significant risks and is not suitable for all investors. You may lose more than your initial deposit. You do not own, or have, any interest in the underlying asset. We recommend that you seek independent advice and ensure you fully understand the risks involved before trading. It is important that you read and consider the disclosure document before you acquire any product listed on the website. The information and advertisements offered on this website are not intended for use by any person in any country or jurisdiction where such use would be contrary to local laws and regulations. The Products and Services offered on this website are not intended for residents of the United States, Malaysia and Thailand.
TMGM is authorized and regulated in various jurisdictions.
Trademax Australia Limited, trading as TMGM, is regulated by the Australian Securities and Investments Commission (ASIC), AFSL no. 436416 and is located at Level 28, One International Tower, 100 Barangaroo Avenue, 2000 Sydney, NSW Australia.
Email: support@tmgm.com.au
Trademax Global Limited, trading as TMGM, is authorized and regulated by the Vanuatu Financial Services Commission (VFSC), registration number 40356 and registered at 1276, Kumul Highway, Port Vila, Vanuatu, Republic of Vanuatu.
Email: support@tmgm.com
Trademax Global Markets (SE) Limited, trading as TMGM, is authorized and regulated by the Financial Services Authority (FSA) of Seychelles, with license number SD224. The company is registered at Office No 13, Providence Estate ABIS Centre, Mahe, Seychelles.
Email: support@tmgm.com
Trademax Global Markets (International) Pty Ltd, trading as TMGM, is authorized and regulated by the Financial Services Commission, Mauritius (FSC) with license no. GB22201012, and registered at 33, Edith Cavell Street C/o IQ EQ Fund Services (Mauritius) Ltd Port Louis, 11324 Mauritius.
Email: support@tmgm.com
Copyright © TMGM. All rights reserved