

Trading
Explore a wide range of markets with competitive pricing, deep liquidity, and advanced trading tools.
Learn More 
Platform
Trade seamlessly with TMGM's powerful platform, built for speed, precision, and a superior trading experience.
Learn More Trading Platform
Academy
Learn the fundamentals of trading with beginner-friendly resources, including guides, webinars, and market insights.
Learn More News & Analysis
Get real-time market updates and expert analysis to stay ahead of trading opportunities
Learn More News & Analysis
About
Learn what sets TMGM apart — our global presence, regulatory strength, and commitment to innovation in trading.
Learn More Why Choose TMGM
Sponsorship
Top Altcoins Price Forecast: Ripple, Solana, and Cardano extend decline as sellers resurface
- Ripple ticks lower on Thursday after three consecutive days of recovery, remaining capped within a falling channel pattern.
- Cardano is down 2%, extending the bearish breakout of a rising support trendline as selling pressure remains firm.
- Solana edges lower from its 50-day EMA at $106.76, risking a decline below $100 toward the 200-day EMA at $98.71.
Major altcoins, including Ripple (XRP), Cardano (ADA) and Solana (SOL), are trading in the red on Thursday as near-term selling pressure resurfaces. The technical outlook for the altcoins indicates a downside bias as XRP remains trapped in a falling channel pattern while ADA and SOL are capped by key moving averages.

Ripple extends losses in a bearish channel
Ripple trades around $1.3442 at press time on Thursday, flipping bearish after three consecutive days of recovery. On the four-hour chart, XRP remains capped within a falling channel pattern, with the overhead trend line connecting the September 23 and October 6 highs near $0.3669, while the lower boundary line connects the September 24 and October 18 lows near $1.2252.
From a technical perspective, the resistance cluster of the 200-period Exponential Moving Average (EMA) near $1.3827 and the overhead trend line capped gains the previous day. The 50-period EMA at $1.368 serves as immediate support, and a confirmed breakout could extend the decline toward the October 18 low at $1.2562, implying downside potential of over 6%.
Momentum on the four-hour chart remains weak, with the Moving Average Convergence Divergence (MACD) easing towards its signal line as the bullish histogram contracts, while the declining Relative Strength Index (RSI) is at 53, suggesting weak buying pressure.
Looking up, XRP must surpass the 200-period EMA at $1.3842, slightly above the overhead resistance line, which could confirm the falling channel pattern breakout. This could extend the recovery toward the $1.4517 horizontal level set by the September 24 low, followed by the $1.50 psychological level.
Cardano takes a bearish path
Cardano trades at $0.2205, keeping a bearish near-term tone as it holds below the 50-day EMA at $0.2281 and the 200-day EMA near $0.2400. The recent break under the former uptrend support line, now resistance around $0.2349, suggests rallies are being faded.
Momentum on the daily chart shifts bearish as indicated by the declining Moving Average Convergence Divergence (MACD) in the negative territory and the Relative Strength Index (RSI) at 42 hovering just above the oversold zone.
The path of least resistance for Cardano highlights a downside potential toward its initial support at the $0.1894 horizontal level set by the August 30 low.
Looking up, immediate resistance is seen at the 50-day EMA at $0.2281, followed by the previously broken rising trend line near $0.2349, with the 200-day EMA around $0.2400 acting as a higher cap if buyers attempt a deeper recovery.
Solana continues to face strong headwinds
Solana trades at $105.53 on Thursday, keeping a bearish near-term tone. The 50-day EMA at $106.76 continues to cap upside, while SOL holds above the 200-day EMA at $98.71, suggesting a capped market within a broader medium-term uptrend.
Momentum indicators on the daily chart suggest that buyers are losing their upper hand. The RSI around 43 points to subdued buying pressure, while the MACD remains negative, suggesting that downside momentum persists.
The 200-day EMA at $98.71 marks key support, and a break below this level would reinforce the bearish bias and expose SOL to a deeper pullback toward the May 17 low at $83.50.
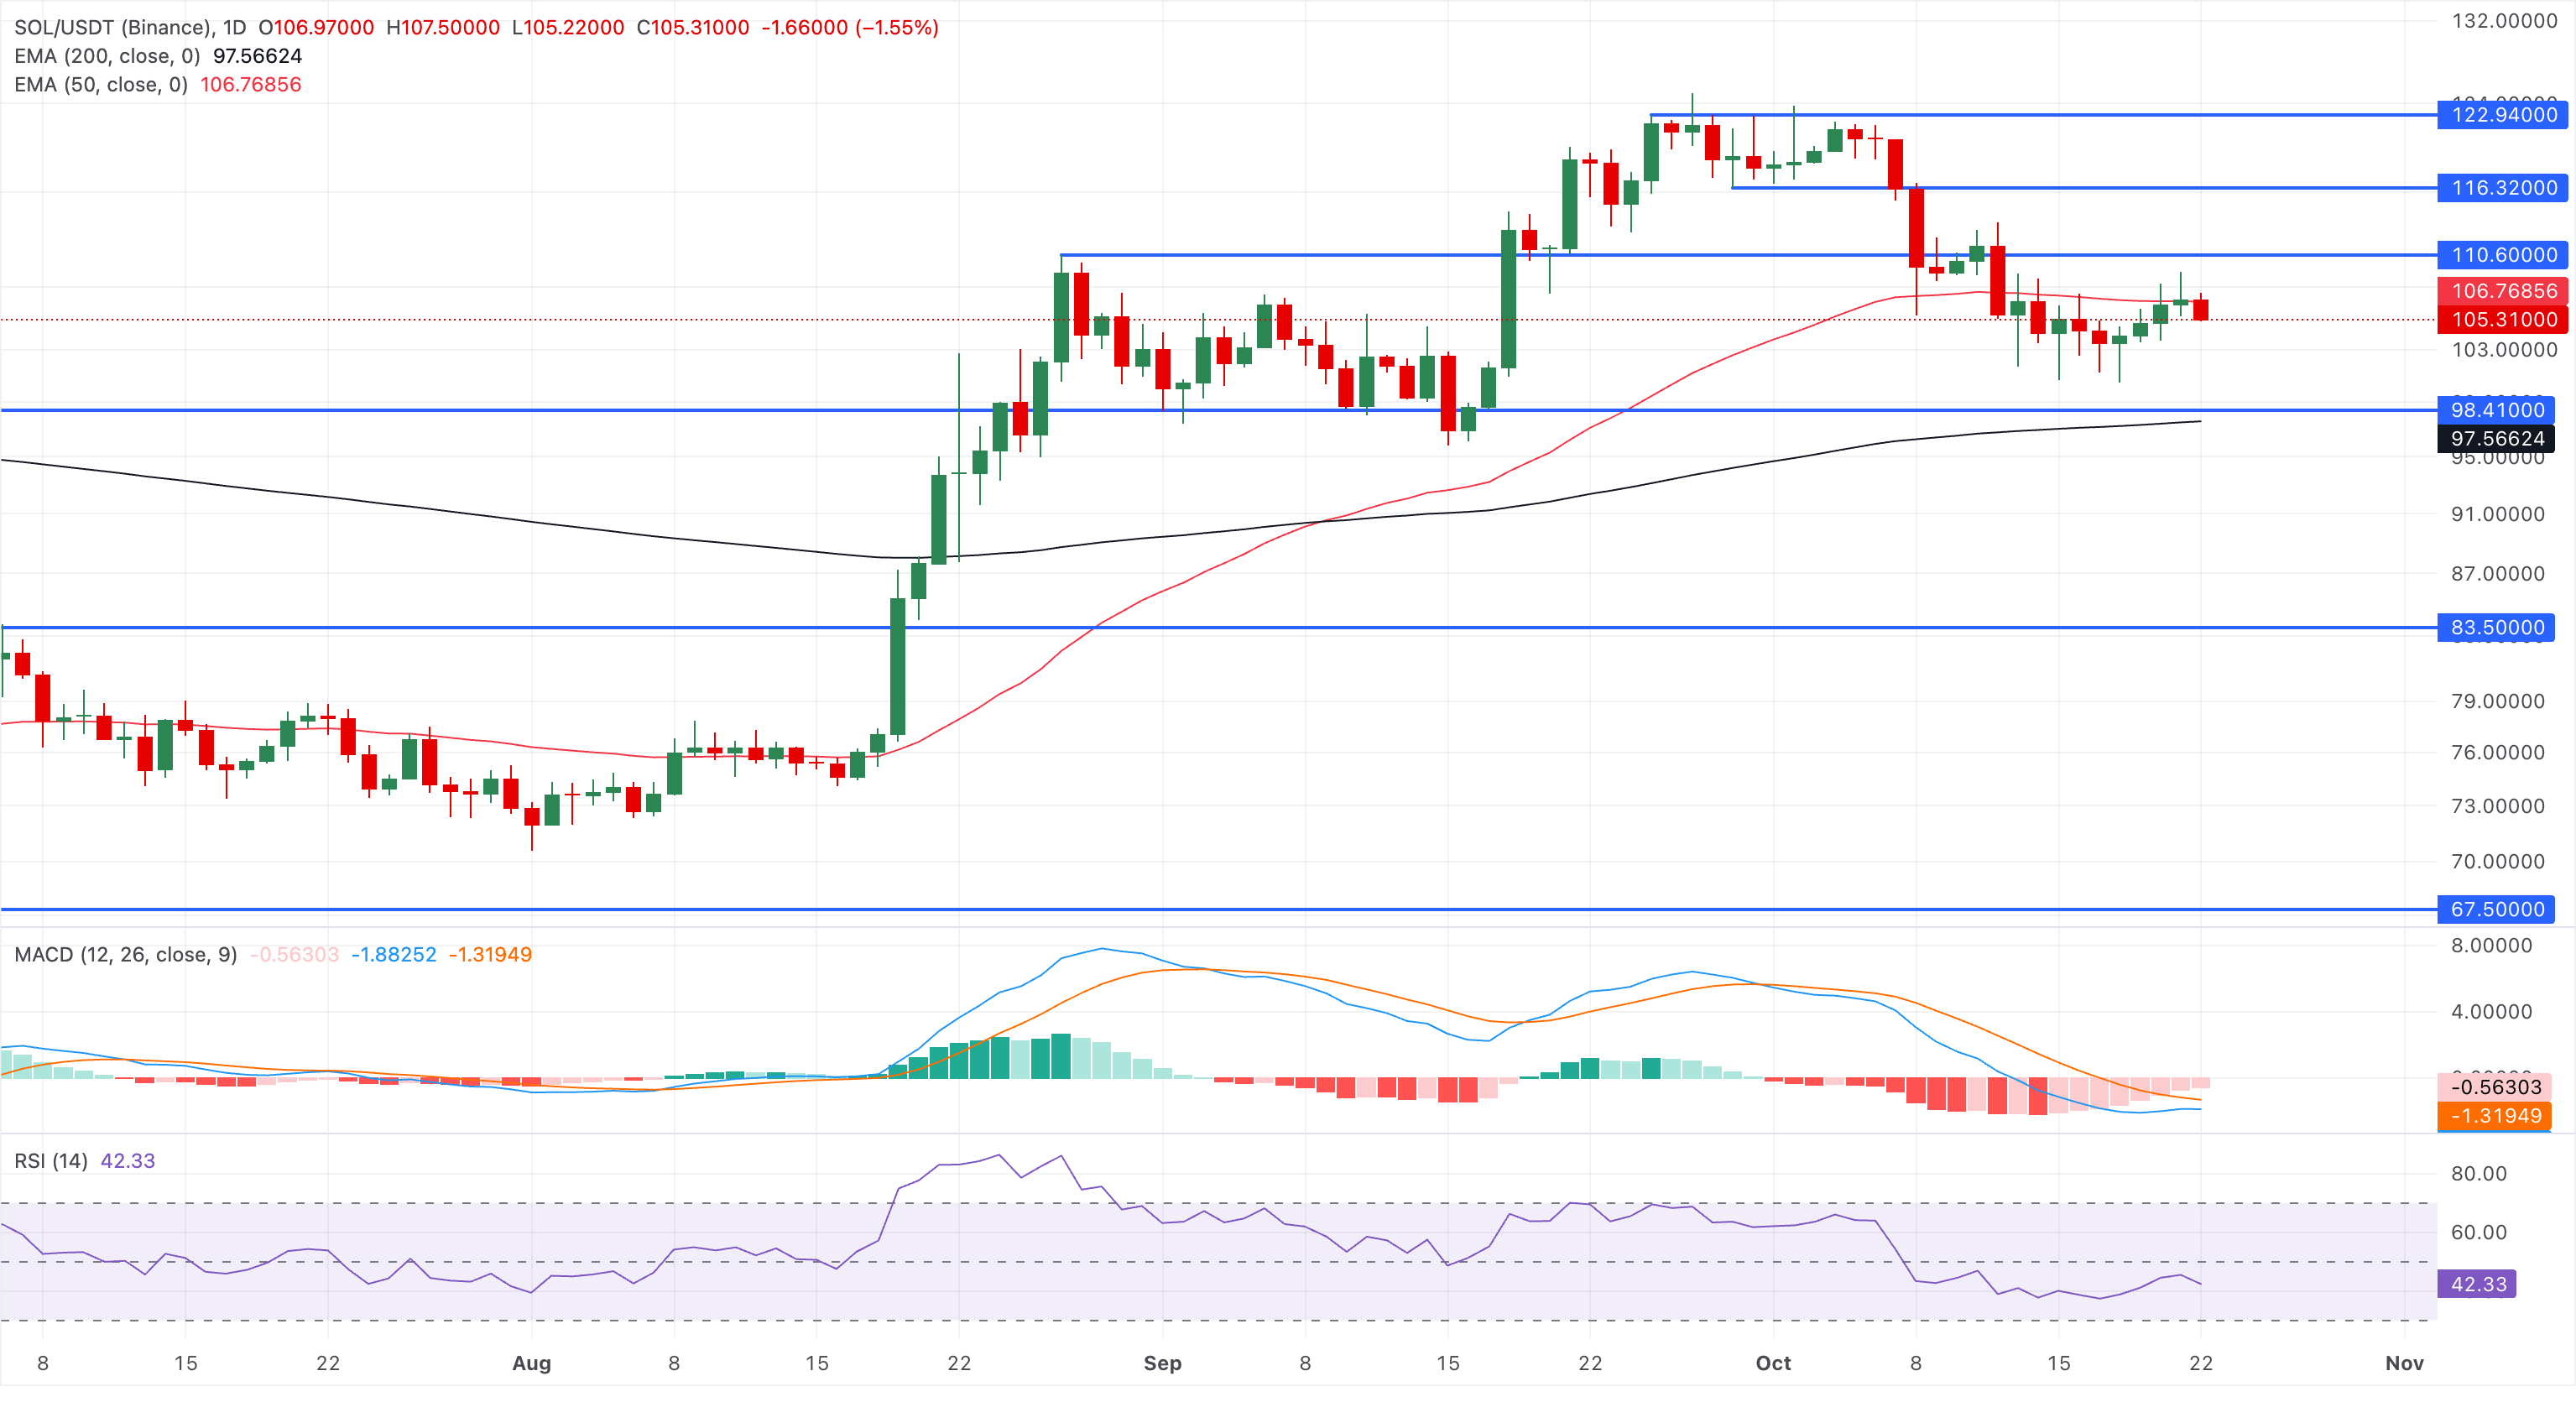
On the flip side, Initial resistance is seen at the 50-day EMA near $106.76, and a daily close above this barrier would ease immediate downside pressure. Still, SOL could face multiple overhead resistances, including the August 27 high of $110.60 and the September 25 high of $122.94.
(The technical analysis of this story was written with the help of an AI tool. Know more.)
Top Articles
1US Dollar Index Price Forecast: Posts fresh three-week low near 101.452Indonesian Rupiah: BI measures may slow IDR losses against US Dollar - MUFG3Japanese Yen: Range trading with upside medium term risk against US Dollar – UOB4Forex Today: US Dollar extends slide as US yields stretch lower5Iran's IRGC warns US of wider response, says seven vessels hit6Australian Dollar: RBA expectations support Aussie against US Dollar – Commerzbank7Canadian Dollar gathers strength on elevated oil prices8Equities: Tech signals mixed as futures retreat – Danske Bank9GBP/USD Price Forecast: Holds onto monthly high near 1.3410
LIVE QUOTES


ALL ABOUT TECHNICAL
Order Block in Trading: What It Is and How to Trade It
Average True Range (ATR) Indicator: Formula, How to Read It, and How to Use It
Judas Swing: Meaning, ICT Trading Strategy and Examples
Butterfly Pattern Trading: How to Identify and Trade the Butterfly Harmonic Pattern
What Is a Rising Wedge Pattern and How Do You Trade It?
What Is a Descending Triangle Pattern and How Do You Trade It?
Accumulation, Manipulation and Distribution (AMD): ICT Power of 3 Trading Guide
Backtesting in Trading: What It Is and How to Backtest a Strategy
RSI Divergence: Bullish, Bearish and Hidden Divergence Explained
Get Started!
Sign up and access the Global Markets in less than 3 minutes

Connect With Us









Contacts
Phone: +61 2 8036 8388
Fax: +61 2 8036 8388
Email: support@tmgm.com



The information provided on this website is of a general nature only and does not constitute personal financial advice. Before acting on any information on this website, you should consider the suitability of the information in relation to your objectives, financial situation and needs. Investing in CFDs and FX Margin Contracts carries significant risks and is not suitable for all investors. You may lose more than your initial deposit. You do not own, or have, any interest in the underlying asset. We recommend that you seek independent advice and ensure you fully understand the risks involved before trading. It is important that you read and consider the disclosure document before you acquire any product listed on the website. The information and advertisements offered on this website are not intended for use by any person in any country or jurisdiction where such use would be contrary to local laws and regulations. The Products and Services offered on this website are not intended for residents of the United States, Malaysia and Thailand.
TMGM is authorized and regulated in various jurisdictions.
Trademax Australia Limited, trading as TMGM, is regulated by the Australian Securities and Investments Commission (ASIC), AFSL no. 436416 and is located at Level 28, One International Tower, 100 Barangaroo Avenue, 2000 Sydney, NSW Australia.
Email: support@tmgm.com.au
Trademax Global Limited, trading as TMGM, is authorized and regulated by the Vanuatu Financial Services Commission (VFSC), registration number 40356 and registered at 1276, Kumul Highway, Port Vila, Vanuatu, Republic of Vanuatu.
Email: support@tmgm.com
Trademax Global Markets (SE) Limited, trading as TMGM, is authorized and regulated by the Financial Services Authority (FSA) of Seychelles, with license number SD224. The company is registered at Office No 13, Providence Estate ABIS Centre, Mahe, Seychelles.
Email: support@tmgm.com
Trademax Global Markets (International) Pty Ltd, trading as TMGM, is authorized and regulated by the Financial Services Commission, Mauritius (FSC) with license no. GB22201012, and registered at 33, Edith Cavell Street C/o IQ EQ Fund Services (Mauritius) Ltd Port Louis, 11324 Mauritius.
Email: support@tmgm.com
Copyright © TMGM. All rights reserved