

التداول
اكتشف مجموعة متنوعة من الأسواق العالمية مع تسعير تنافسي، سيولة عالية، وأدوات تداول متقدمة تدعم قراراتك الاستثمارية.
اكتشف المزيد 
منصات التداول
تداول بسلاسة مع منصة TMGM القوية، المصممة للسرعة والدقة وتجربة تداول فائقة.
اكتشف المزيد منصات التداول
الأكاديمية
تعلّم أساسيات التداول من خلال محتوى تعليمي مُبسط ومصمم للمبتدئين، يشمل أدلة تعليمية،ندوات مباشرة عبر الإنترنت، وتحليلات لأهم تحركات السوق.
اكتشف المزيد أكاديمية TMGM
الأخبار والتحليلات
تابع أحدث تطورات الأسواق لحظة بلحظة، مع تحليلات احترافية تساعدك على اتخاذ قرارات مدروسة والاستفادة من فرص التداول.
اكتشف المزيد الأخبار والتحليلات
معلومات عنا
تعرّف على ما يميز TMGM، من حضور عالمي قوي وإشراف تنظيمي موثوق، إلى التزامنا المستمر بالابتكار وتطوير بيئة تداول متقدمة.
اكتشف المزيد لماذا TMGM؟
Crypto Today: Bitcoin, Ethereum, XRP face increasing selling pressure, ETF outflows
- Bitcoin remains in a corrective trend, trading below $65,000 on Monday amid $1 billion in ETF outflows last week.
- Ethereum bears tighten their grip as spot risks deeper losses below $1,800.
- XRP edges lower below $0.95, weighed down by a weak technical structure and capital outflows.
Bitcoin (BTC) trades lower below $65,000 on Monday, as selling pressure expands in the broader cryptocurrency market, accentuated by growing risk-off sentiment. Ethereum (ETH) paints a similar grim picture, with the price sliding near $1,800 while Ripple (XRP) remains below $0.95.

The remittance token is trading at multi-year lows, while overhead conditions appear not to be helping to relieve buyers. If the path of least resistance remains downward across BTC, ETH and XRP, recovery could be an uphill battle.
Crypto ETFs extend outflow streak
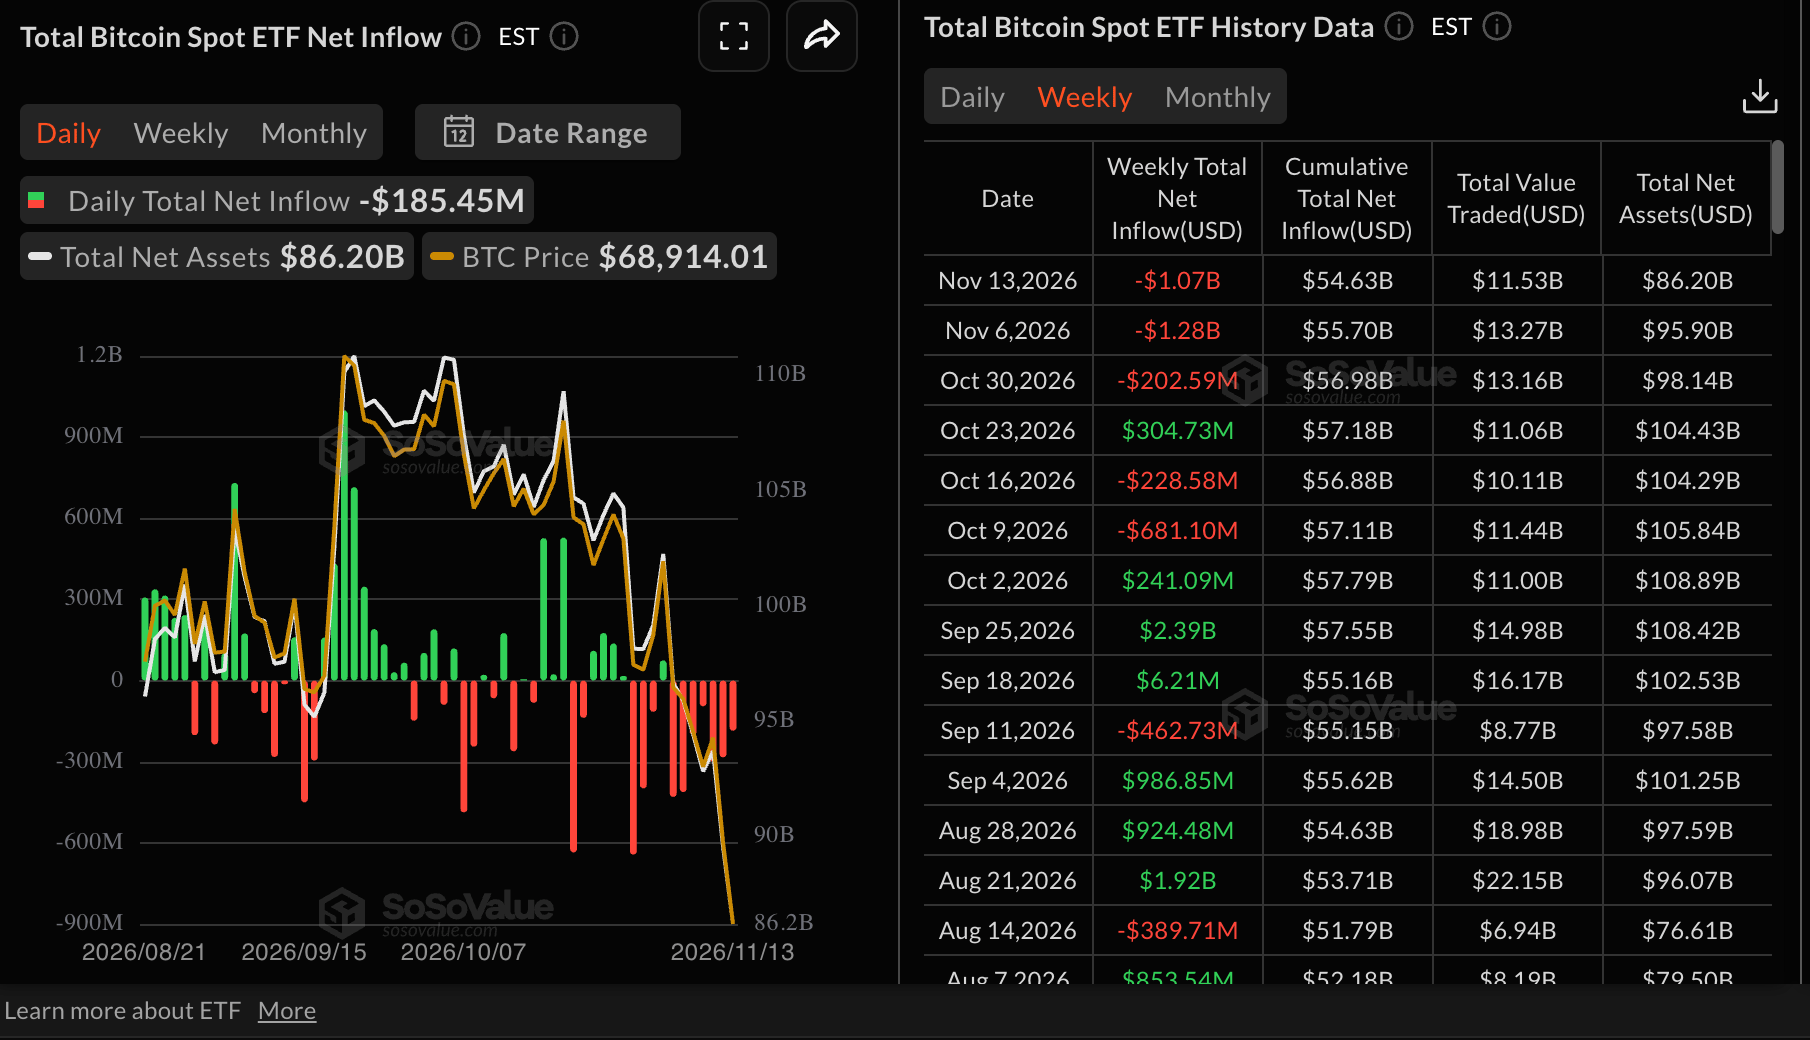
Interest in crypto-related investment products has continued to deteriorate over the last few weeks, as reflected in Bitcoin Exchange-Traded Funds (ETFs), which recorded slightly over $1 billion in outflows last week through Friday. This marks the Third consecutive week of outflows, bringing cumulative outflows to $54.6 billion and net assets under management to $86.2 billion. Persistent outflows weaken the institutional cushion against broader market price pressures, raising the odds of an extended sell-off.
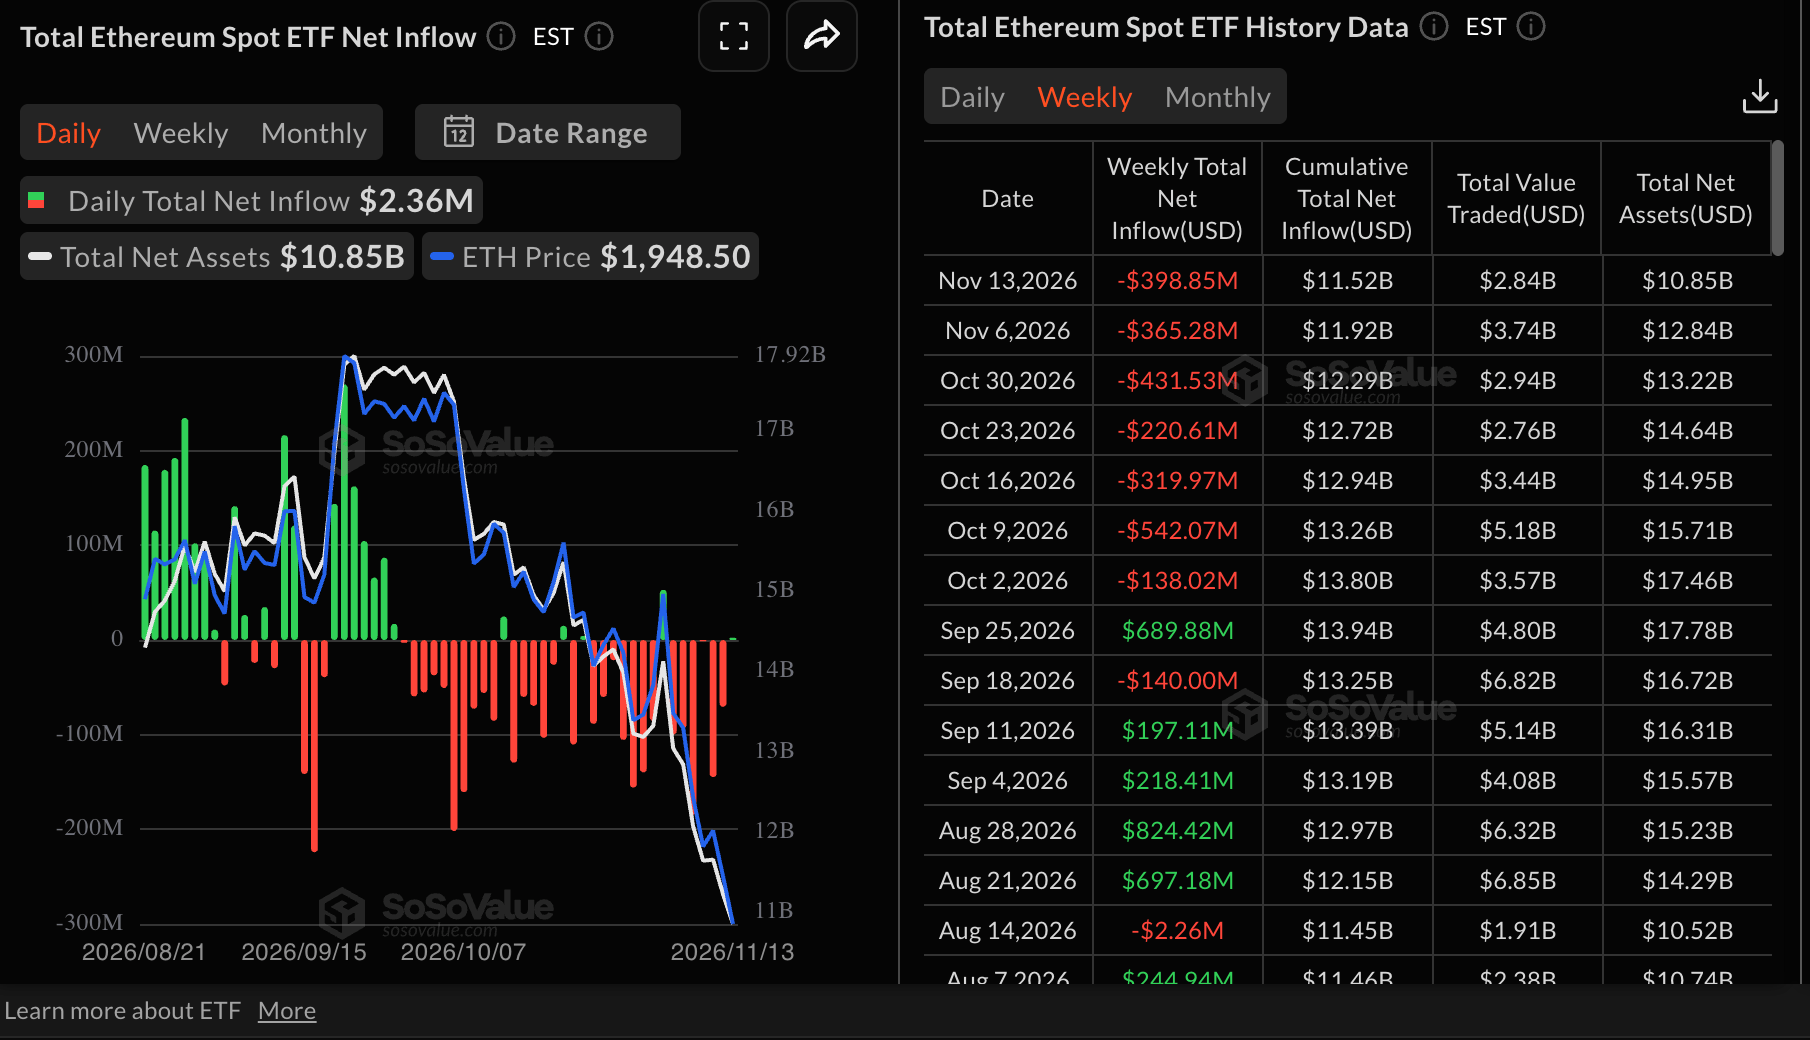
Ethereum spot ETFs remain under bearish control, with outflows totaling $399 million last week through Friday. This marks the seventh straight week of outflows, with cumulative inflows falling to $11.5 billion and net assets under management to $10.9 billion, according to SoSoValue.
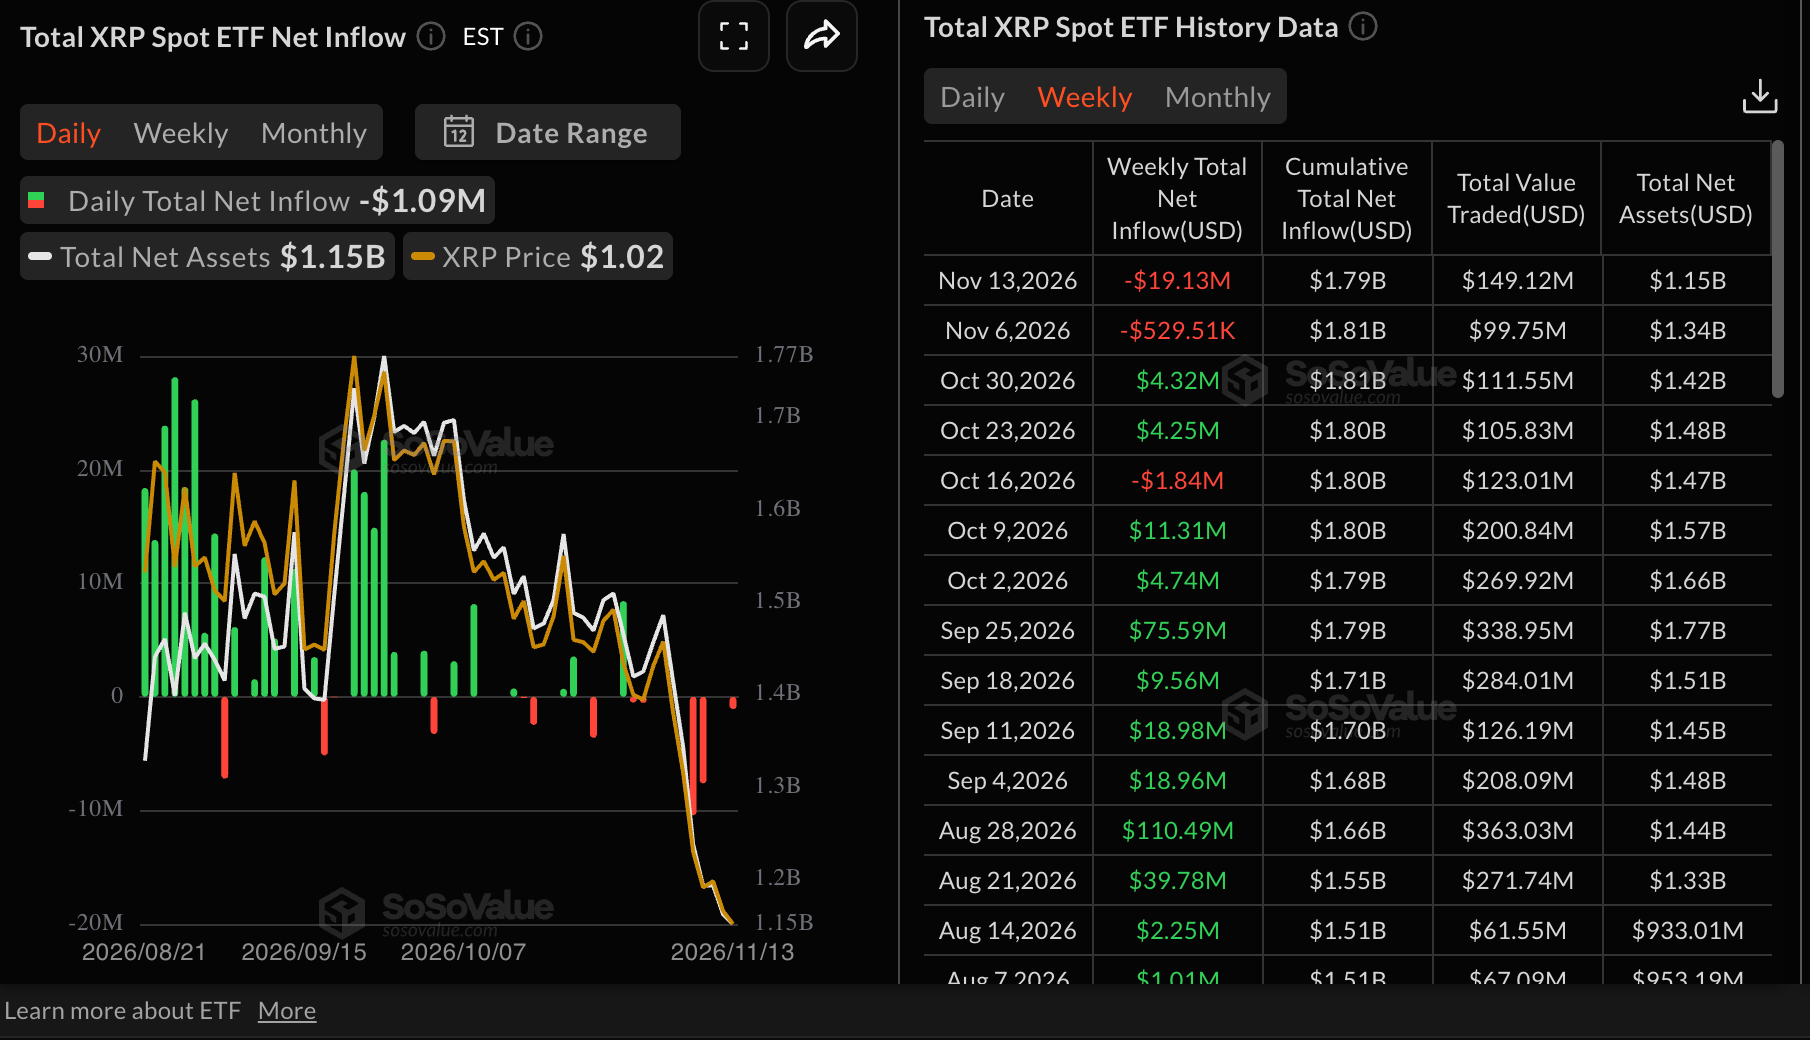
XRP spot ETFs saw a notable increase in outflows last week, amounting to roughly $19 million in outflows last week through Friday. This is the second bearish week, following $ 530,000 in outflows in the week ending November 6. Still, cumulative inflows stand at $1.8 billion, with net outflows at $1.2 billion, suggesting investors' interest in the underlying token is positive and long-term.
Technical analysis: Bitcoin bleeds as sell-side pressure intensifies
Bitcoin trades at $64,439, extending its decline well below the key Exponential Moving Averages (EMAs), which keeps the near-term bias bearish. The 50-day EMA at $76,674, the 100-day EMA at $76,456 and the 200-day EMA at $76,008 all sit overhead, suggesting a capped market where any rebound would face layered supply.
The SuperTrend line at $72,754 adds an intermediate resistance barrier, while a deeply negative MACD and an oversold Relative Strength Index (RSI) at 23 hint that downside momentum remains dominant, even if a corrective bounce cannot be ruled out.
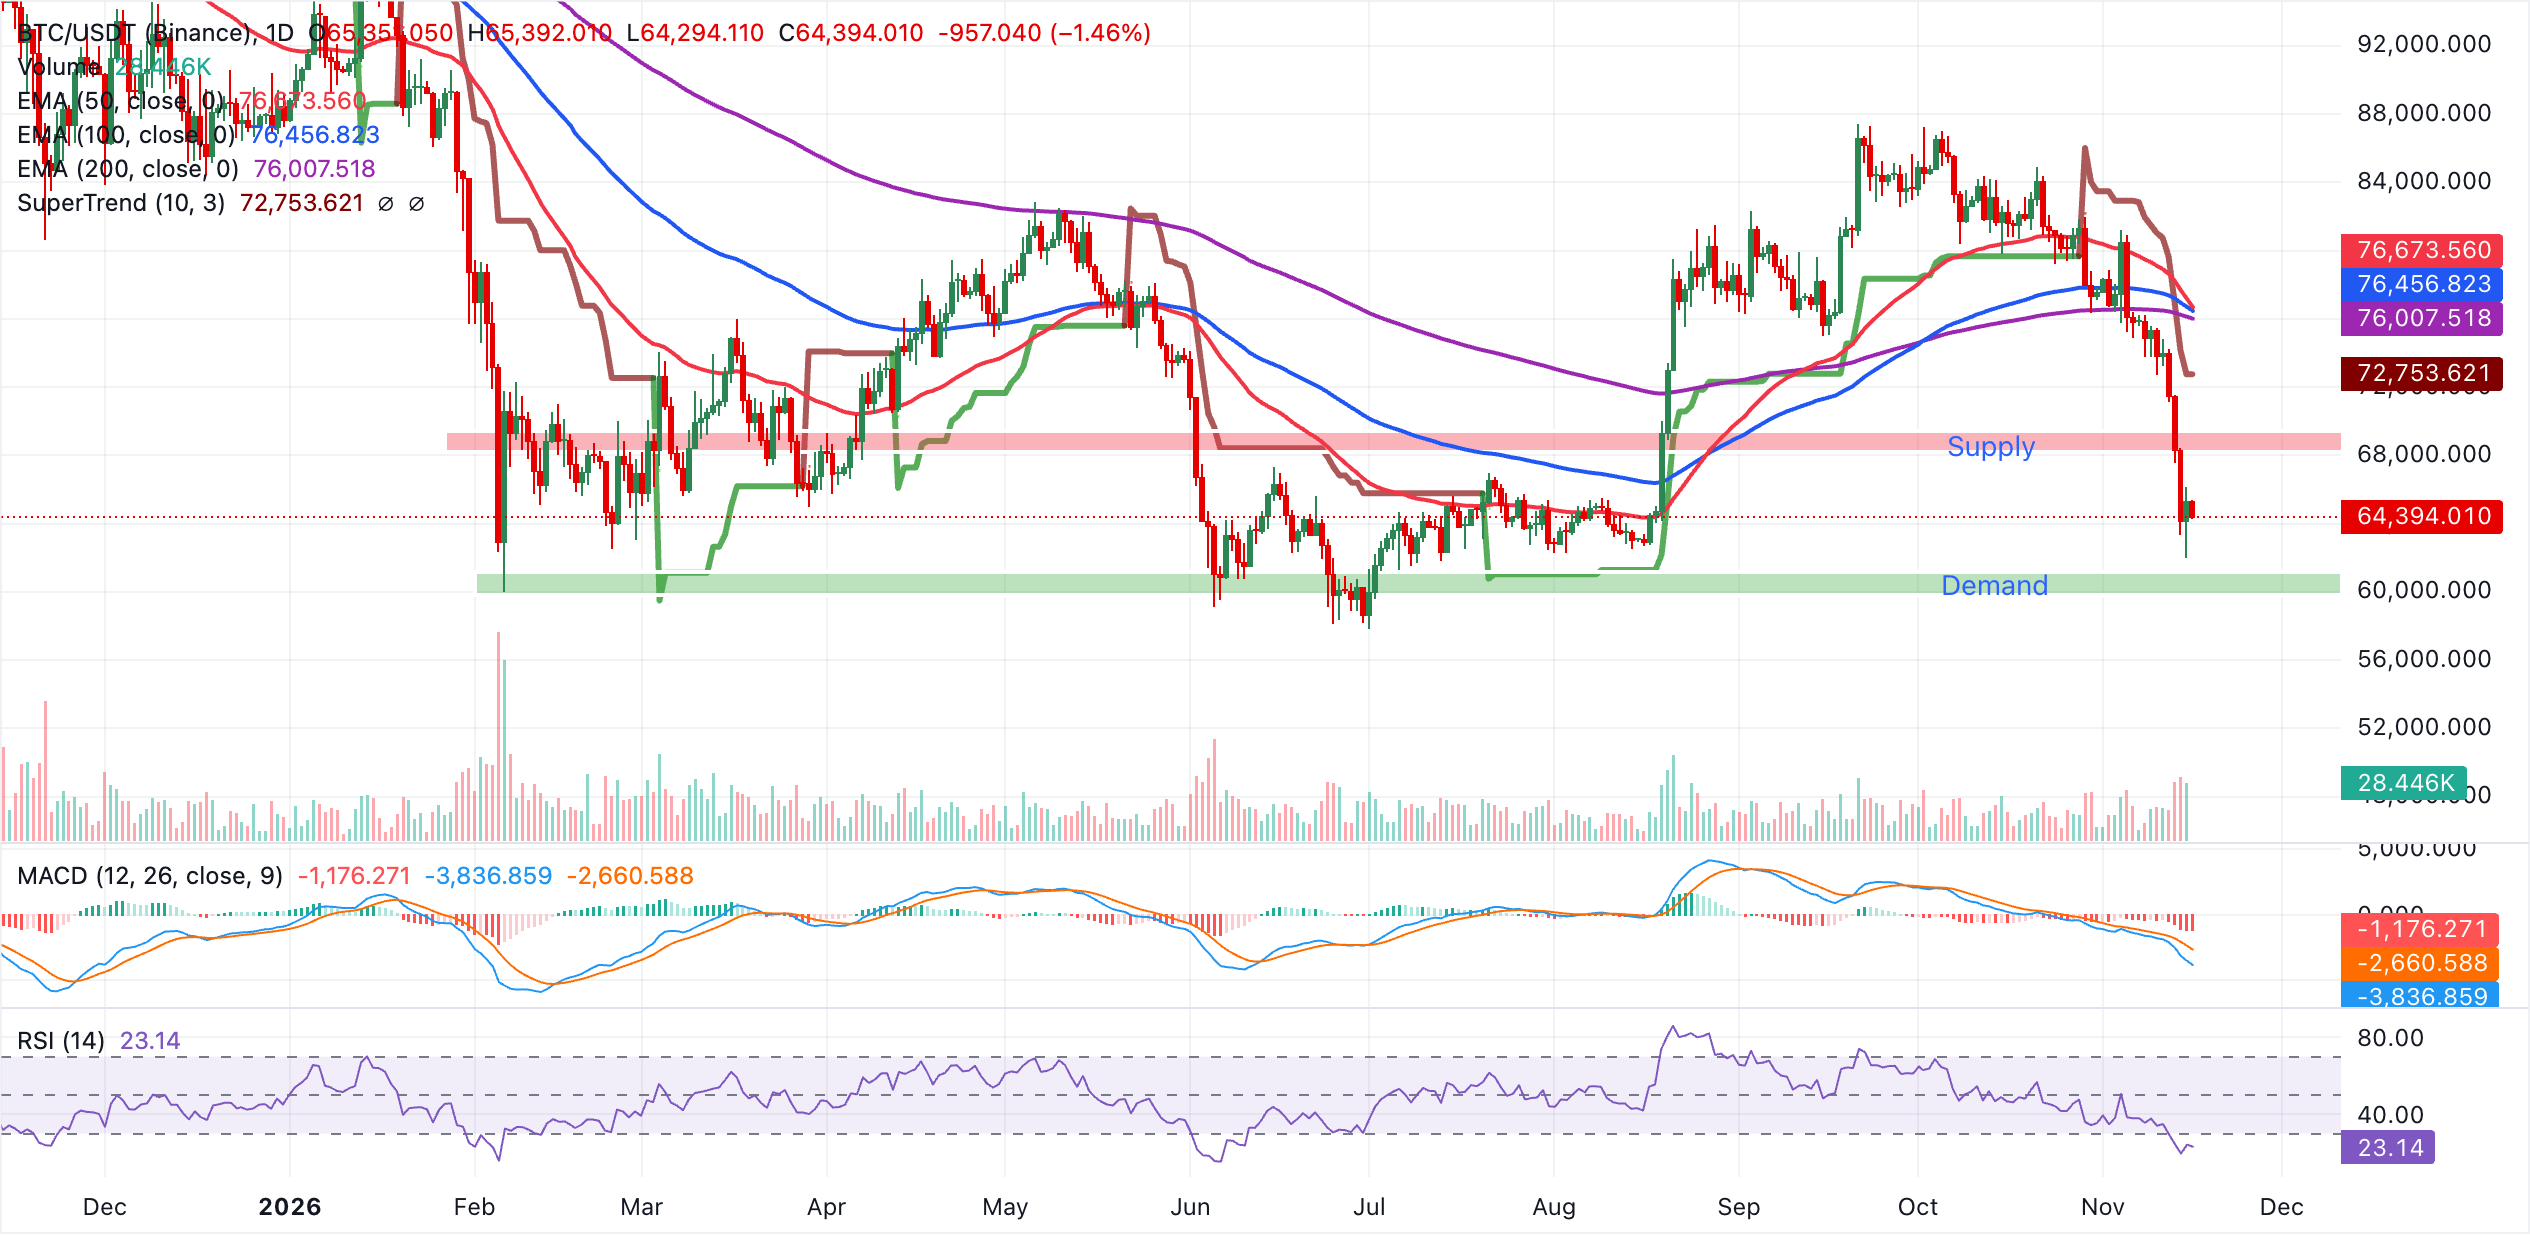
Any immediate recovery attempt would first face the SuperTrend hurdle around $72,754, before the broader bearish structure defined by the 200-day, 100-day, and 50-day EMAs clustered between $76,008 and $76,675 comes into play as a dense resistance zone.
With no nearby technical support highlighted on the daily chart, the focus stays on how price reacts to these overhead levels. Failure to reclaim them would likely keep sellers in control, while a sustained daily close back above the SuperTrend and the long-term EMAs would be needed to ease the prevailing bearish pressure.
Ethereum technical analysis: ETH momentum deteriorates further
Ethereum trades at $1,807, keeping a clear bearish near-term bias as price holds well below the 50-day, 100-day and 200-day EMAs clustered in the $2,260-$2,283 area. The MACD stays deep in negative territory, while the RSI at 25 sits in oversold conditions, suggesting persistent downside pressure even as the market shows signs of short-term exhaustion.
Immediate resistance lies at the 50-day EMA near $2,260, followed by the 200-day EMA at $2,279 and the 100-day EMA around $2,283, forming a dense overhead supply zone that would need to be reclaimed to ease the current bearish tone. On the downside, the SuperTrend line offers the next notable support around $2,113, with a daily close back above that zone needed to hint at stabilization rather than a continuation of the recent slide.
Technical analysis: XRP sellers gain more ground
XRP trades below $0.95, maintaining a bearish near-term bias as price holds well below the key moving averages. The 50-day EMA at $1.23, the 100-day EMA at $1.27 and the 200-day EMA at $1.33 all sit overhead, suggesting a market that remains capped after the recent slide.
The SuperTrend indicator at $1.13 reinforces this topside pressure, while the RSI around 25 stays in oversold territory, hinting at stretched downside but not yet signaling a clear recovery. The MACD remains negative and below its signal line, with a subdued histogram, reinforcing the prevailing bearish tone.
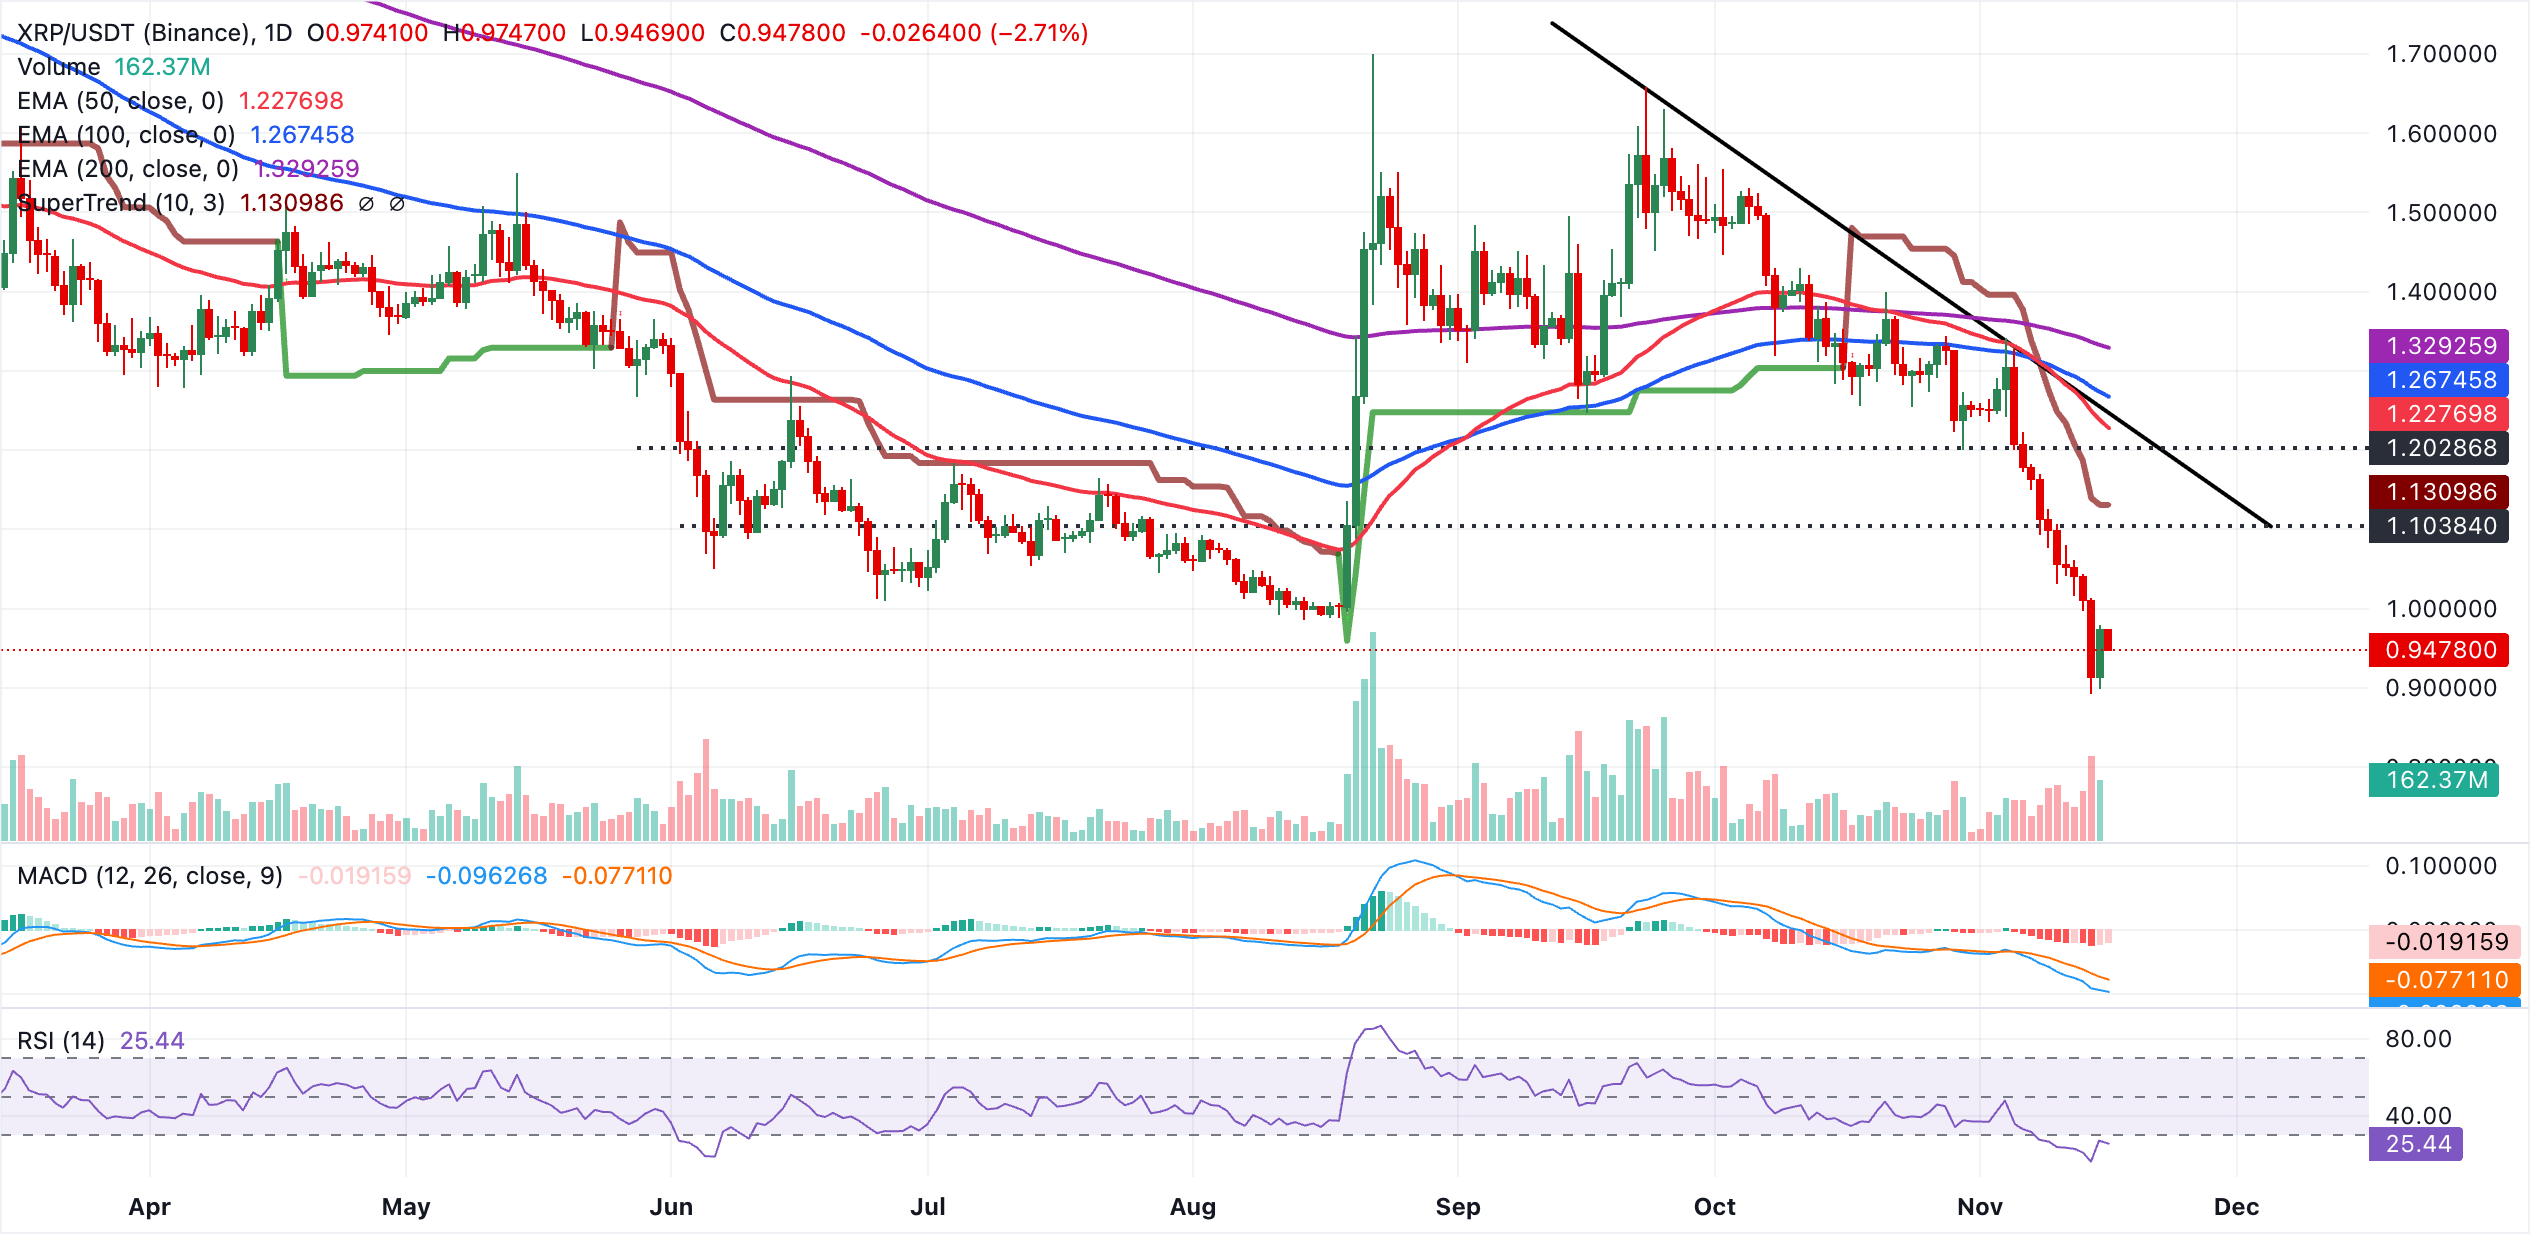
Initial resistance emerges at the SuperTrend level near $1.13, ahead of a denser barrier formed by the 50-day EMA at $1.23 and the downward resistance trendline break price at $1.24. Above this area, the 100-day EMA at $1.27 and the 200-day EMA at $1.33 mark successive hurdles that would need to be reclaimed to ease the broader downside pressure.
With no clear structural support below the current price on the daily chart, traders may continue to focus on how price behaves as it approaches these overhead levels, watching for either a rejection that extends the downtrend or a sustained break that would challenge the current bearish bias.
(The technical analysis of this story was written with the help of an AI tool. Know more.)
Crypto ETF FAQs
An Exchange-Traded Fund (ETF) is an investment vehicle or an index that tracks the price of an underlying asset. ETFs can not only track a single asset, but a group of assets and sectors. For example, a Bitcoin ETF tracks Bitcoin’s price. ETF is a tool used by investors to gain exposure to a certain asset.
Yes. The first Bitcoin futures ETF in the US was approved by the US Securities & Exchange Commission in October 2021. A total of seven Bitcoin futures ETFs have been approved, with more than 20 still waiting for the regulator’s permission. The SEC says that the cryptocurrency industry is new and subject to manipulation, which is why it has been delaying crypto-related futures ETFs for the last few years.
Yes. The SEC approved in January 2024 the listing and trading of several Bitcoin spot Exchange-Traded Funds, opening the door to institutional capital and mainstream investors to trade the main crypto currency. The decision was hailed by the industry as a game changer.
The main advantage of crypto ETFs is the possibility of gaining exposure to a cryptocurrency without ownership, reducing the risk and cost of holding the asset. Other pros are a lower learning curve and higher security for investors since ETFs take charge of securing the underlying asset holdings. As for the main drawbacks, the main one is that as an investor you can’t have direct ownership of the asset, or, as they say in crypto, “not your keys, not your coins.” Other disadvantages are higher costs associated with holding crypto since ETFs charge fees for active management. Finally, even though investing in ETFs reduces the risk of holding an asset, price swings in the underlying cryptocurrency are likely to be reflected in the investment vehicle too.
المقالات الشائعة
1الذهب: الاتجاه الهابط يمتد نحو أهداف سعرية أدنى – سوسيتيه جنرال2اليورو: المخاطر المالية تُلقي بظلالها على الدعم المستمد من أسعار الفائدة – كومرتس بنك3خام غرب تكساس الوسيط يتردد فوق 87 دولارًا وسط تصاعد المخاوف الجيوسياسية والتحذيرات من فائض المعروض4الدولار الأمريكي: الزخم القوي يبدو أصعب انحسارًا – ING5الدولار الأسترالي: يختبر مستوى 0.6755 مقابل الدولار الأمريكي ويتجه نحو 0.6740 - UOB6سعر الفضة اليوم: الفضة تتراجع وفقًا لبيانات FXStreet7الأسهم: تعافٍ متوازن بعد موجة البيع التي أعقبت انتخابات التجديد النصفي – بنك دانسكي8الدولار الكندي: تزايد مخاطر الهبوط أمام الدولار الأمريكي - سوسيتيه جنرال9توقعات سعر EUR/GBP: اليورو يتراجع دون 0.8350 مع استعادة البائعين السيطرة


ابدأ الآن!
سجّل وابدأ التداول في الأسواق العالمية خلال أقل من 3 دقائق

تواصل معنا









جهات الاتصال
الهاتف +61 2 8036 8388
الفاكس +61 2 8036 8388
البريد الإلكتروني support@tmgm.com
الموقع الإلكتروني https://www.tmg-max.com



المعلومات المقدمة على هذا الموقع الإلكتروني ذات طبيعة عامة فقط ولا تشكل نصيحة مالية شخصية. قبل اتخاذ أي إجراء بناءً على أي معلومات واردة في هذا الموقع الإلكتروني، ينبغي عليك النظر في مدى ملاءمة هذه المعلومات لأهدافك ووضعك المالي واحتياجاتك. ينطوي الاستثمار في عقود الفروقات وعقود الهامش على الفوركس على مخاطر كبيرة، وهو غير مناسب لجميع المستثمرين. قد تخسر أكثر من إيداعك الأولي. أنت لا تملك الأصل الأساسي، ولا لديك أي مصلحة فيه. نوصي بأن تطلب مشورة مستقلة وأن تتأكد من أنك تفهم تمامًا المخاطر التي تنطوي عليها قبل التداول. من المهم أن تقرأ وثيقة الإفصاح وتدرسها قبل الحصول على أي منتج مدرج على الموقع الإلكتروني. إن المعلومات والإعلانات المعروضة على هذا الموقع الإلكتروني غير مخصصة للاستخدام من قبل أي شخص في أي بلد أو ولاية قضائية يكون فيها هذا الاستخدام مخالفًا للقوانين واللوائح المحلية. المنتجات والخدمات المعروضة على هذا الموقع الإلكتروني غير مخصصة للمقيمين في الولايات المتحدة وماليزيا وتايلاند.
TMGM مرخصة ومنظمة في ولايات قضائية مختلفة.
شركة Trademax Australia Limited، التي تتداول باسم TMGM، منظمة من قبل لجنة الأوراق المالية والاستثمارات الأسترالية (ASIC)، رقم AFSL 436416 وتقع في المستوى 28، برج دولي واحد، 100 شارع بارانجارو، 2000 سيدني، نيو ساوث ويلز أستراليا.
البريد الإلكتروني: support@tmgm.com.au
شركة Trademax Global Limited، التي تتداول باسم TMGM، مرخصة ومنظمة من قبل لجنة الخدمات المالية في فانواتو (VFSC)، رقم التسجيل 40356 ومسجلة في 1276، طريق كومول السريع، بورت فيلا، فانواتو، جمهورية فانواتو.
البريد الإلكتروني: support@tmgm.com
شركة Trademax Global Markets (SE) Limited، المعروفة باسم TMGM، مرخصة ومنظمة من قبل هيئة الخدمات المالية (FSA) في سيشيل، برقم الترخيص SD224. الشركة مسجلة في المكتب رقم 13، مركز ABIS العقاري، ماهي، سيشيل.
البريد الإلكتروني: support@tmgm.com
شركة Trademax Global Markets (International) Pty Ltd، التي تتداول باسم TMGM، مرخصة ومنظمة من قبل لجنة الخدمات المالية، موريشيوس (FSC) برقم الترخيص GB22201012، ومسجلة في 33، شارع إديث كافيل c/o IQ EQ Fund Services (Mauritius) Ltd بورت لويس، 11324 موريشيوس.
البريد الإلكتروني: support@tmgm.com
حقوق الطبع والنشر © TMGM. جميع الحقوق محفوظة