

التداول
اكتشف مجموعة متنوعة من الأسواق العالمية مع تسعير تنافسي، سيولة عالية، وأدوات تداول متقدمة تدعم قراراتك الاستثمارية.
اكتشف المزيد 
منصات التداول
تداول بسلاسة مع منصة TMGM القوية، المصممة للسرعة والدقة وتجربة تداول فائقة.
اكتشف المزيد منصات التداول
الأكاديمية
تعلّم أساسيات التداول من خلال محتوى تعليمي مُبسط ومصمم للمبتدئين، يشمل أدلة تعليمية،ندوات مباشرة عبر الإنترنت، وتحليلات لأهم تحركات السوق.
اكتشف المزيد أكاديمية TMGM
الأخبار والتحليلات
تابع أحدث تطورات الأسواق لحظة بلحظة، مع تحليلات احترافية تساعدك على اتخاذ قرارات مدروسة والاستفادة من فرص التداول.
اكتشف المزيد الأخبار والتحليلات
معلومات عنا
تعرّف على ما يميز TMGM، من حضور عالمي قوي وإشراف تنظيمي موثوق، إلى التزامنا المستمر بالابتكار وتطوير بيئة تداول متقدمة.
اكتشف المزيد لماذا TMGM؟
Ethereum Price Forecast: ETH falters as returning retail demand fails to offset ETF outflows
- Ethereum slides below $1,750 on Friday, weighed down by extreme fear in market sentiment.
- Ethereum derivatives post mild increases in futures Open Interest, but persistent ETF outflows overwhelm the bulls.
- Ethereum marks three consecutive days of declines, defined by downtrending major moving averages and weak momentum indicators.
Ethereum (ETH) continues to face intense headwinds, trading below $1,750 on Friday. Broadly, the smart contract token is down about 6% since Monday and 23% from November 1.
This persistent pullback can largely be attributed to risk-off sentiment following the Binance hack, macroeconomic pressures including sticky US inflation, and a lack of catalysts to sustain higher crypto prices.

Ethereum ETF outflows offset growing retail demand
Ethereum spot Exchange-Traded Funds (ETFs) recorded $131 million in outflows on Thursday, increasing from roughly $40 million the day before. Outflows have dominated this week, totaling $217 million through Thursday. Meanwhile, cumulative inflows continue their persistent decline to $11.3 billion, with net assets under management averaging $9.6 billion, according to SoSoValue.
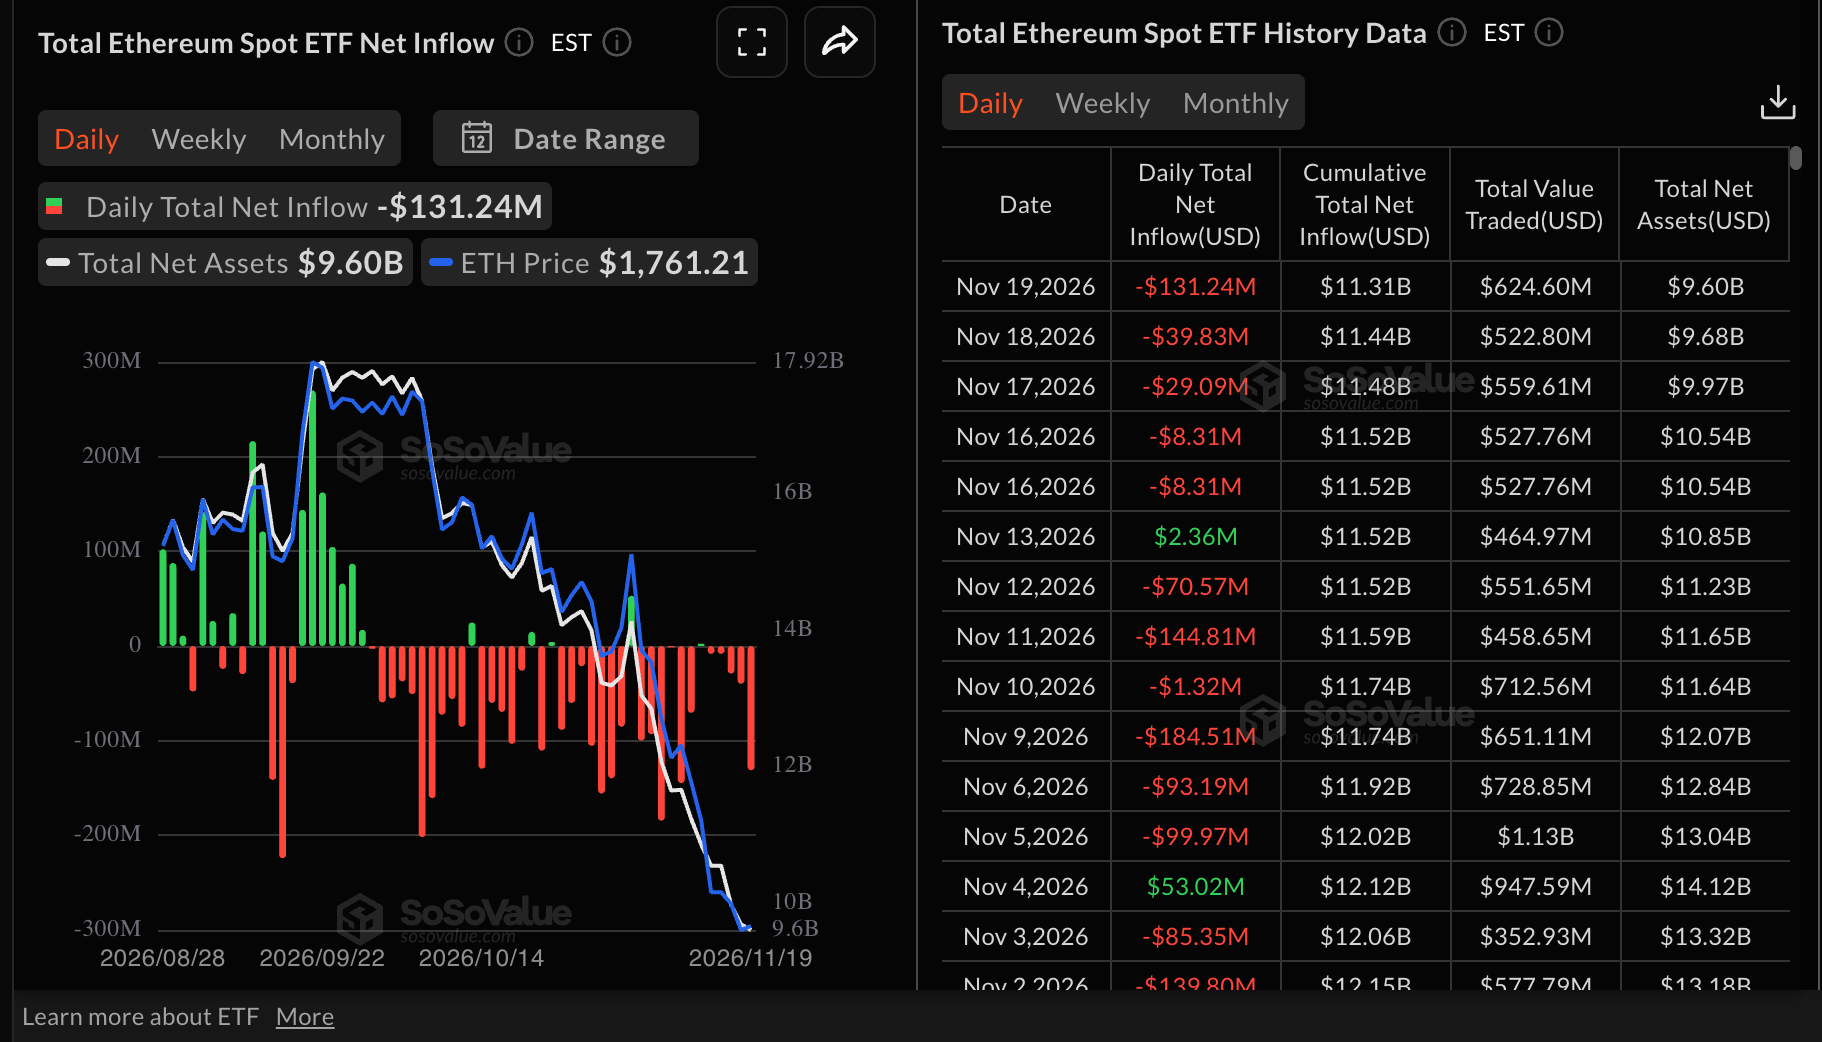
“More concerning than the price action itself is the persistent withdrawal of institutional capital,” CryptoQuant said in an emailed report, adding, “US spot Bitcoin ETFs recorded $582 million in net outflows on Thursday alone, bringing weekly withdrawals through Thursday to approximately $1.12 billion, while Ethereum ETFs shed approximately $209 million over the same four trading sessions.”
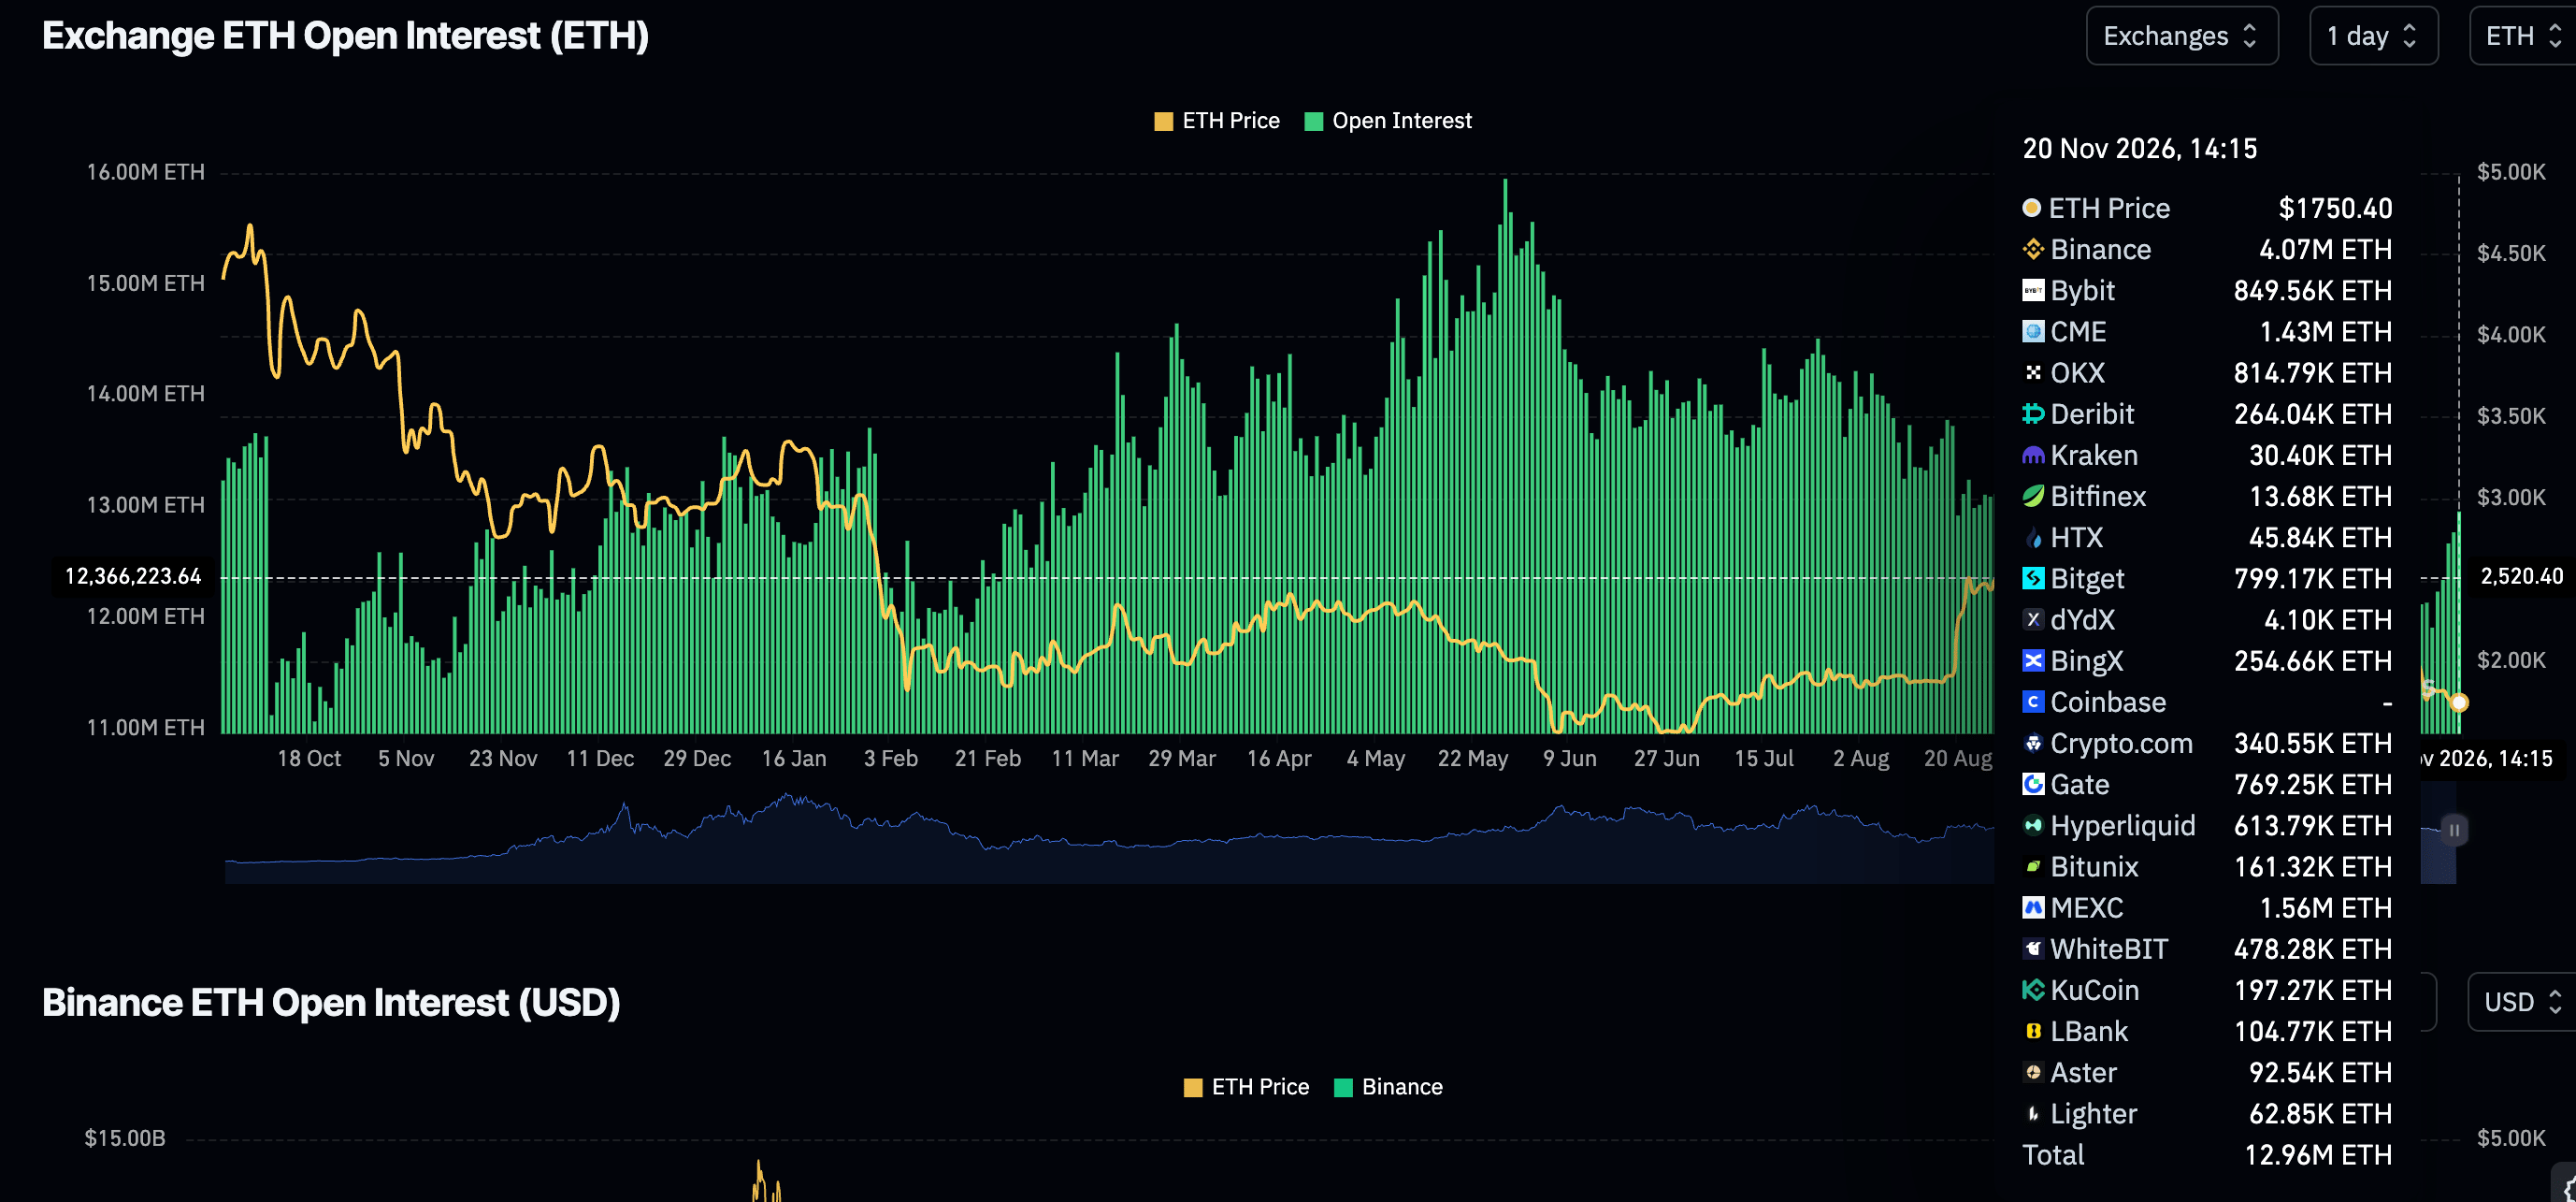
Meanwhile, retail demand is gradually returning, as evidenced by the increase in perpetual futures Open Interest (OI) to 12.96 million ETH on Friday, from 12.67 million ETH the previous day. This represents a 2.3% increase in less than two days, not to mention Monday’s OI level of 11.91 million ETH. If sustained, rising OI could support a short-term recovery outlook and encourage more traders to take on risk.
Technical analysis: Ethereum sellers retain control
Ethereum trades at $1,754, extending a bearish phase as price holds well below the 50-day, 100-day and 200-day Exponential Moving Averages (EMAs) at $2,189, $2,244 and $2,293, respectively. This stacked EMA configuration above spot suggests persistent downside pressure despite an already stretched sell-off, while the SuperTrend support line lags far below at $2,038.
Momentum remains weak, with the Moving Average Convergence Divergence (MACD) indicator deeply negative and the Relative Strength Index (RSI) slipping into oversold territory near 23, suggesting that while the trend remains biased lower, scope for an oversold bounce is building.
On the topside, initial resistance lies at the 50-day EMA around $2,189, followed by the 100-day EMA at $2,244 and the 200-day EMA near $2,293, which together form a broad cap that would need to be cleared to ease the bearish technical tone. On the downside, structural support from the SuperTrend indicator does not emerge until around $2,038, leaving the pair vulnerable to further declines while it trades beneath the clustered moving averages, even if oversold conditions later trigger corrective recovery attempts.
(The technical analysis of this story was written with the help of an AI tool. Know more.)
Open Interest, funding rate FAQs
Higher Open Interest is associated with higher liquidity and new capital inflow to the market. This is considered the equivalent of increase in efficiency and the ongoing trend continues. When Open Interest decreases, it is considered a sign of liquidation in the market, investors are leaving and the overall demand for an asset is on a decline, fueling a bearish sentiment among investors.
Funding fees bridge the difference between spot prices and prices of futures contracts of an asset by increasing liquidation risks faced by traders. A consistently high and positive funding rate implies there is a bullish sentiment among market participants and there is an expectation of a price hike. A consistently negative funding rate for an asset implies a bearish sentiment, indicating that traders expect the cryptocurrency’s price to fall and a bearish trend reversal is likely to occur.
المقالات الشائعة
1الصين: دعم السياسات يعوّض ضعف الاقتصاد الكلي – BNY2الجنيه الإسترليني: مجال أكبر للصعود أمام اليورو مقارنة بالدولار الأمريكي – BBH3الفورنت المجري: موقف البنك الوطني المجري والشكوك بشأن التضخم يضغطان على HUF – كومرتس بنك4اليورو: تدفقات رؤوس الأموال عبر الحدود تدعم العملة – MUFG5مؤشر الدولار الأمريكي (DXY) يتردد دون مستوى 104.00 مع تبدد أثر الرهانات على رفع الاحتياطي الفيدرالي للفائدة بفعل مخاوف الذكاء الاصطناعي6عائد سندات الخزانة الأمريكية لأجل 10 سنوات يتراجع دون 5% مع تفاقم موجة البيع الحادة في أسواق الأسهم العالمية7الاحتياطي الفيدرالي: الأسواق تسعّر رفع أسعار الفائدة في ديسمبر ويناير – رابوبنك8الدولار الأسترالي: ضعف بيانات التوظيف يغذي التكهنات بخفض أسعار الفائدة – كومرتس بنك9عملات أمريكا اللاتينية: الريال والبيزو تحت ضغط قوة الدولار – ING


ابدأ الآن!
سجّل وابدأ التداول في الأسواق العالمية خلال أقل من 3 دقائق

تواصل معنا









جهات الاتصال
الهاتف +61 2 8036 8388
الفاكس +61 2 8036 8388
البريد الإلكتروني support@tmgm.com
الموقع الإلكتروني https://www.tmg-max.com



المعلومات المقدمة على هذا الموقع الإلكتروني ذات طبيعة عامة فقط ولا تشكل نصيحة مالية شخصية. قبل اتخاذ أي إجراء بناءً على أي معلومات واردة في هذا الموقع الإلكتروني، ينبغي عليك النظر في مدى ملاءمة هذه المعلومات لأهدافك ووضعك المالي واحتياجاتك. ينطوي الاستثمار في عقود الفروقات وعقود الهامش على الفوركس على مخاطر كبيرة، وهو غير مناسب لجميع المستثمرين. قد تخسر أكثر من إيداعك الأولي. أنت لا تملك الأصل الأساسي، ولا لديك أي مصلحة فيه. نوصي بأن تطلب مشورة مستقلة وأن تتأكد من أنك تفهم تمامًا المخاطر التي تنطوي عليها قبل التداول. من المهم أن تقرأ وثيقة الإفصاح وتدرسها قبل الحصول على أي منتج مدرج على الموقع الإلكتروني. إن المعلومات والإعلانات المعروضة على هذا الموقع الإلكتروني غير مخصصة للاستخدام من قبل أي شخص في أي بلد أو ولاية قضائية يكون فيها هذا الاستخدام مخالفًا للقوانين واللوائح المحلية. المنتجات والخدمات المعروضة على هذا الموقع الإلكتروني غير مخصصة للمقيمين في الولايات المتحدة وماليزيا وتايلاند.
TMGM مرخصة ومنظمة في ولايات قضائية مختلفة.
شركة Trademax Australia Limited، التي تتداول باسم TMGM، منظمة من قبل لجنة الأوراق المالية والاستثمارات الأسترالية (ASIC)، رقم AFSL 436416 وتقع في المستوى 28، برج دولي واحد، 100 شارع بارانجارو، 2000 سيدني، نيو ساوث ويلز أستراليا.
البريد الإلكتروني: support@tmgm.com.au
شركة Trademax Global Limited، التي تتداول باسم TMGM، مرخصة ومنظمة من قبل لجنة الخدمات المالية في فانواتو (VFSC)، رقم التسجيل 40356 ومسجلة في 1276، طريق كومول السريع، بورت فيلا، فانواتو، جمهورية فانواتو.
البريد الإلكتروني: support@tmgm.com
شركة Trademax Global Markets (SE) Limited، المعروفة باسم TMGM، مرخصة ومنظمة من قبل هيئة الخدمات المالية (FSA) في سيشيل، برقم الترخيص SD224. الشركة مسجلة في المكتب رقم 13، مركز ABIS العقاري، ماهي، سيشيل.
البريد الإلكتروني: support@tmgm.com
شركة Trademax Global Markets (International) Pty Ltd، التي تتداول باسم TMGM، مرخصة ومنظمة من قبل لجنة الخدمات المالية، موريشيوس (FSC) برقم الترخيص GB22201012، ومسجلة في 33، شارع إديث كافيل c/o IQ EQ Fund Services (Mauritius) Ltd بورت لويس، 11324 موريشيوس.
البريد الإلكتروني: support@tmgm.com
حقوق الطبع والنشر © TMGM. جميع الحقوق محفوظة