

التداول
اكتشف مجموعة متنوعة من الأسواق العالمية مع تسعير تنافسي، سيولة عالية، وأدوات تداول متقدمة تدعم قراراتك الاستثمارية.
اكتشف المزيد 
منصات التداول
تداول بسلاسة مع منصة TMGM القوية، المصممة للسرعة والدقة وتجربة تداول فائقة.
اكتشف المزيد منصات التداول
الأكاديمية
تعلّم أساسيات التداول من خلال محتوى تعليمي مُبسط ومصمم للمبتدئين، يشمل أدلة تعليمية،ندوات مباشرة عبر الإنترنت، وتحليلات لأهم تحركات السوق.
اكتشف المزيد أكاديمية TMGM
الأخبار والتحليلات
تابع أحدث تطورات الأسواق لحظة بلحظة، مع تحليلات احترافية تساعدك على اتخاذ قرارات مدروسة والاستفادة من فرص التداول.
اكتشف المزيد الأخبار والتحليلات
معلومات عنا
تعرّف على ما يميز TMGM، من حضور عالمي قوي وإشراف تنظيمي موثوق، إلى التزامنا المستمر بالابتكار وتطوير بيئة تداول متقدمة.
اكتشف المزيد لماذا TMGM؟
Pi Network Price Forecast: PI remains under pressure near record lows as bears dominate
- Pi Network remains under pressure on Monday after setting a fresh all-time low near $0.0600 on Saturday.
- Derivatives positioning points to persistent bearish sentiment among PI traders.
- The technical outlook remains bearish, with PI hovering near record-low territory as sellers retain control.
Pi Network (PI) extends its decline on Monday, approaching the all-time low (ATL) of $0.0600 recorded over the weekend. Bearish sentiment in the derivatives market adds to selling pressure, and a deteriorating technical outlook suggests that downside risks remain elevated, leaving PI vulnerable to fresh lows if sellers maintain control.

Derivatives metrics suggest deeper correction
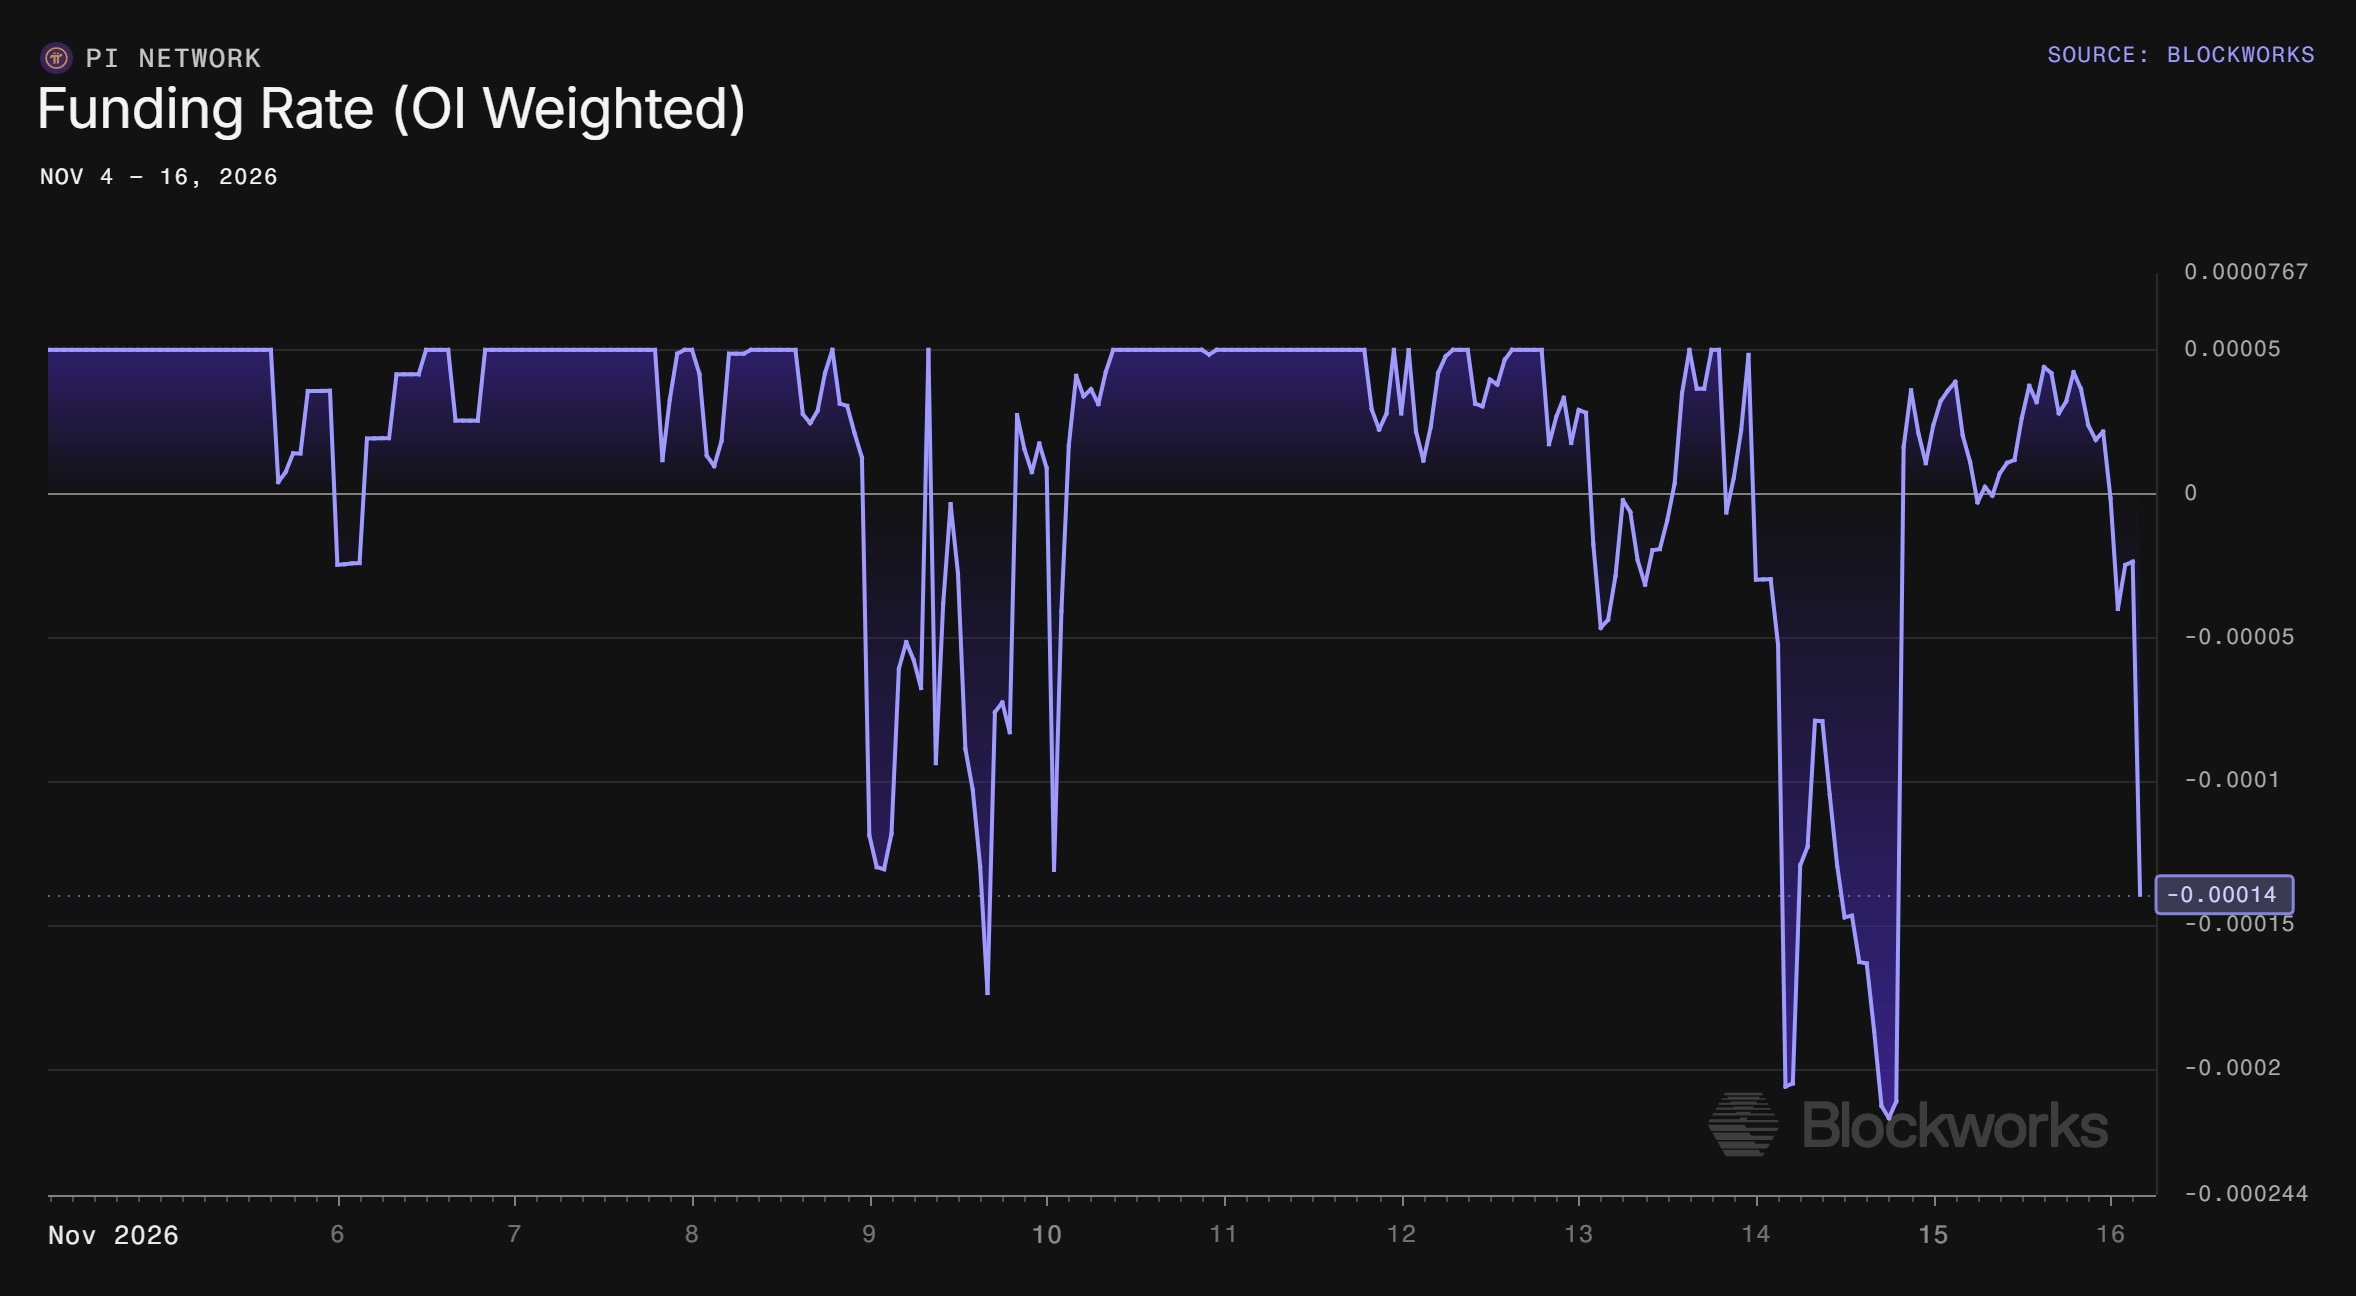
Derivatives positioning points to persistent bearish sentiment for Pi Network. The Blockworks chart below shows that PI's Open Interest (OI)-weighted funding rate turned negative, dropping to -0.00014% on Monday, indicating that shorts are paying longs and dominating perpetual futures positioning.
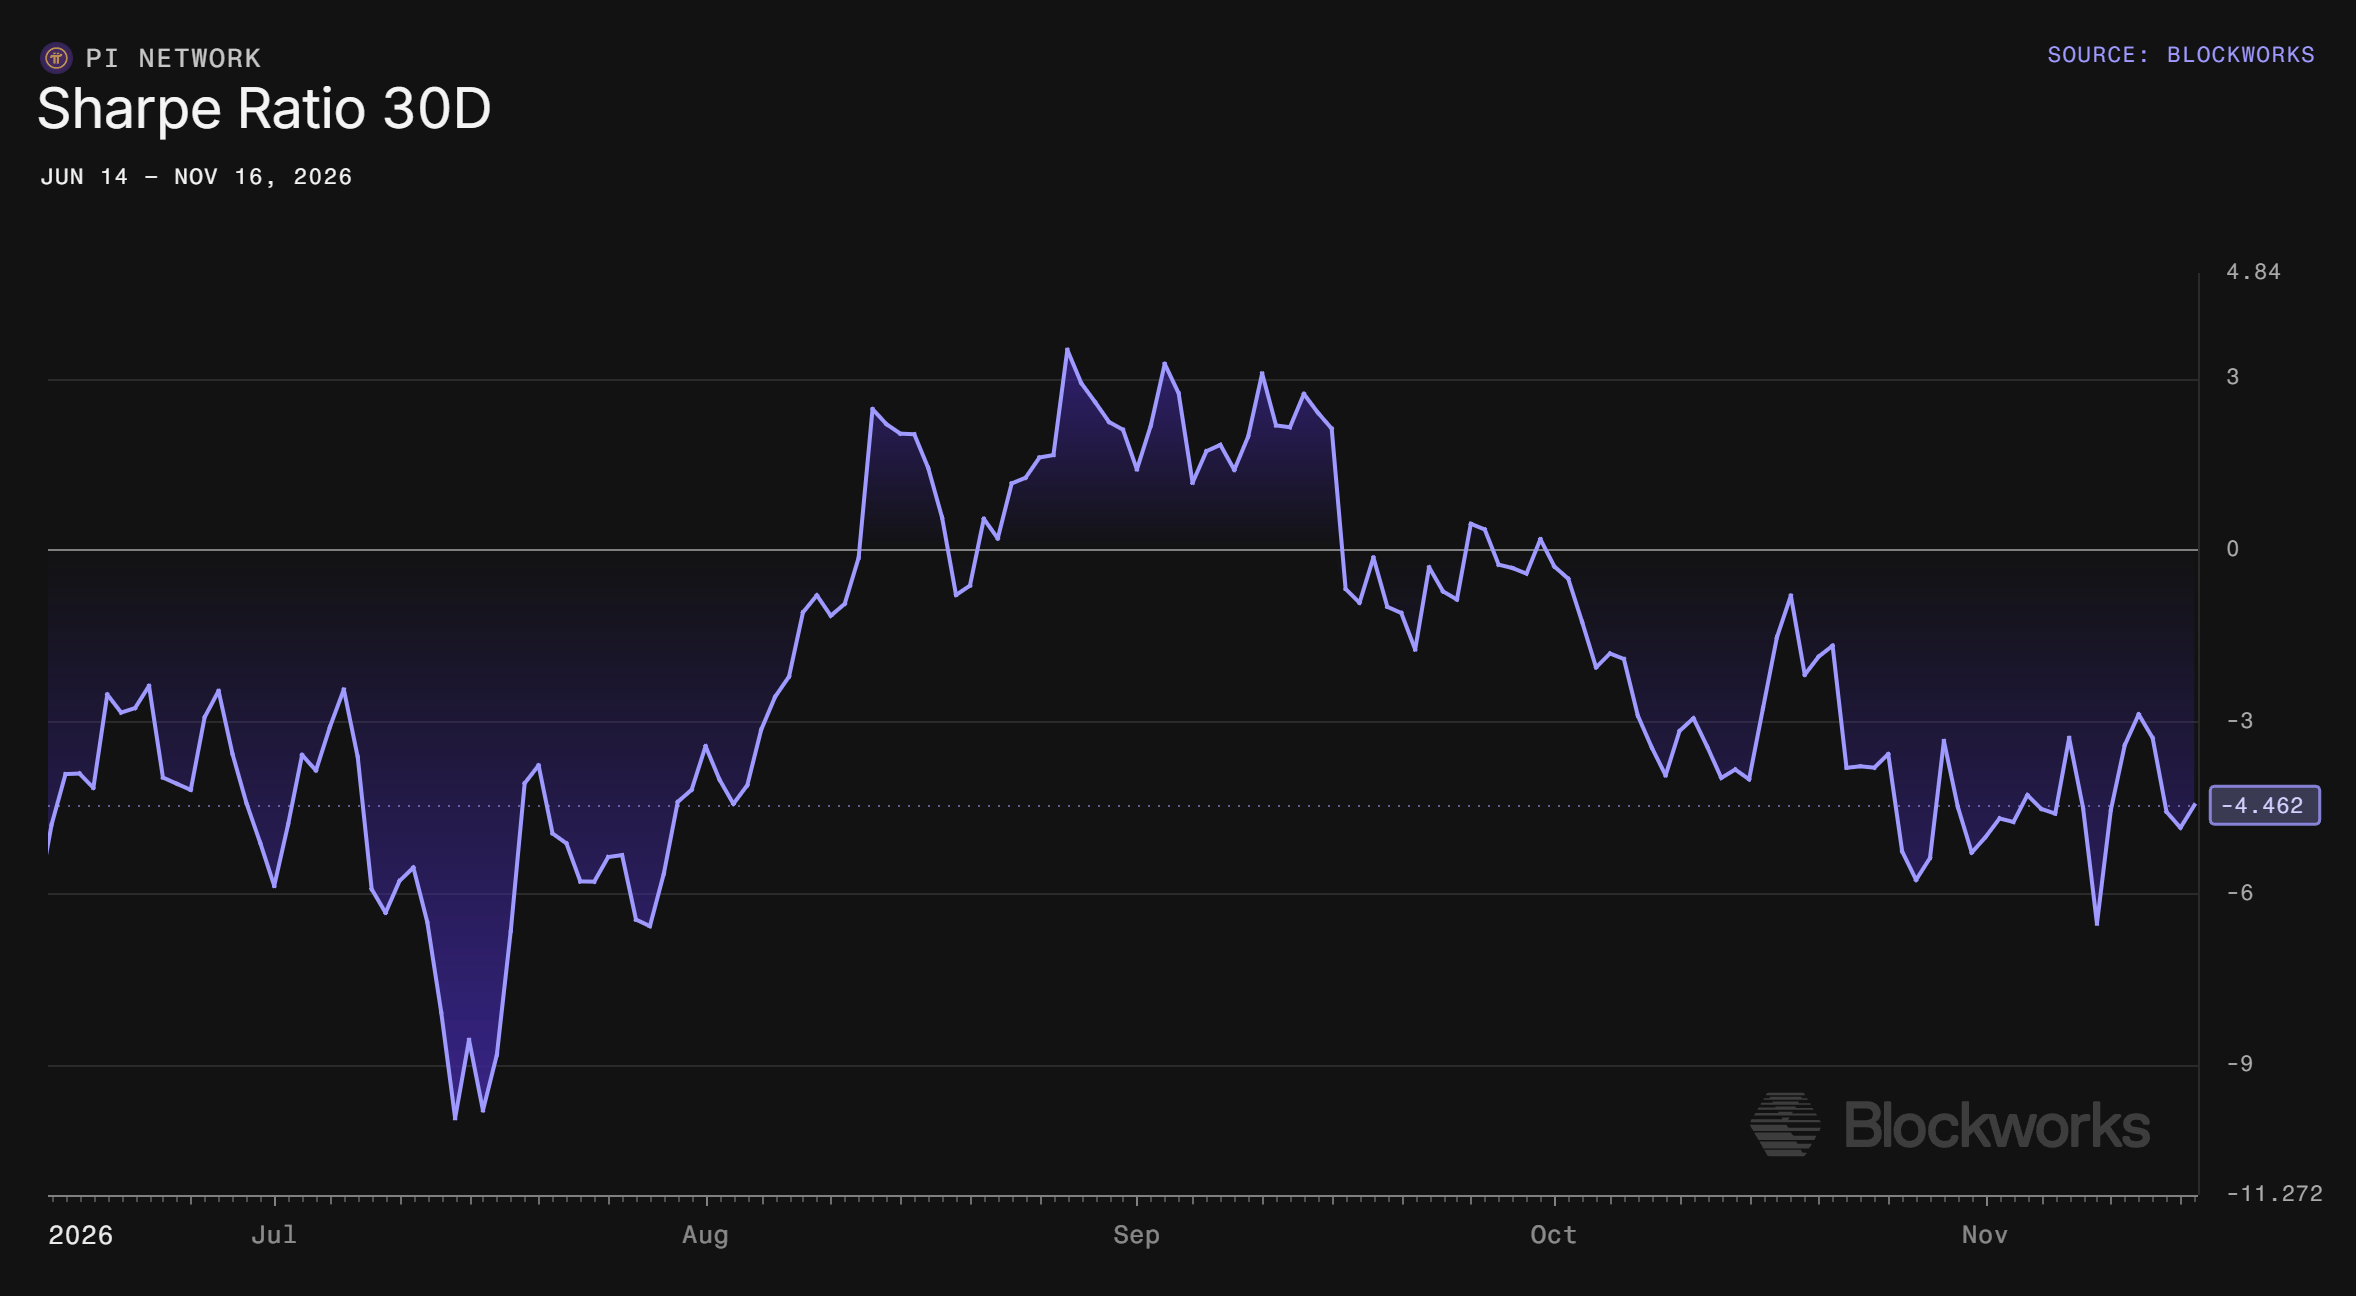
In addition, the 30-day Sharpe ratio has fallen to -4.462 on Monday, highlighting deteriorating risk-adjusted returns as Pi Network's recent decline continues to weigh on market performance. Moreover, the metric has remained below zero since October, suggesting that investors continue to face negative returns relative to the volatility they are exposed to.
Together, both the OI-weighted funding rate and the 30-day Sharpe ratio suggest that bearish sentiment remains dominant among PI traders.
Pi Network Price Forecast: Is PI heading to set a new record low?
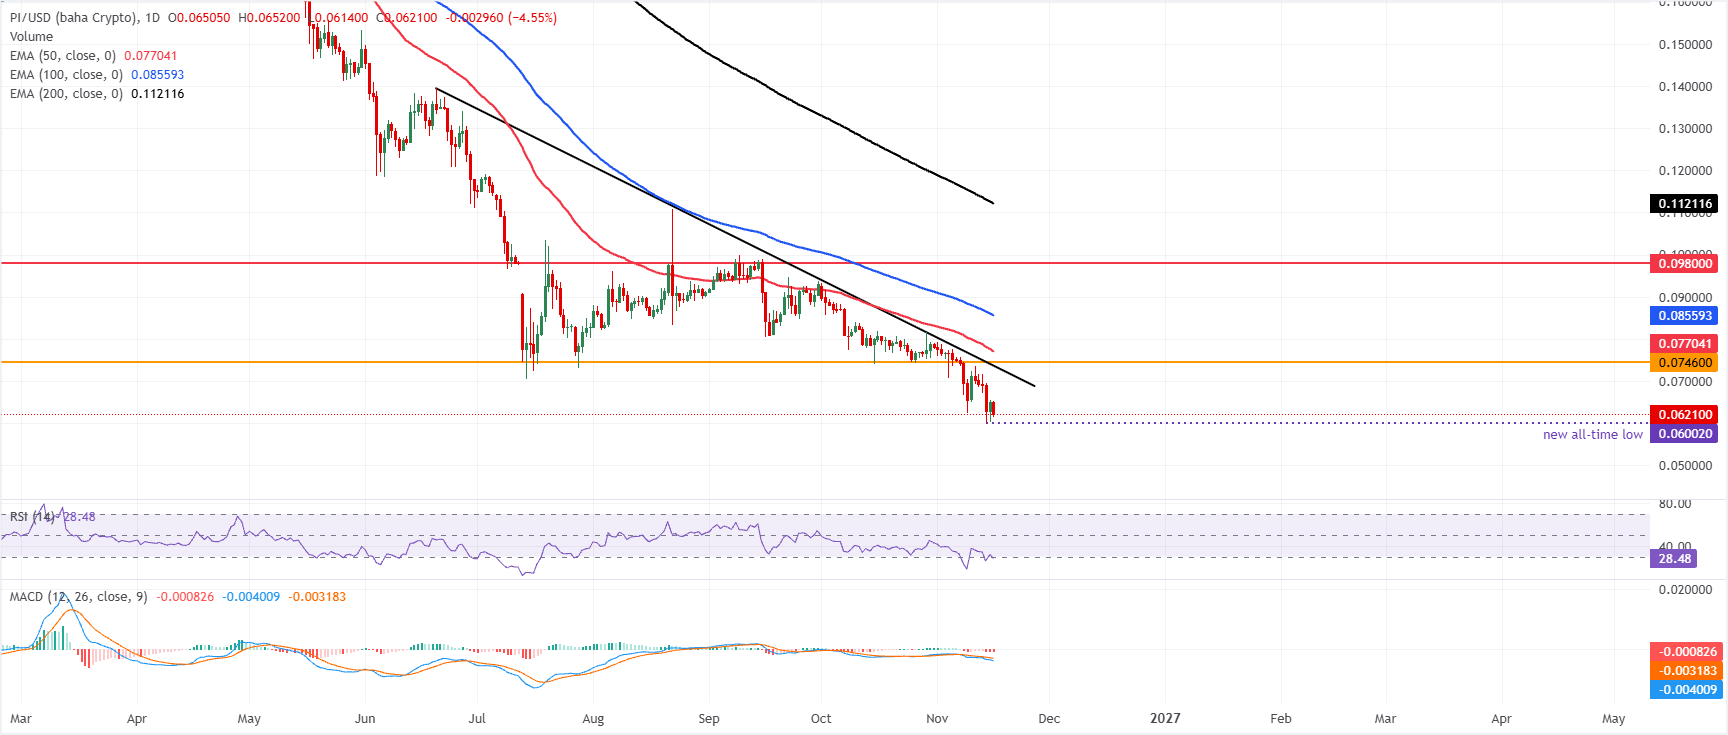
Pi Network price trades at $0.062 at the time of writing on Monday, after setting a fresh all-time low near $0.0600 on Saturday. In addition, PI is extending its slide well below the main Exponential Moving Averages (EMAs) and keeping the near-term bias firmly bearish.
The 50-day EMA at $0.077, the 100-day EMA at $0.085 and the 200-day EMA at $0.112 all sit overhead and collectively suggest a capped market while price remains beneath them.
Momentum reinforces this weak tone on the daily chart, with the Relative Strength Index (RSI) hovering in oversold territory near 28 and the Moving Average Convergence Divergence (MACD) with a negative histogram, hinting at persistent downside pressure despite the stretched conditions.
On the topside, initial resistance appears near the downward trendline at $0.073, followed by a horizontal barrier at $0.074, forming a first supply cluster just above current levels. A stronger recovery would face further resistance at the 50-day EMA at $0.077 and then the 100-day EMA at $0.085, ahead of the more distant horizontal cap at $0.098 and the 200-day EMA at $0.112.
With no clear structural support levels defined below $0.061, the pair remains vulnerable to further declines until buyers can reclaim the nearer resistance band and start building a base.
(The technical analysis of this story was written with the help of an AI tool. Know more.)
المقالات الشائعة
1الجنيه الإسترليني: توقعات بهبوط محدود دون 1.3200 مقابل الدولار الأمريكي – UOB2اليورو يقترب من منطقة 1.1000 مع دعم نبرة الاحتياطي الفيدرالي المتشددة للدولار الأمريكي3الدولار الأسترالي يواصل تراجعه إلى منتصف نطاق 0.6700، مسجلاً أدنى مستوى جديد منذ يناير أمام الدولار الأمريكي الصاعد4اليورو: استمرار الميل الهبوطي مقابل الدولار الأمريكي – Danske Bank5الفضة: التعافي يواجه ضغوط بيع متجددة – OCBC6الين الياباني يقلّص مكاسبه السابقة مع كبح بيانات الناتج المحلي الإجمالي الياباني الضعيفة زخم المشترين7توقعات أسعار الفضة: XAG/USD يهبط دون 47.50 دولار؛ ويسجل أدنى مستوى جديد منذ بداية العام مع استمرار التراجع8الأسهم: موجة بيع أسهم Nvidia تضغط على الأسواق الآسيوية - دويتشه بنك9سوق الفوركس اليوم: الحذر يسود الأسواق مع بداية الأسبوع والدولار الأمريكي يحافظ على قوته


ابدأ الآن!
سجّل وابدأ التداول في الأسواق العالمية خلال أقل من 3 دقائق

تواصل معنا









جهات الاتصال
الهاتف +61 2 8036 8388
الفاكس +61 2 8036 8388
البريد الإلكتروني support@tmgm.com
الموقع الإلكتروني https://www.tmg-max.com



المعلومات المقدمة على هذا الموقع الإلكتروني ذات طبيعة عامة فقط ولا تشكل نصيحة مالية شخصية. قبل اتخاذ أي إجراء بناءً على أي معلومات واردة في هذا الموقع الإلكتروني، ينبغي عليك النظر في مدى ملاءمة هذه المعلومات لأهدافك ووضعك المالي واحتياجاتك. ينطوي الاستثمار في عقود الفروقات وعقود الهامش على الفوركس على مخاطر كبيرة، وهو غير مناسب لجميع المستثمرين. قد تخسر أكثر من إيداعك الأولي. أنت لا تملك الأصل الأساسي، ولا لديك أي مصلحة فيه. نوصي بأن تطلب مشورة مستقلة وأن تتأكد من أنك تفهم تمامًا المخاطر التي تنطوي عليها قبل التداول. من المهم أن تقرأ وثيقة الإفصاح وتدرسها قبل الحصول على أي منتج مدرج على الموقع الإلكتروني. إن المعلومات والإعلانات المعروضة على هذا الموقع الإلكتروني غير مخصصة للاستخدام من قبل أي شخص في أي بلد أو ولاية قضائية يكون فيها هذا الاستخدام مخالفًا للقوانين واللوائح المحلية. المنتجات والخدمات المعروضة على هذا الموقع الإلكتروني غير مخصصة للمقيمين في الولايات المتحدة وماليزيا وتايلاند.
TMGM مرخصة ومنظمة في ولايات قضائية مختلفة.
شركة Trademax Australia Limited، التي تتداول باسم TMGM، منظمة من قبل لجنة الأوراق المالية والاستثمارات الأسترالية (ASIC)، رقم AFSL 436416 وتقع في المستوى 28، برج دولي واحد، 100 شارع بارانجارو، 2000 سيدني، نيو ساوث ويلز أستراليا.
البريد الإلكتروني: support@tmgm.com.au
شركة Trademax Global Limited، التي تتداول باسم TMGM، مرخصة ومنظمة من قبل لجنة الخدمات المالية في فانواتو (VFSC)، رقم التسجيل 40356 ومسجلة في 1276، طريق كومول السريع، بورت فيلا، فانواتو، جمهورية فانواتو.
البريد الإلكتروني: support@tmgm.com
شركة Trademax Global Markets (SE) Limited، المعروفة باسم TMGM، مرخصة ومنظمة من قبل هيئة الخدمات المالية (FSA) في سيشيل، برقم الترخيص SD224. الشركة مسجلة في المكتب رقم 13، مركز ABIS العقاري، ماهي، سيشيل.
البريد الإلكتروني: support@tmgm.com
شركة Trademax Global Markets (International) Pty Ltd، التي تتداول باسم TMGM، مرخصة ومنظمة من قبل لجنة الخدمات المالية، موريشيوس (FSC) برقم الترخيص GB22201012، ومسجلة في 33، شارع إديث كافيل c/o IQ EQ Fund Services (Mauritius) Ltd بورت لويس، 11324 موريشيوس.
البريد الإلكتروني: support@tmgm.com
حقوق الطبع والنشر © TMGM. جميع الحقوق محفوظة