

التداول
اكتشف مجموعة متنوعة من الأسواق العالمية مع تسعير تنافسي، سيولة عالية، وأدوات تداول متقدمة تدعم قراراتك الاستثمارية.
اكتشف المزيد 
منصات التداول
تداول بسلاسة مع منصة TMGM القوية، المصممة للسرعة والدقة وتجربة تداول فائقة.
اكتشف المزيد منصات التداول
الأكاديمية
تعلّم أساسيات التداول من خلال محتوى تعليمي مُبسط ومصمم للمبتدئين، يشمل أدلة تعليمية،ندوات مباشرة عبر الإنترنت، وتحليلات لأهم تحركات السوق.
اكتشف المزيد أكاديمية TMGM
الأخبار والتحليلات
تابع أحدث تطورات الأسواق لحظة بلحظة، مع تحليلات احترافية تساعدك على اتخاذ قرارات مدروسة والاستفادة من فرص التداول.
اكتشف المزيد الأخبار والتحليلات
معلومات عنا
تعرّف على ما يميز TMGM، من حضور عالمي قوي وإشراف تنظيمي موثوق، إلى التزامنا المستمر بالابتكار وتطوير بيئة تداول متقدمة.
اكتشف المزيد لماذا TMGM؟
USD/CAD Price Forecast; Dollar picks up above 1.4000 as Oil prices hit the CAD
- USD/CAD returns above 1.4000 after bouncing from five-month lows near 1.3960 on Friday.
- The US Dollar trims losses ahead of the Fed's decision, while lower oil prices are weighing on the CAD.
- The pair is showing initial signs of bottoming after depreciating 2% over the previous two weeks.
The US Dollar (USD) is trimming some losses against the Canadian Dollar (CAD) on Monday as investors brace for the US Federal Reserve (Fed) monetary policy decision, due on Wednesday, while lower Oil prices hurt the commodity-sensitive Loonie. The USD/CAD pair is trading at 1.4023 after bouncing from Friday’s lows at 1.3968 lows on Friday although the broader trend remains bearish, after a nearly 2% selloff over the previous two weeks.
The Greenback is trading higher against its main peers in a calm session on Monday, as investors shift their focus back to the Fed's monetary policy decision. The bank is widely expected to leave rates on hold after having hiked them in September, but the high inflation risks have fuelled expectations of a second quarter-point hike in December.
Beyond that, Oil prices have dropped about 2% from Friday’s highs, increasing pressure on the Loonie. The barrel of Brent Oil trades around $110.30 as of writing, down from Friday’s highs near $ 113.00. News that Qatari negotiators have arrived in Tehran to try to de-escalate the conflict with the US has been welcomed by the market, while US President Trump has discarded any new attacks on Iran before the mid-term elections, which contributed to easing pressure on prices.
Technical Analysis: Friday's "Hammer" candle hints at a potential bullish reversal
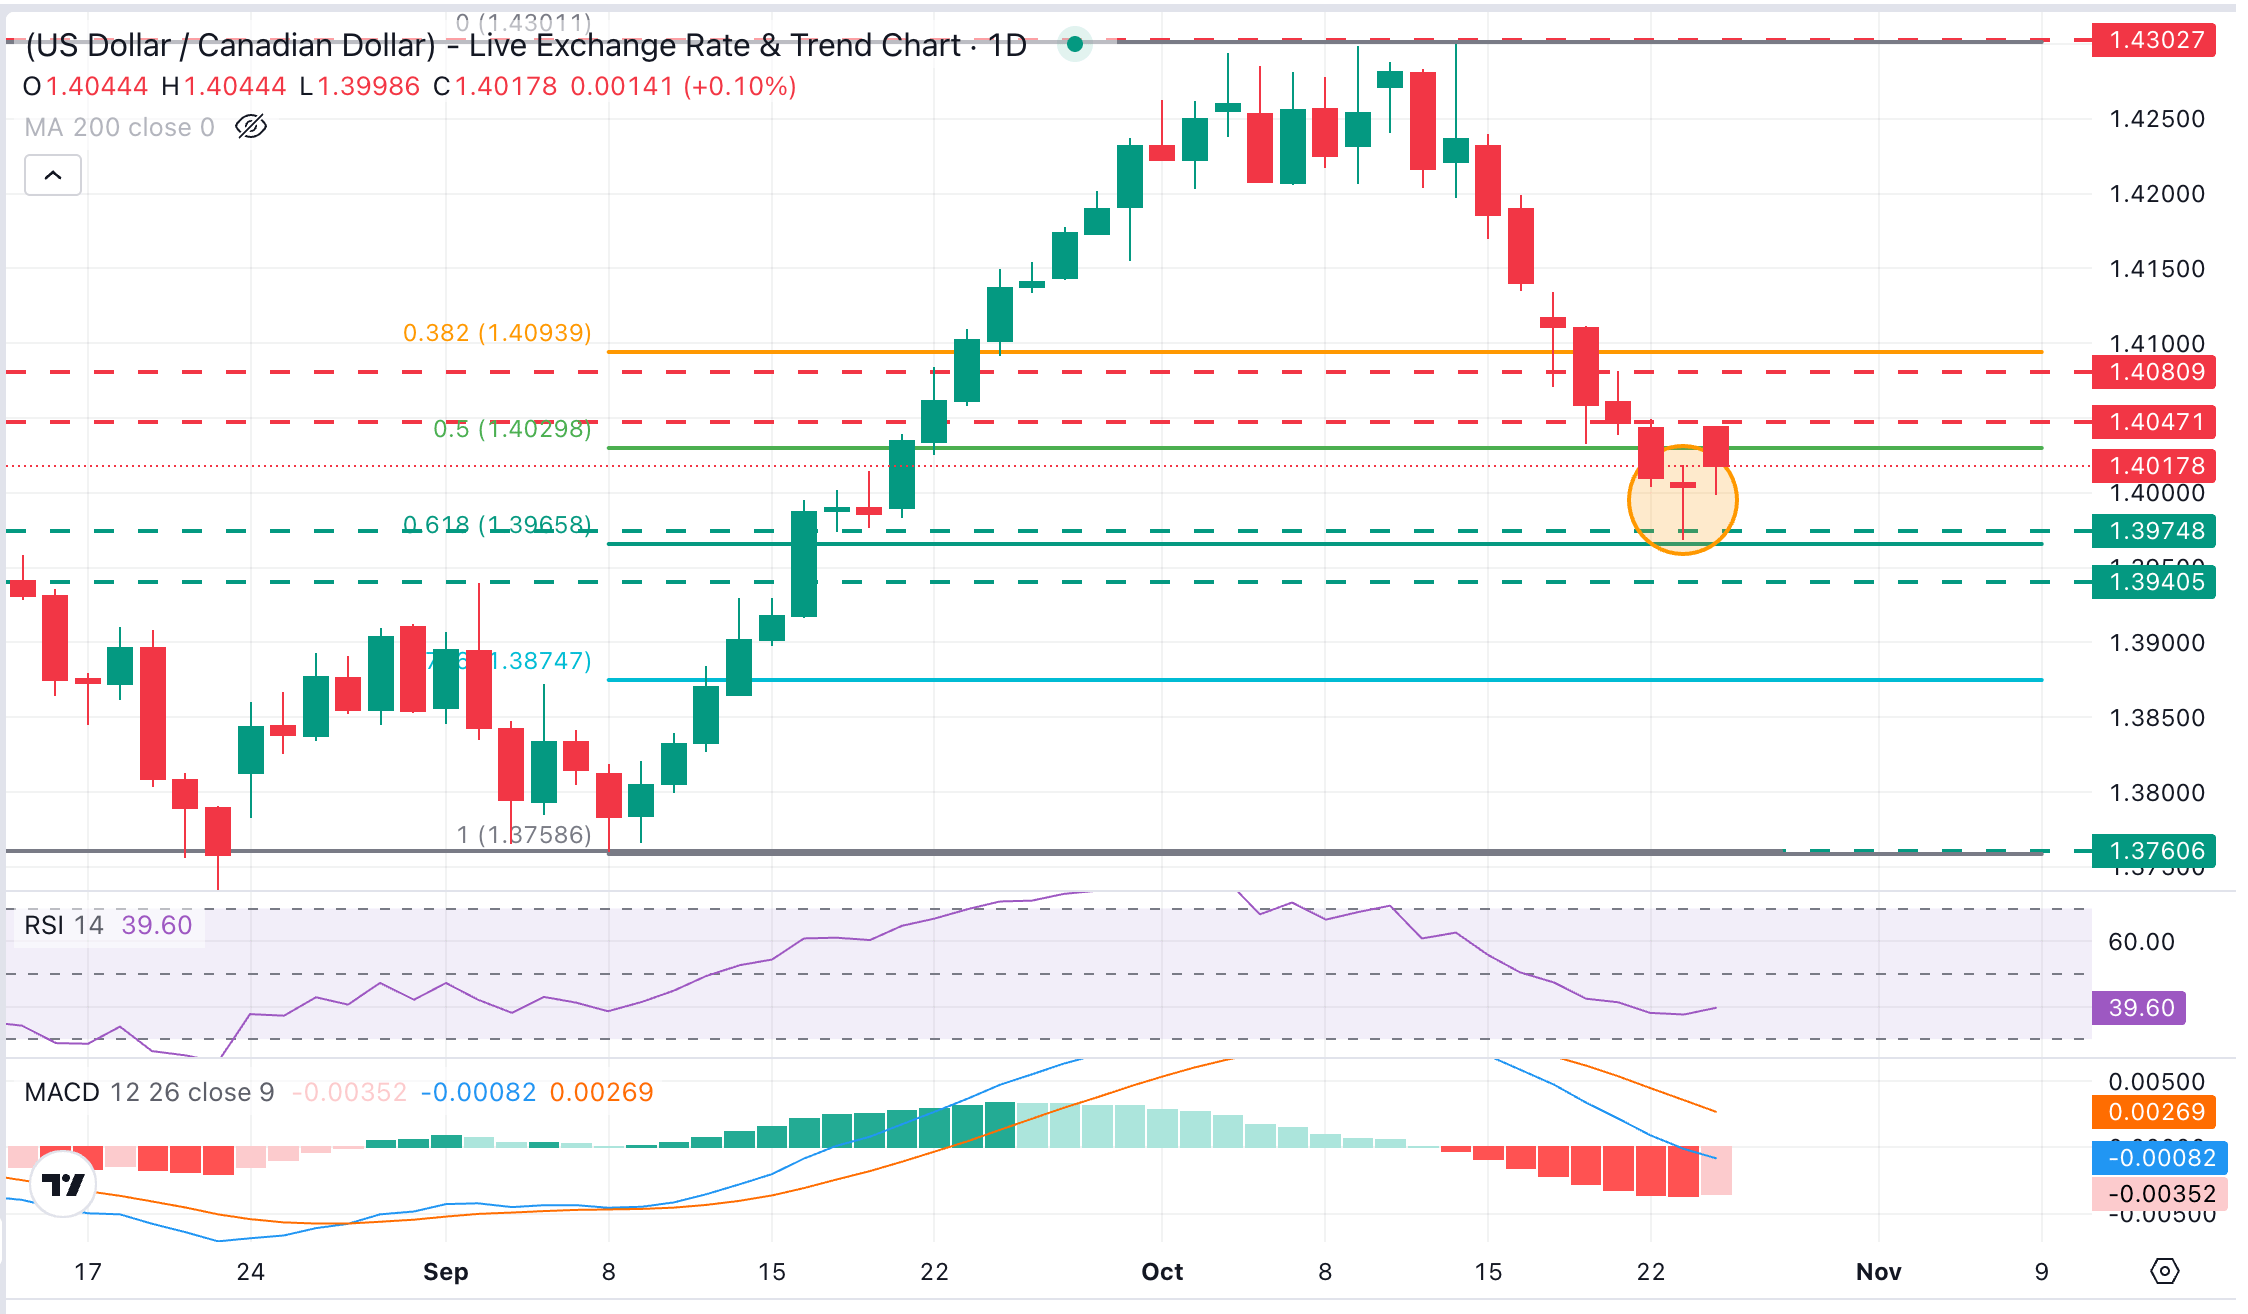
USD/CAD trades at 1.4018, with the pair showing a capped tone, yet with recent price action showing a "hammer" candle on Friday, a figure often anticipating a bullish reversal. Momentum indicators in the daily chart, however, are still at negative levels. The Relative Strength Index (14) remains below 40, with the Moving Average Convergence Divergence (MACD) well within negative territory, altogether reinforcing the idea that rallies could struggle.
Bulls remain capped below Thursday's high, at the 1.4040 area, which closes the path towards the October 19 low and October 21 high in the 1.4080 area.
On the downside, initial support is clustered around the September 17 and 18 lows in the 1.3975 area and the 61.8% Fibonacci retracement of the September - October rally, at 1.3965. Further down, the September 2 high, near 1.3940, and the 78.2% Fibonacci retracement, at 1.3874, would come into focus.
(The technical analysis of this story was written with the help of an AI tool. Know more.)
Canadian Dollar Price Today
The table below shows the percentage change of Canadian Dollar (CAD) against listed major currencies today. Canadian Dollar was the strongest against the Japanese Yen.
| USD | EUR | GBP | JPY | CAD | AUD | NZD | CHF | |
|---|---|---|---|---|---|---|---|---|
| USD | 0.12% | 0.19% | 0.43% | 0.10% | 0.17% | 0.35% | 0.20% | |
| EUR | -0.12% | 0.11% | 0.26% | -0.03% | 0.05% | 0.25% | 0.09% | |
| GBP | -0.19% | -0.11% | 0.17% | -0.12% | -0.06% | 0.14% | -0.02% | |
| JPY | -0.43% | -0.26% | -0.17% | -0.29% | -0.25% | -0.05% | -0.21% | |
| CAD | -0.10% | 0.03% | 0.12% | 0.29% | 0.04% | 0.26% | 0.10% | |
| AUD | -0.17% | -0.05% | 0.06% | 0.25% | -0.04% | 0.21% | 0.03% | |
| NZD | -0.35% | -0.25% | -0.14% | 0.05% | -0.26% | -0.21% | -0.15% | |
| CHF | -0.20% | -0.09% | 0.02% | 0.21% | -0.10% | -0.03% | 0.15% |
The heat map shows percentage changes of major currencies against each other. The base currency is picked from the left column, while the quote currency is picked from the top row. For example, if you pick the Canadian Dollar from the left column and move along the horizontal line to the US Dollar, the percentage change displayed in the box will represent CAD (base)/USD (quote).
المقالات الشائعة
1الدولار النيوزيلندي يرتفع مقتربًا من 0.5700 مع تزايد الرهانات على رفع بنك الاحتياطي النيوزيلندي أسعار الفائدة2الين الياباني يستقر قرب أعلى مستوى في شهر مقابل الدولار الأمريكي الضعيف مع ترقّب المتداولين اجتماعي الاحتياطي الفيدرالي وبنك اليابان3توقعات أسعار الفضة: XAG/USD يتراجع دون 54.00 دولارًا مع انحسار الطلب على الملاذات الآمنة4اليورو يرتفع قليلًا فوق مستوى 1.1200 رغم المخاوف بشأن الديون الفرنسية5الجنيه الإسترليني يرتفع قليلاً مقابل الدولار الأمريكي الضعيف مع استمرار تركيز الأنظار على اجتماع اللجنة الفيدرالية للسوق المفتوحة هذا الأسبوع6الدولار الكندي يرتفع رغم انخفاض أسعار النفط7بنك الشعب الصيني يحدد السعر المرجعي لزوج USD/CNY عند 6.7162 مقابل 6.7180 سابقًا8خام غرب تكساس الوسيط يتراجع إلى قرب 101.00 مع استبعاد ترامب شن ضربات وشيكة على إيران9الدولار الأسترالي يتراجع رغم تحذيرات بنك الاحتياطي الأسترالي من رفع أسعار الفائدة
أسعار مباشرة

كل شيء عن OIL
تداول النفط الخام: فرصة أم مخاطرة؟
علاقة النفط والذهب بأزواج العملات: دليل التداول الأمثل
قرارات أسعار الفائدة وكيف تتداول عليها بنجاح
الذهب والنفط: اللغة الأم لأسواق الشرق الأوسط
التداول المدفوع بالأحداث في النفط
بناء نظام تداول خاص بك:
الخريطة نحو الربحية المنهجية
الدعم والمقاومة : الدليل العملي الشامل
أنواع التحليل في الفوركس: الفني والأساسي والوجداني
كيف تختار وسيط فوركس موثوق؟ 7 معايير أساسية
ابدأ الآن!
سجّل وابدأ التداول في الأسواق العالمية خلال أقل من 3 دقائق

تواصل معنا









جهات الاتصال
الهاتف +61 2 8036 8388
الفاكس +61 2 8036 8388
البريد الإلكتروني support@tmgm.com
الموقع الإلكتروني https://www.tmg-max.com/en



المعلومات المقدمة على هذا الموقع الإلكتروني ذات طبيعة عامة فقط ولا تشكل نصيحة مالية شخصية. قبل اتخاذ أي إجراء بناءً على أي معلومات واردة في هذا الموقع الإلكتروني، ينبغي عليك النظر في مدى ملاءمة هذه المعلومات لأهدافك ووضعك المالي واحتياجاتك. ينطوي الاستثمار في عقود الفروقات وعقود الهامش على الفوركس على مخاطر كبيرة، وهو غير مناسب لجميع المستثمرين. قد تخسر أكثر من إيداعك الأولي. أنت لا تملك الأصل الأساسي، ولا لديك أي مصلحة فيه. نوصي بأن تطلب مشورة مستقلة وأن تتأكد من أنك تفهم تمامًا المخاطر التي تنطوي عليها قبل التداول. من المهم أن تقرأ وثيقة الإفصاح وتدرسها قبل الحصول على أي منتج مدرج على الموقع الإلكتروني. إن المعلومات والإعلانات المعروضة على هذا الموقع الإلكتروني غير مخصصة للاستخدام من قبل أي شخص في أي بلد أو ولاية قضائية يكون فيها هذا الاستخدام مخالفًا للقوانين واللوائح المحلية. المنتجات والخدمات المعروضة على هذا الموقع الإلكتروني غير مخصصة للمقيمين في الولايات المتحدة وماليزيا وتايلاند.
TMGM مرخصة ومنظمة في ولايات قضائية مختلفة.
شركة Trademax Australia Limited، التي تتداول باسم TMGM، منظمة من قبل لجنة الأوراق المالية والاستثمارات الأسترالية (ASIC)، رقم AFSL 436416 وتقع في المستوى 28، برج دولي واحد، 100 شارع بارانجارو، 2000 سيدني، نيو ساوث ويلز أستراليا.
البريد الإلكتروني: support@tmgm.com.au
شركة Trademax Global Limited، التي تتداول باسم TMGM، مرخصة ومنظمة من قبل لجنة الخدمات المالية في فانواتو (VFSC)، رقم التسجيل 40356 ومسجلة في 1276، طريق كومول السريع، بورت فيلا، فانواتو، جمهورية فانواتو.
البريد الإلكتروني: support@tmgm.com
شركة Trademax Global Markets (SE) Limited، المعروفة باسم TMGM، مرخصة ومنظمة من قبل هيئة الخدمات المالية (FSA) في سيشيل، برقم الترخيص SD224. الشركة مسجلة في المكتب رقم 13، مركز ABIS العقاري، ماهي، سيشيل.
البريد الإلكتروني: support@tmgm.com
شركة Trademax Global Markets (International) Pty Ltd، التي تتداول باسم TMGM، مرخصة ومنظمة من قبل لجنة الخدمات المالية، موريشيوس (FSC) برقم الترخيص GB22201012، ومسجلة في 33، شارع إديث كافيل c/o IQ EQ Fund Services (Mauritius) Ltd بورت لويس، 11324 موريشيوس.
البريد الإلكتروني: support@tmgm.com
حقوق الطبع والنشر © TMGM. جميع الحقوق محفوظة