

Trading
Explore a wide range of markets with competitive pricing, deep liquidity, and advanced trading tools.
Learn More 
Platform
Trade seamlessly with TMGM's powerful platform, built for speed, precision, and a superior trading experience.
Learn More Trading Platform
Academy
Learn the fundamentals of trading with beginner-friendly resources, including guides, webinars, and market insights.
Learn More News & Analysis
Get real-time market updates and expert analysis to stay ahead of trading opportunities
Learn More News & Analysis
About
Learn what sets TMGM apart — our global presence, regulatory strength, and commitment to innovation in trading.
Learn More Why Choose TMGM
Sponsorship
Bitcoin, Ethereum, XRP retreat despite net ETF inflows: Crypto today
- $528 million in ETF inflows proves insufficient to absorb selling pressure. Bitcoin retreats towards the $80,000-$82,000 support band.
- $2,400 comes into view for Ethereum as renewed selling threatens to dictate the trend, despite a return to ETF inflows.
- The 100-day EMA gives way for XRP as sellers regain momentum, eyeing lows beneath $1.30.
$82,000 is Bitcoin’s (BTC) approximate trading level on Thursday. The cryptocurrency is leading a wider market correction after an early-week recovery attempt stalled. Having tested support near $80,000, BTC failed to clear the $84,000 barrier, with buyer fatigue prompting the current retreat.

Near $2,400, Ethereum (ETH) is also losing ground, reflecting Bitcoin’s weaker outlook. Ripple’s (XRP) retreat towards $1.30 further underscores the fragile technical backdrop and increases the likelihood of prolonged selling.
ETF inflows return despite persistent headwinds
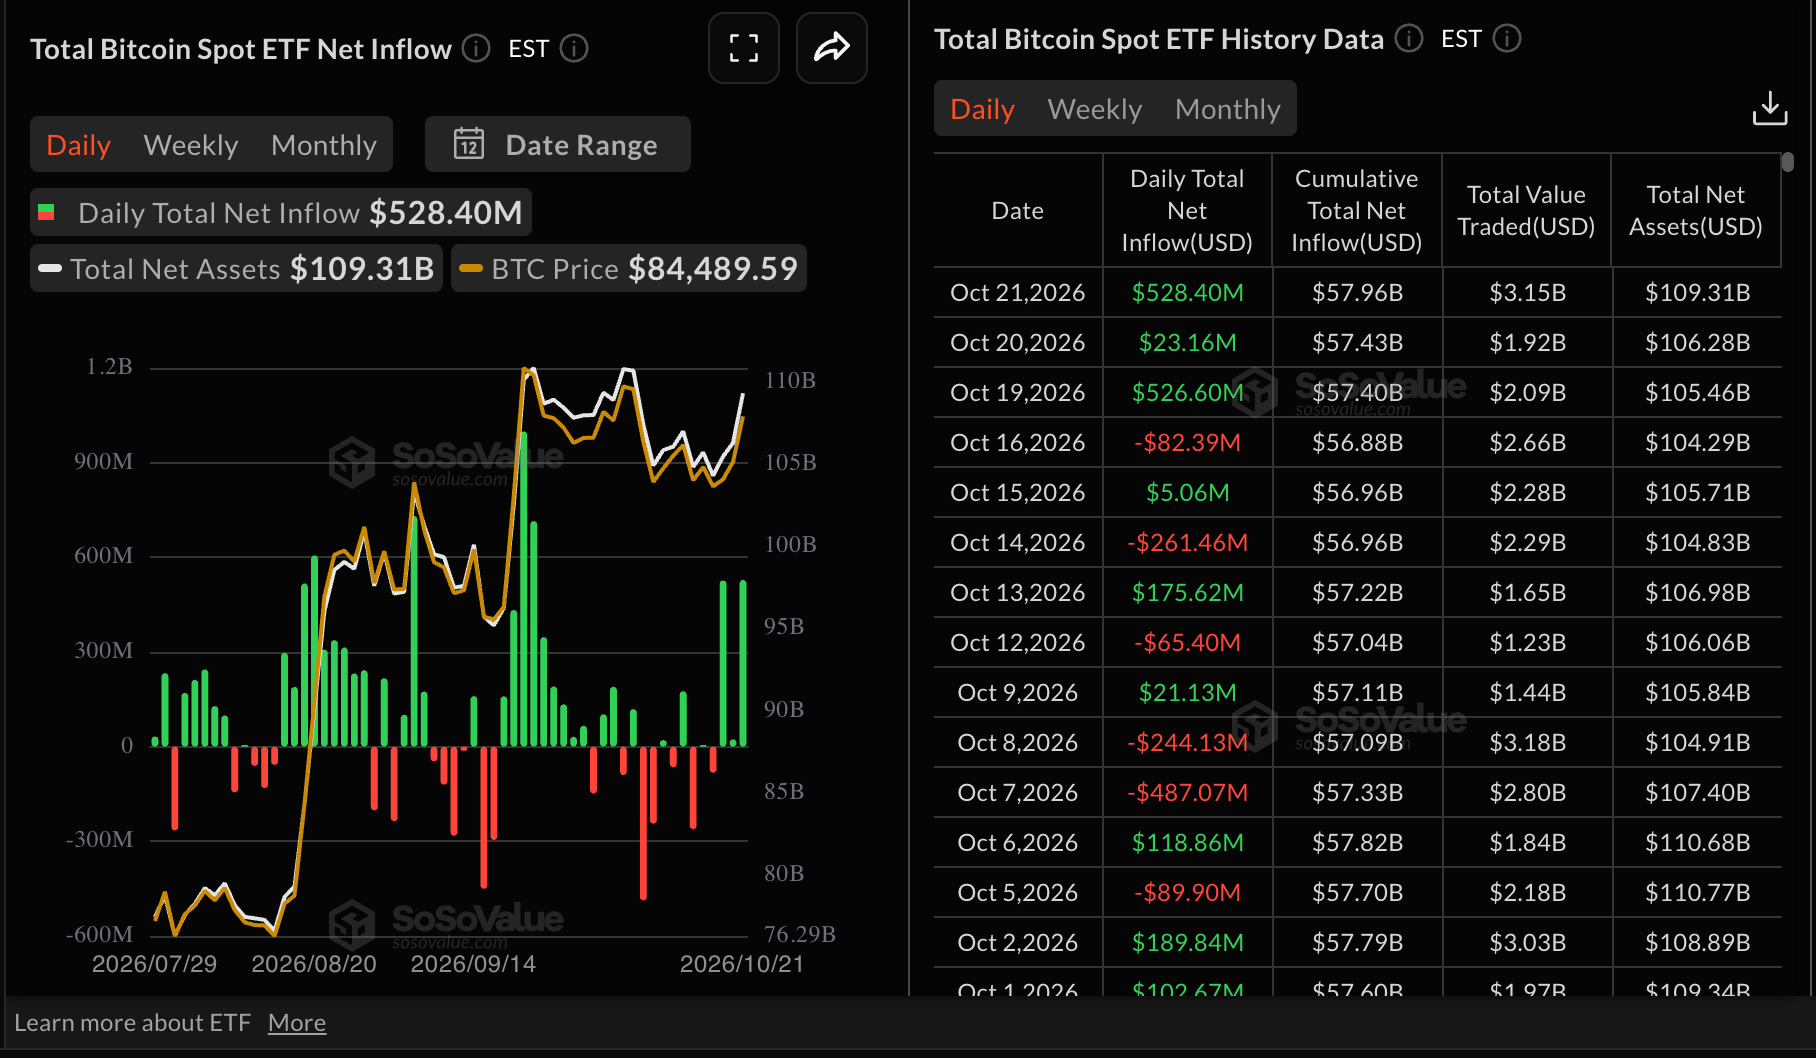
Wednesday brought approximately $528 million into Bitcoin spot Exchange-Traded Funds (ETFs), compared with $23 million on Tuesday. This week’s uptake signals sustained demand for digital asset investment products despite market volatility. Cumulative inflows reached $1 billion through Wednesday, providing some protection against selling pressure.
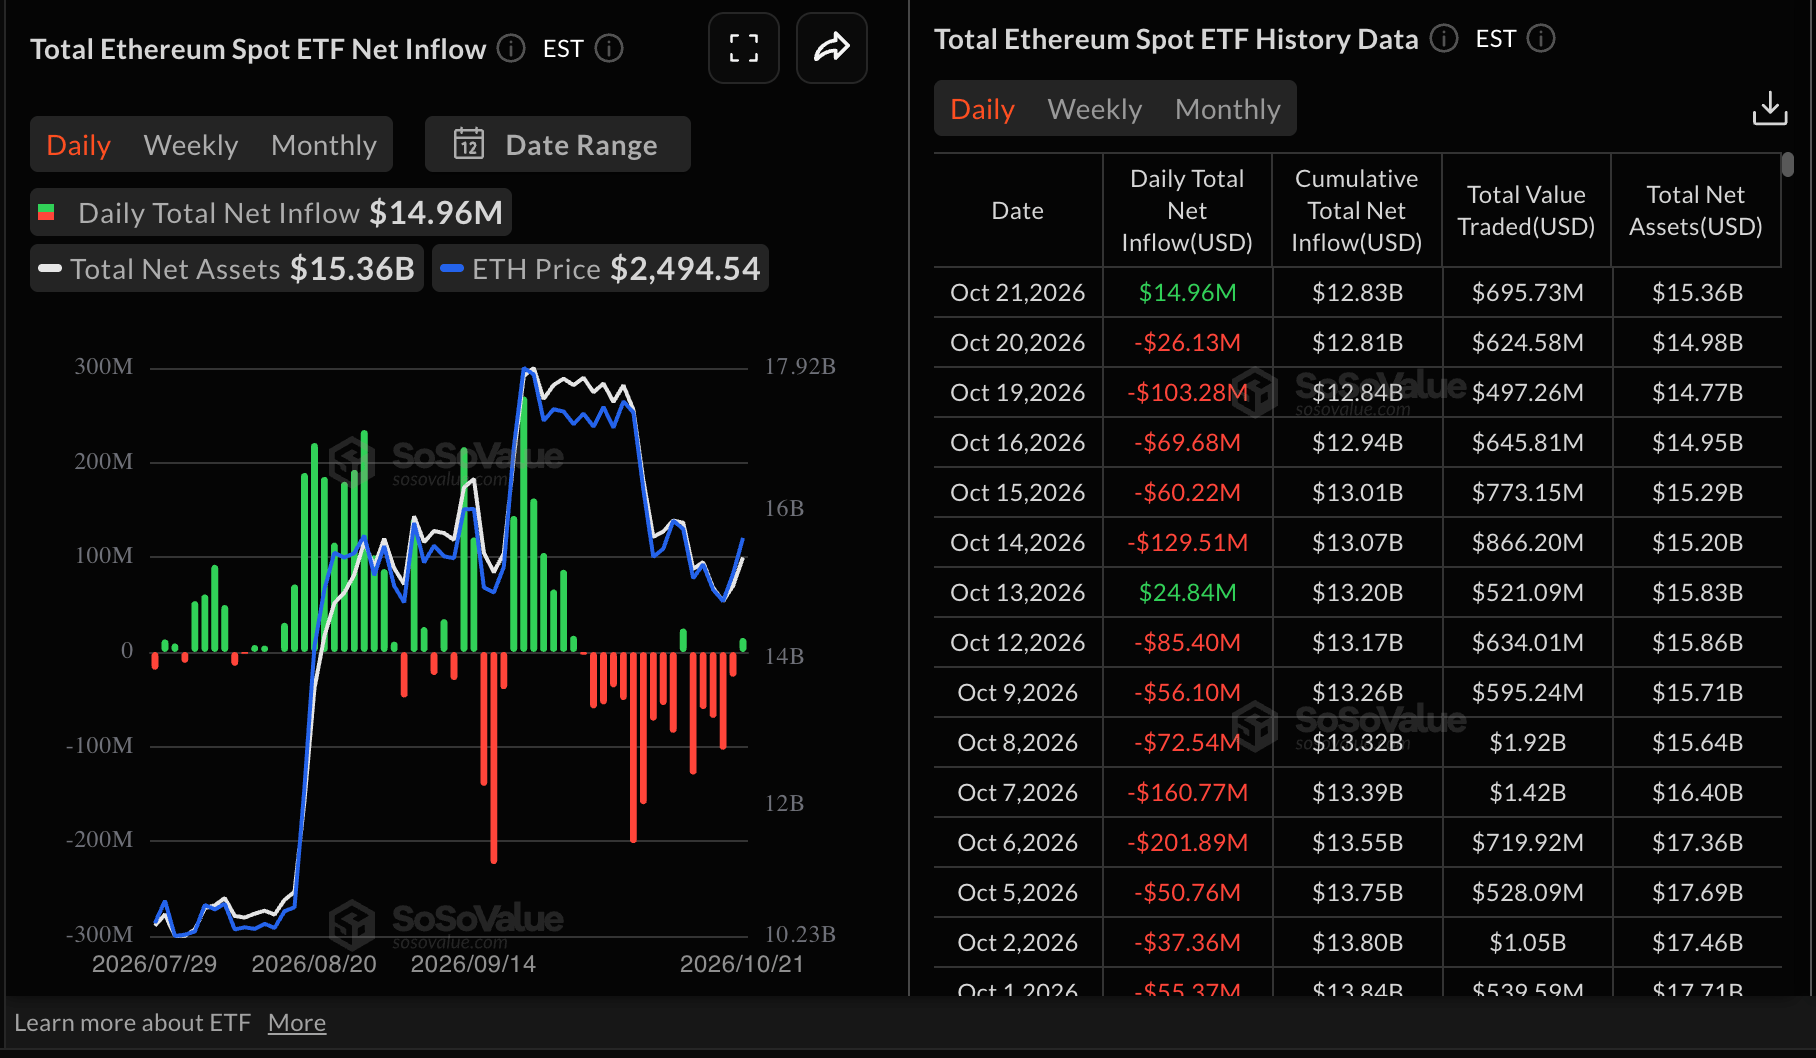
A modest $15 million inflow into Ethereum spot ETFs on Wednesday ended five consecutive days of outflows. The preceding sessions had recorded withdrawals of $26 million on Tuesday and $105 million on Monday. SoSoValue puts outflows across October at approximately $1 billion.
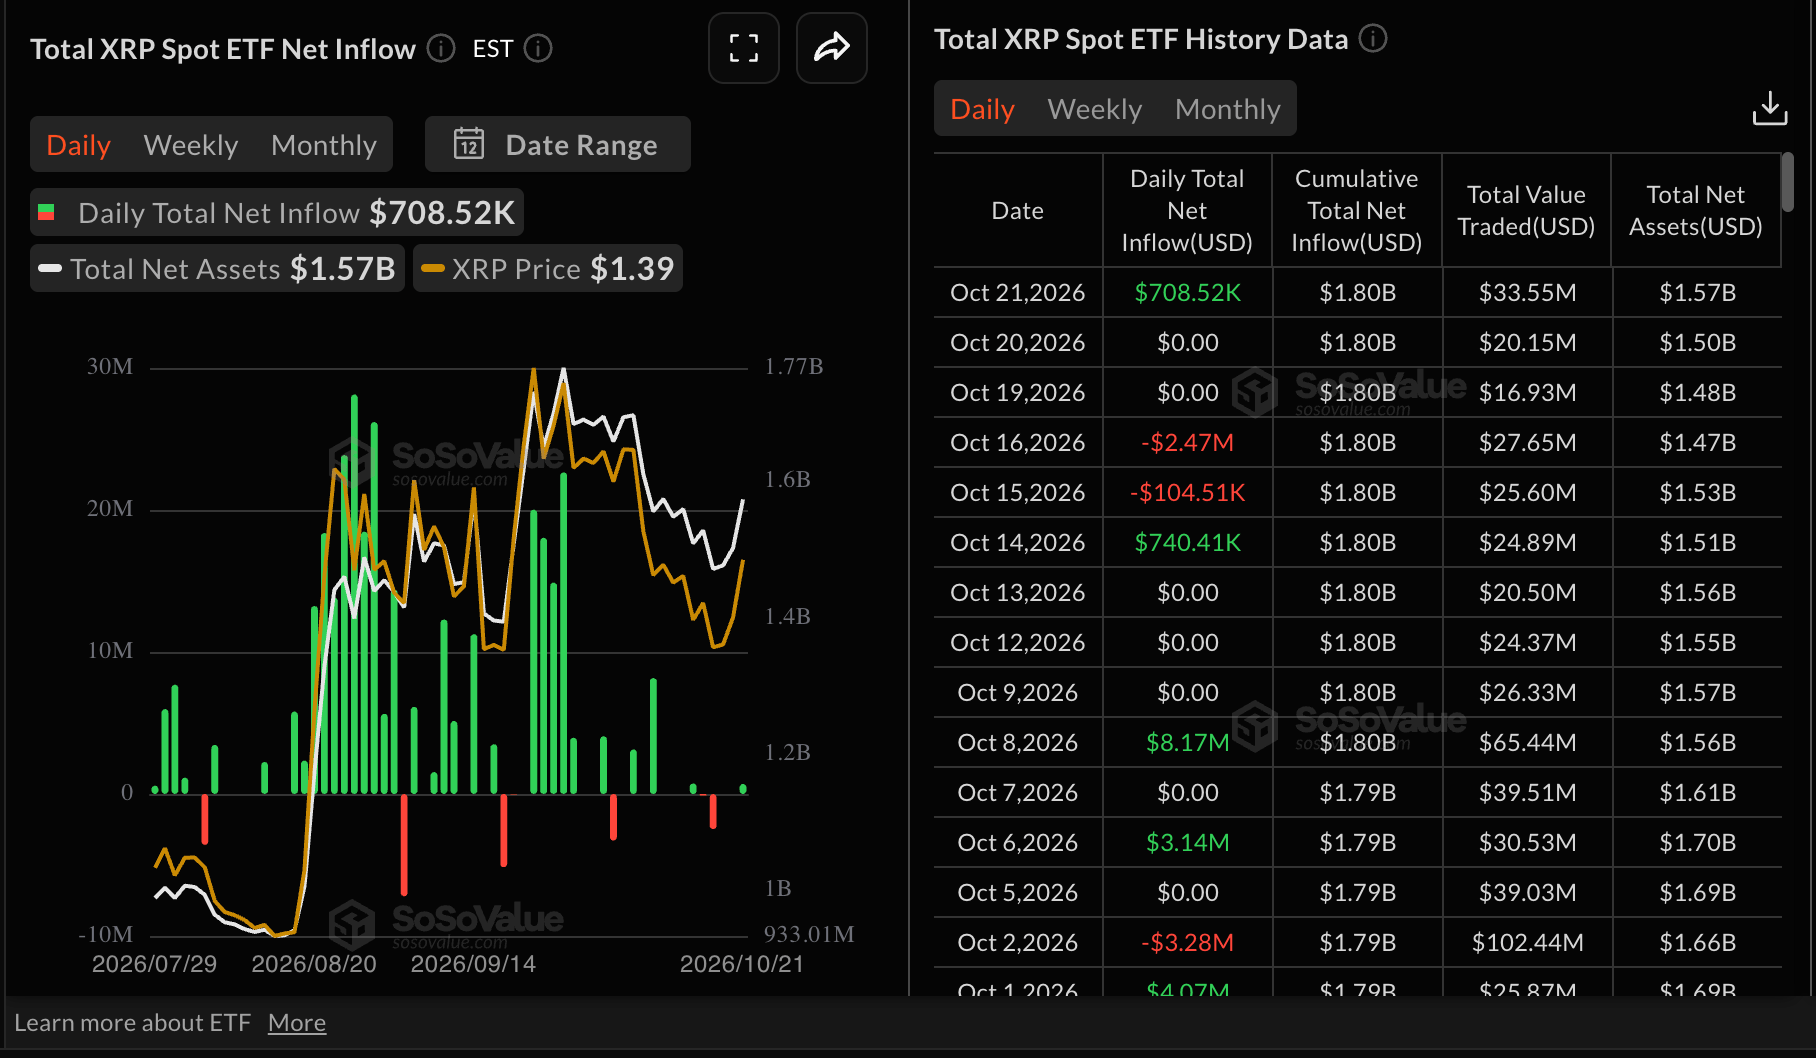
For XRP spot ETFs, approximately $709,000 flowed in on Wednesday after two consecutive days of subdued activity. Volatility continues to unsettle the market, with quiet trading, withdrawals and modest inflows defining activity. Sustained inflows over the coming weeks could alleviate wider selling pressure and give XRP room to consolidate before attempting another recovery.
$82,000 in focus: Bitcoin technicals face mounting selling pressure
Near $82,000, Bitcoin is trading lower as resistance builds across the broader cryptocurrency market. Even so, BTC retains a constructive bullish bias through the correction. It remains comfortably above key Exponential Moving Averages, with additional dynamic support from the SuperTrend line at approximately $79,664.
Momentum indicators tell a softer story. The Relative Strength Index (RSI) is close to 48, while the Moving Average Convergence Divergence (MACD) remains below zero. Together, they indicate fading upward momentum, although the broader price structure still has support.
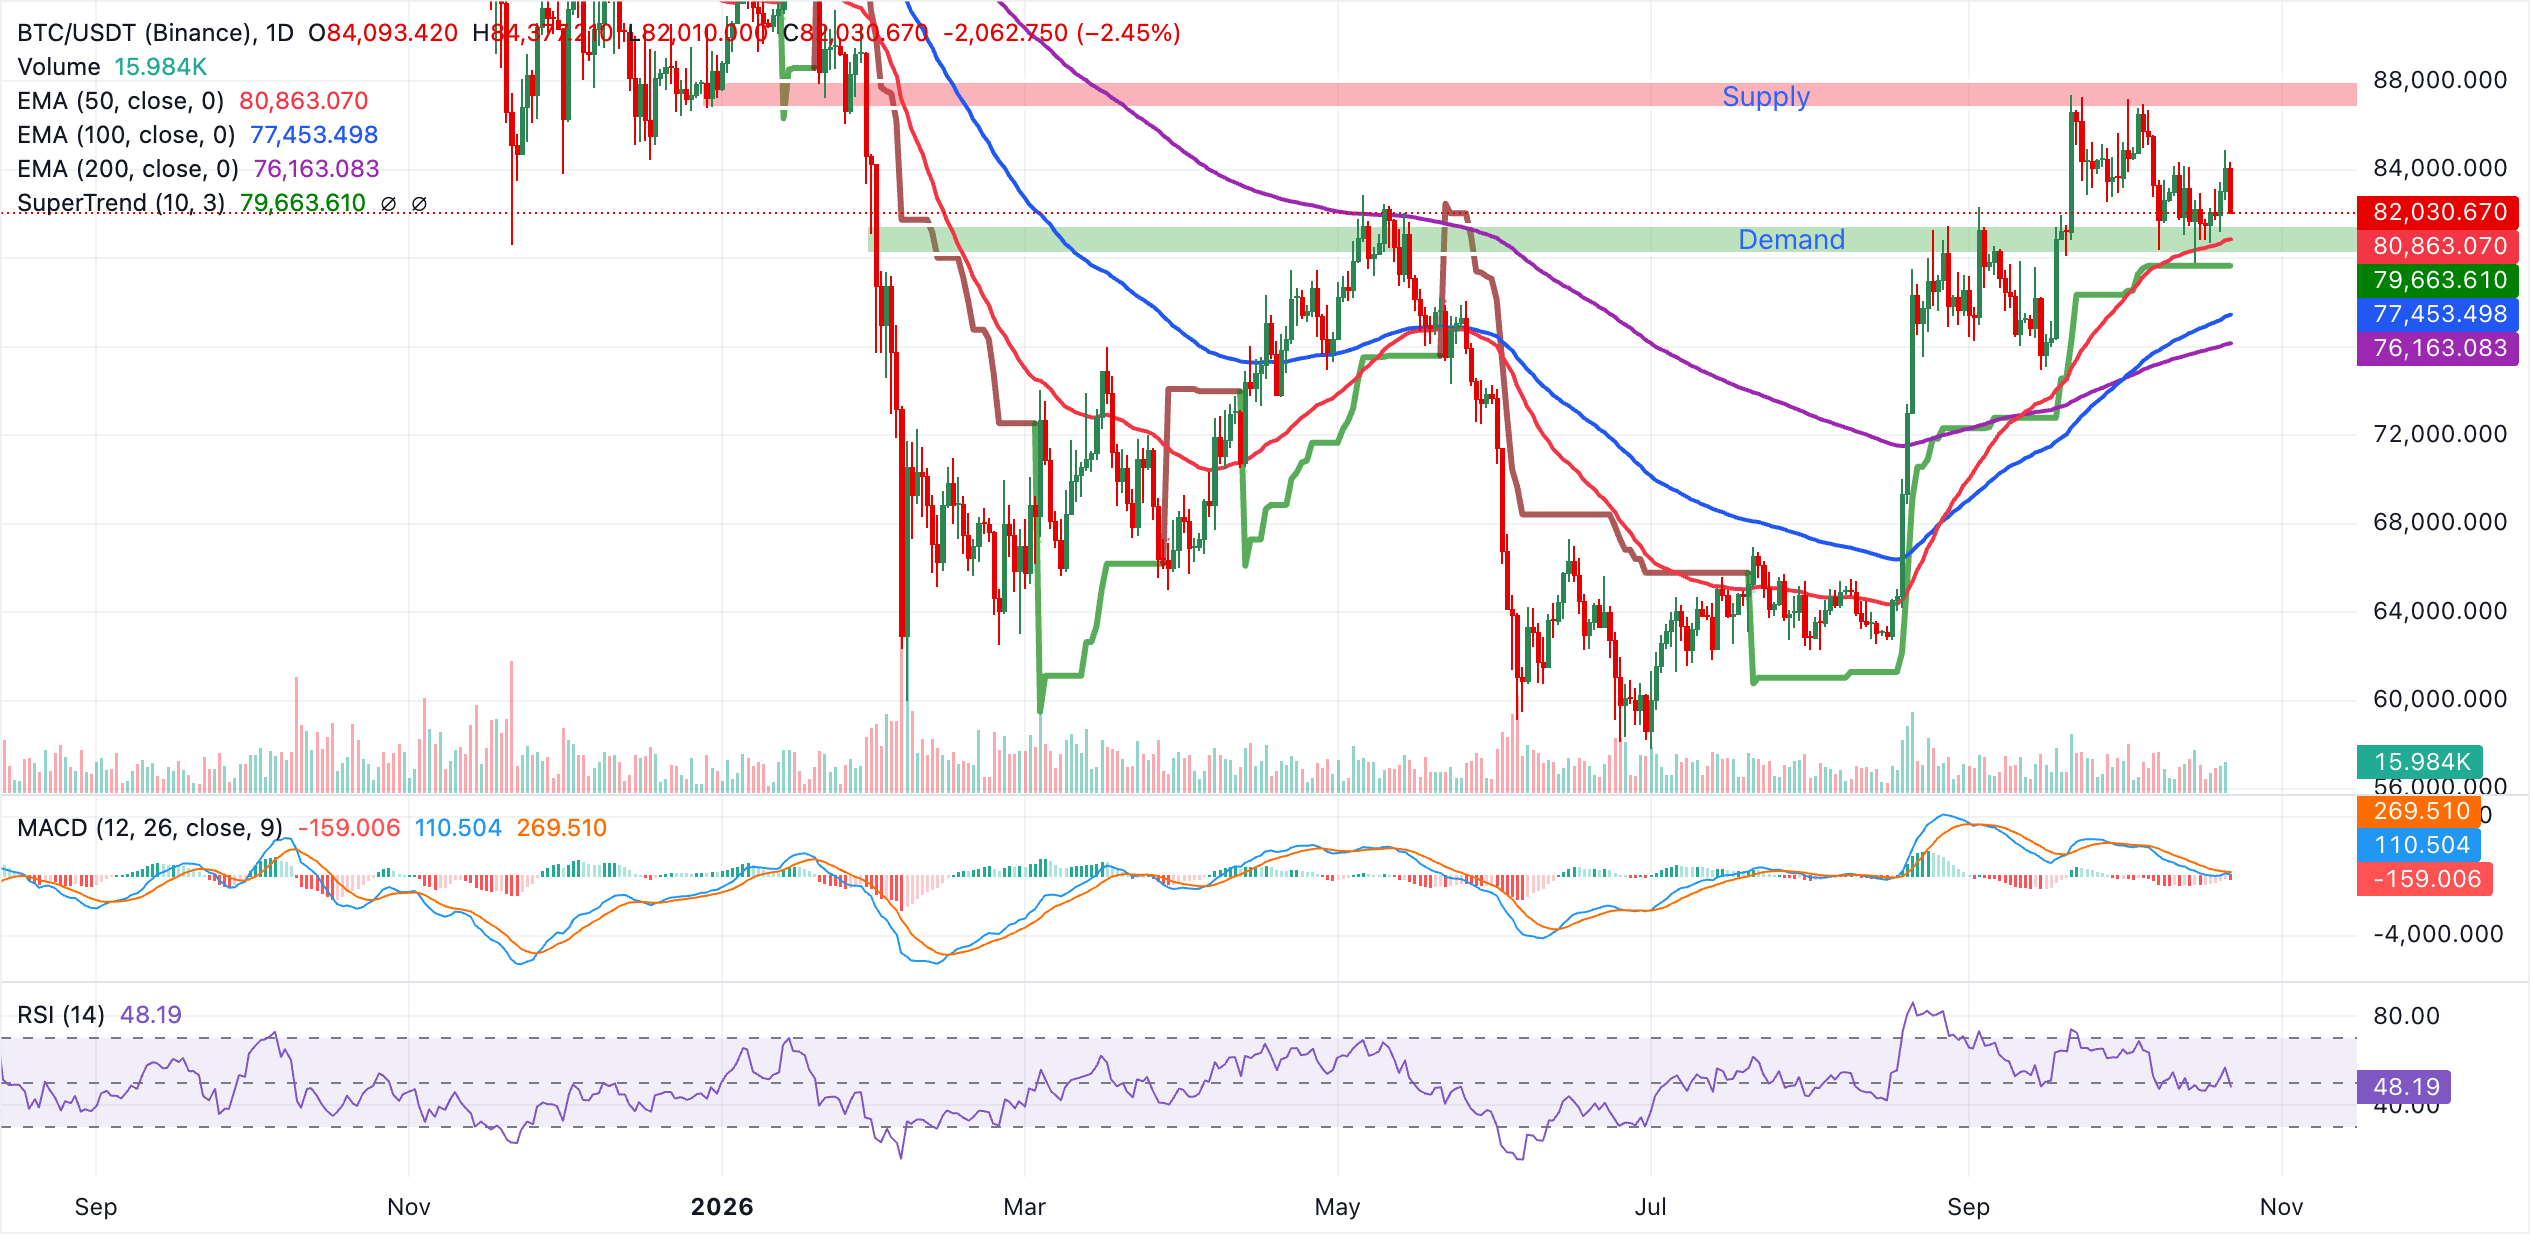
Around $80,863, the 50-day EMA provides the first support level. A daily close beneath it would bring the SuperTrend area near $79,664 into focus as the next demand zone. Further losses could put the 100-day EMA at approximately $77,453 in view, followed by the longer-term 200-day EMA near $76,163. Buyers would be expected to defend the broader bullish structure there. While BTC stays above this cluster of moving averages, declines are likely to be viewed as corrections within the established uptrend.
$2,400 in view: Ethereum and XRP technicals favour sellers
Towards $2,400, Ethereum is drifting lower between its main moving averages, leaving the short-term outlook neutral to mildly bearish. Medium-term support remains evident: ETH is above the 100-day and 200-day EMAs at approximately $2,365 and $2,318. However, the 50-day EMA near $2,479 and the SuperTrend line around $2,676 continue to limit the upside.
Buying interest looks weak, with the RSI close to 40. The MACD remains negative but shows only a shallow bearish profile, indicating that downward momentum may be easing rather than signalling a decisive bullish reversal.
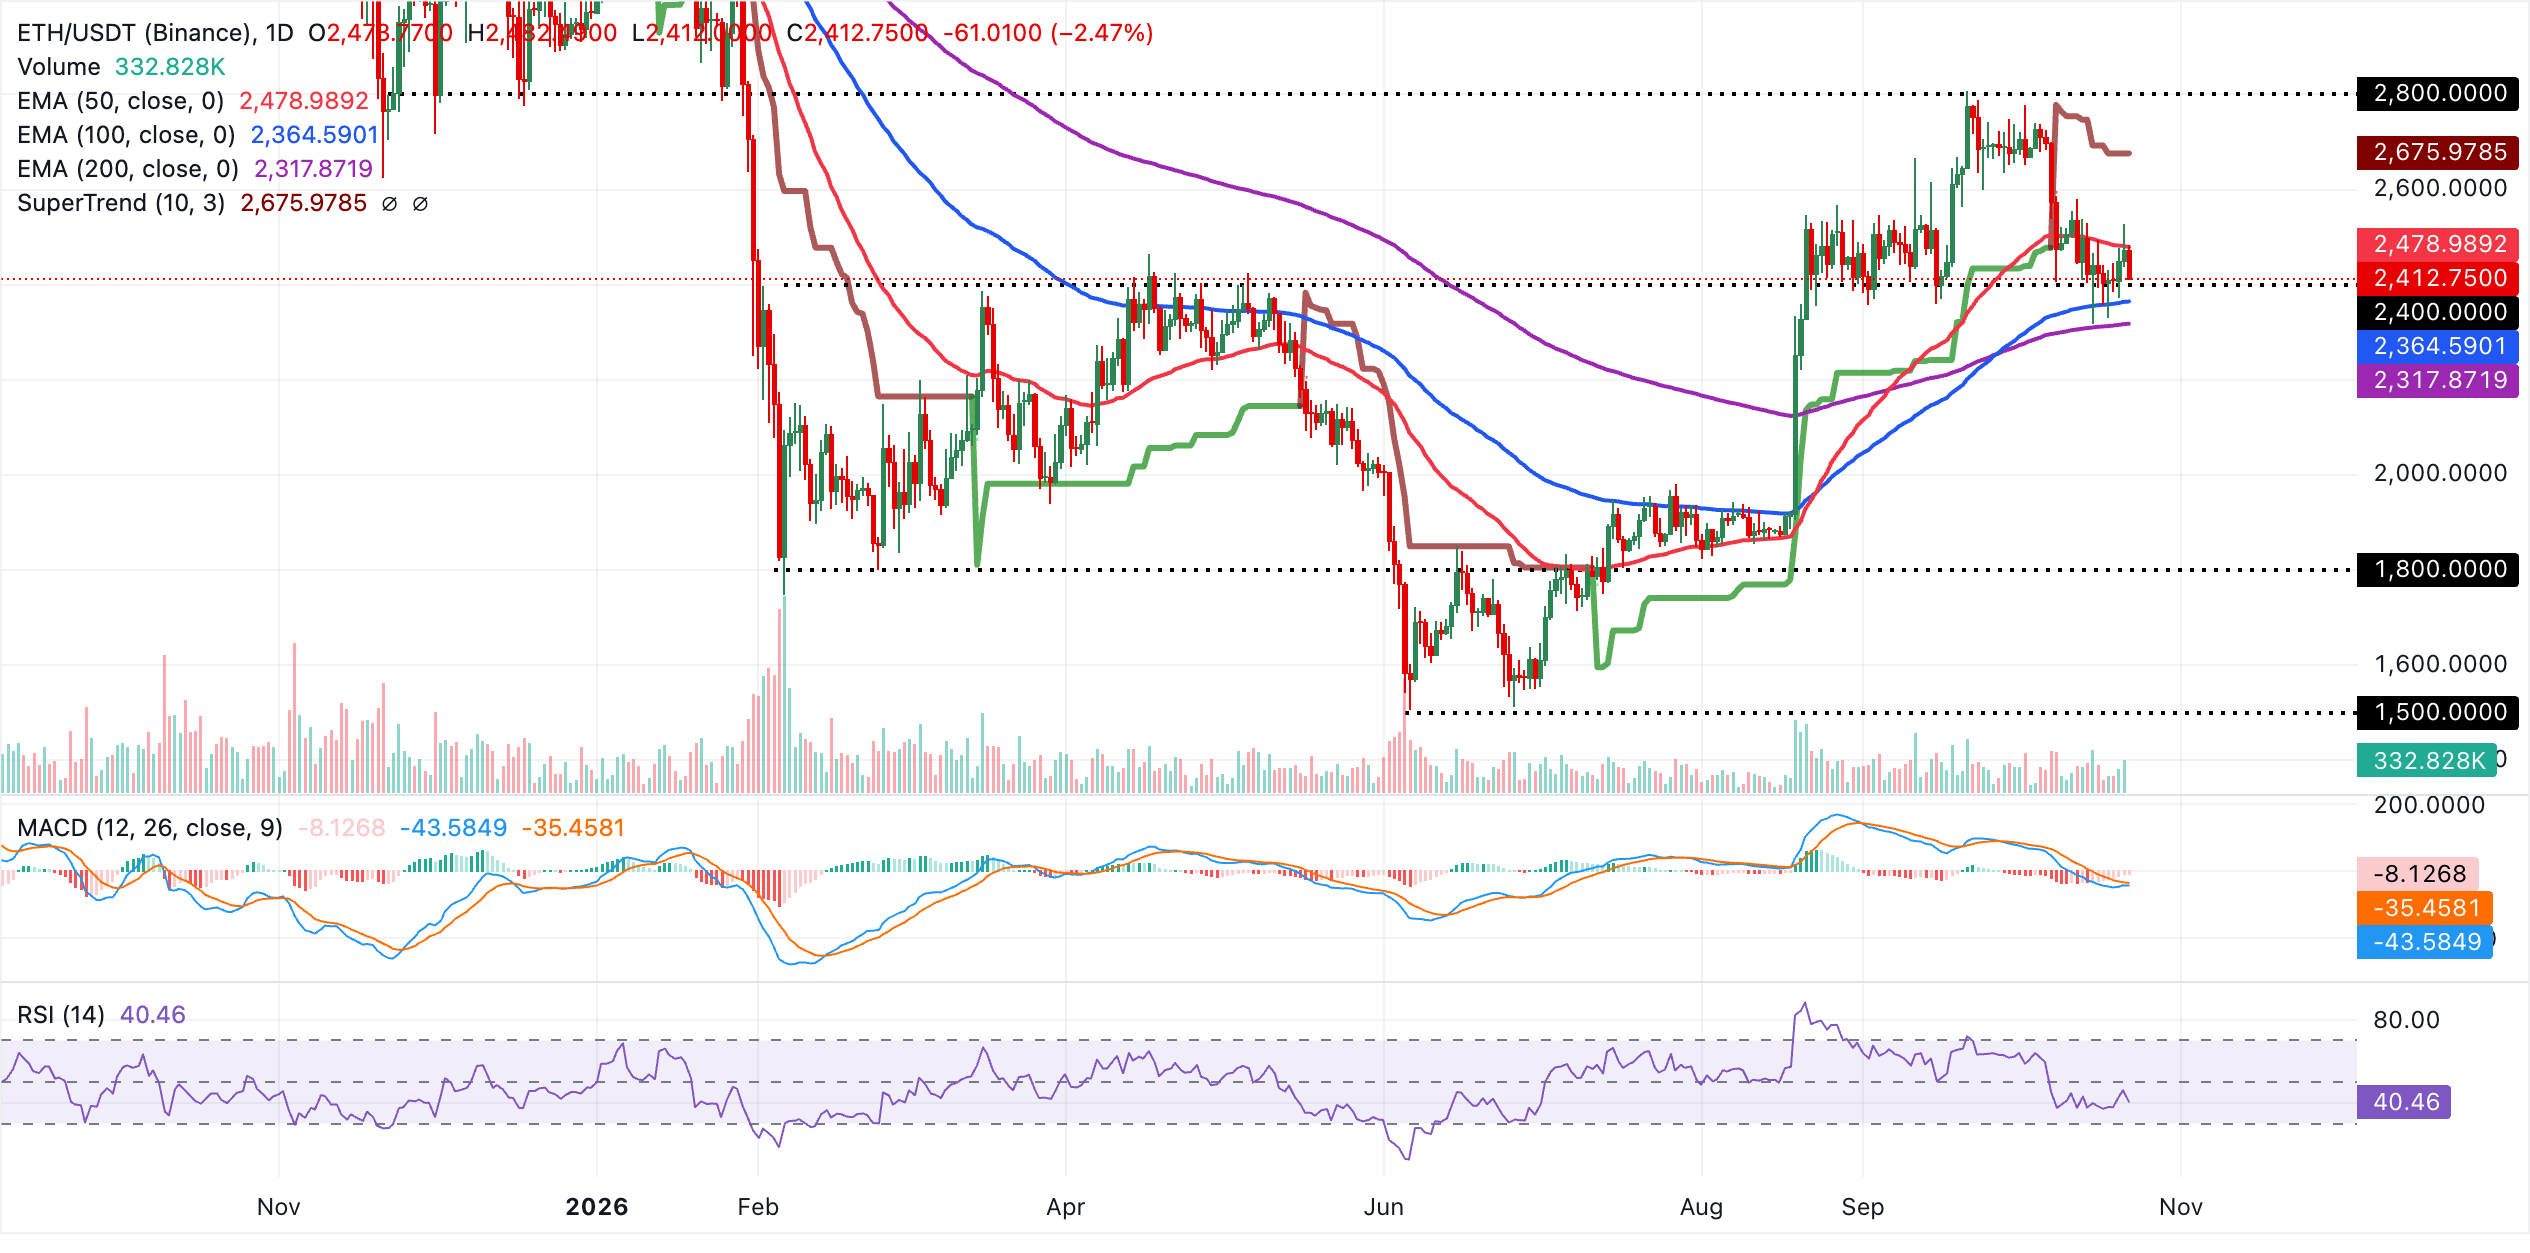
Around $2,479, the 50-day EMA marks the first resistance level. A firmer obstacle sits at the SuperTrend line near $2,676, where a rebound would likely attract renewed selling. Immediate downside support lies at the 100-day EMA around $2,364, ahead of the 200-day EMA near $2,318. Closing below this zone on a daily basis would strengthen the bearish outlook and leave scope for a deeper correction. Holding above it, by contrast, would keep ETH consolidating within its broader uptrend.
Around $1.33, XRP remains below its major moving averages, leaving the near-term bias bearish. The closest overhead barrier is the 100-day EMA at $1.34. Above it, the 50-day EMA at $1.37 and the 200-day EMA at $1.38 reinforce resistance. All three align with the wider descending trendline structure, indicating that rallies remain exposed to selling.
With the RSI near 43 and the MACD still slightly below zero, momentum remains muted. Recovery attempts may therefore struggle for traction while XRP stays beneath this moving-average cluster.
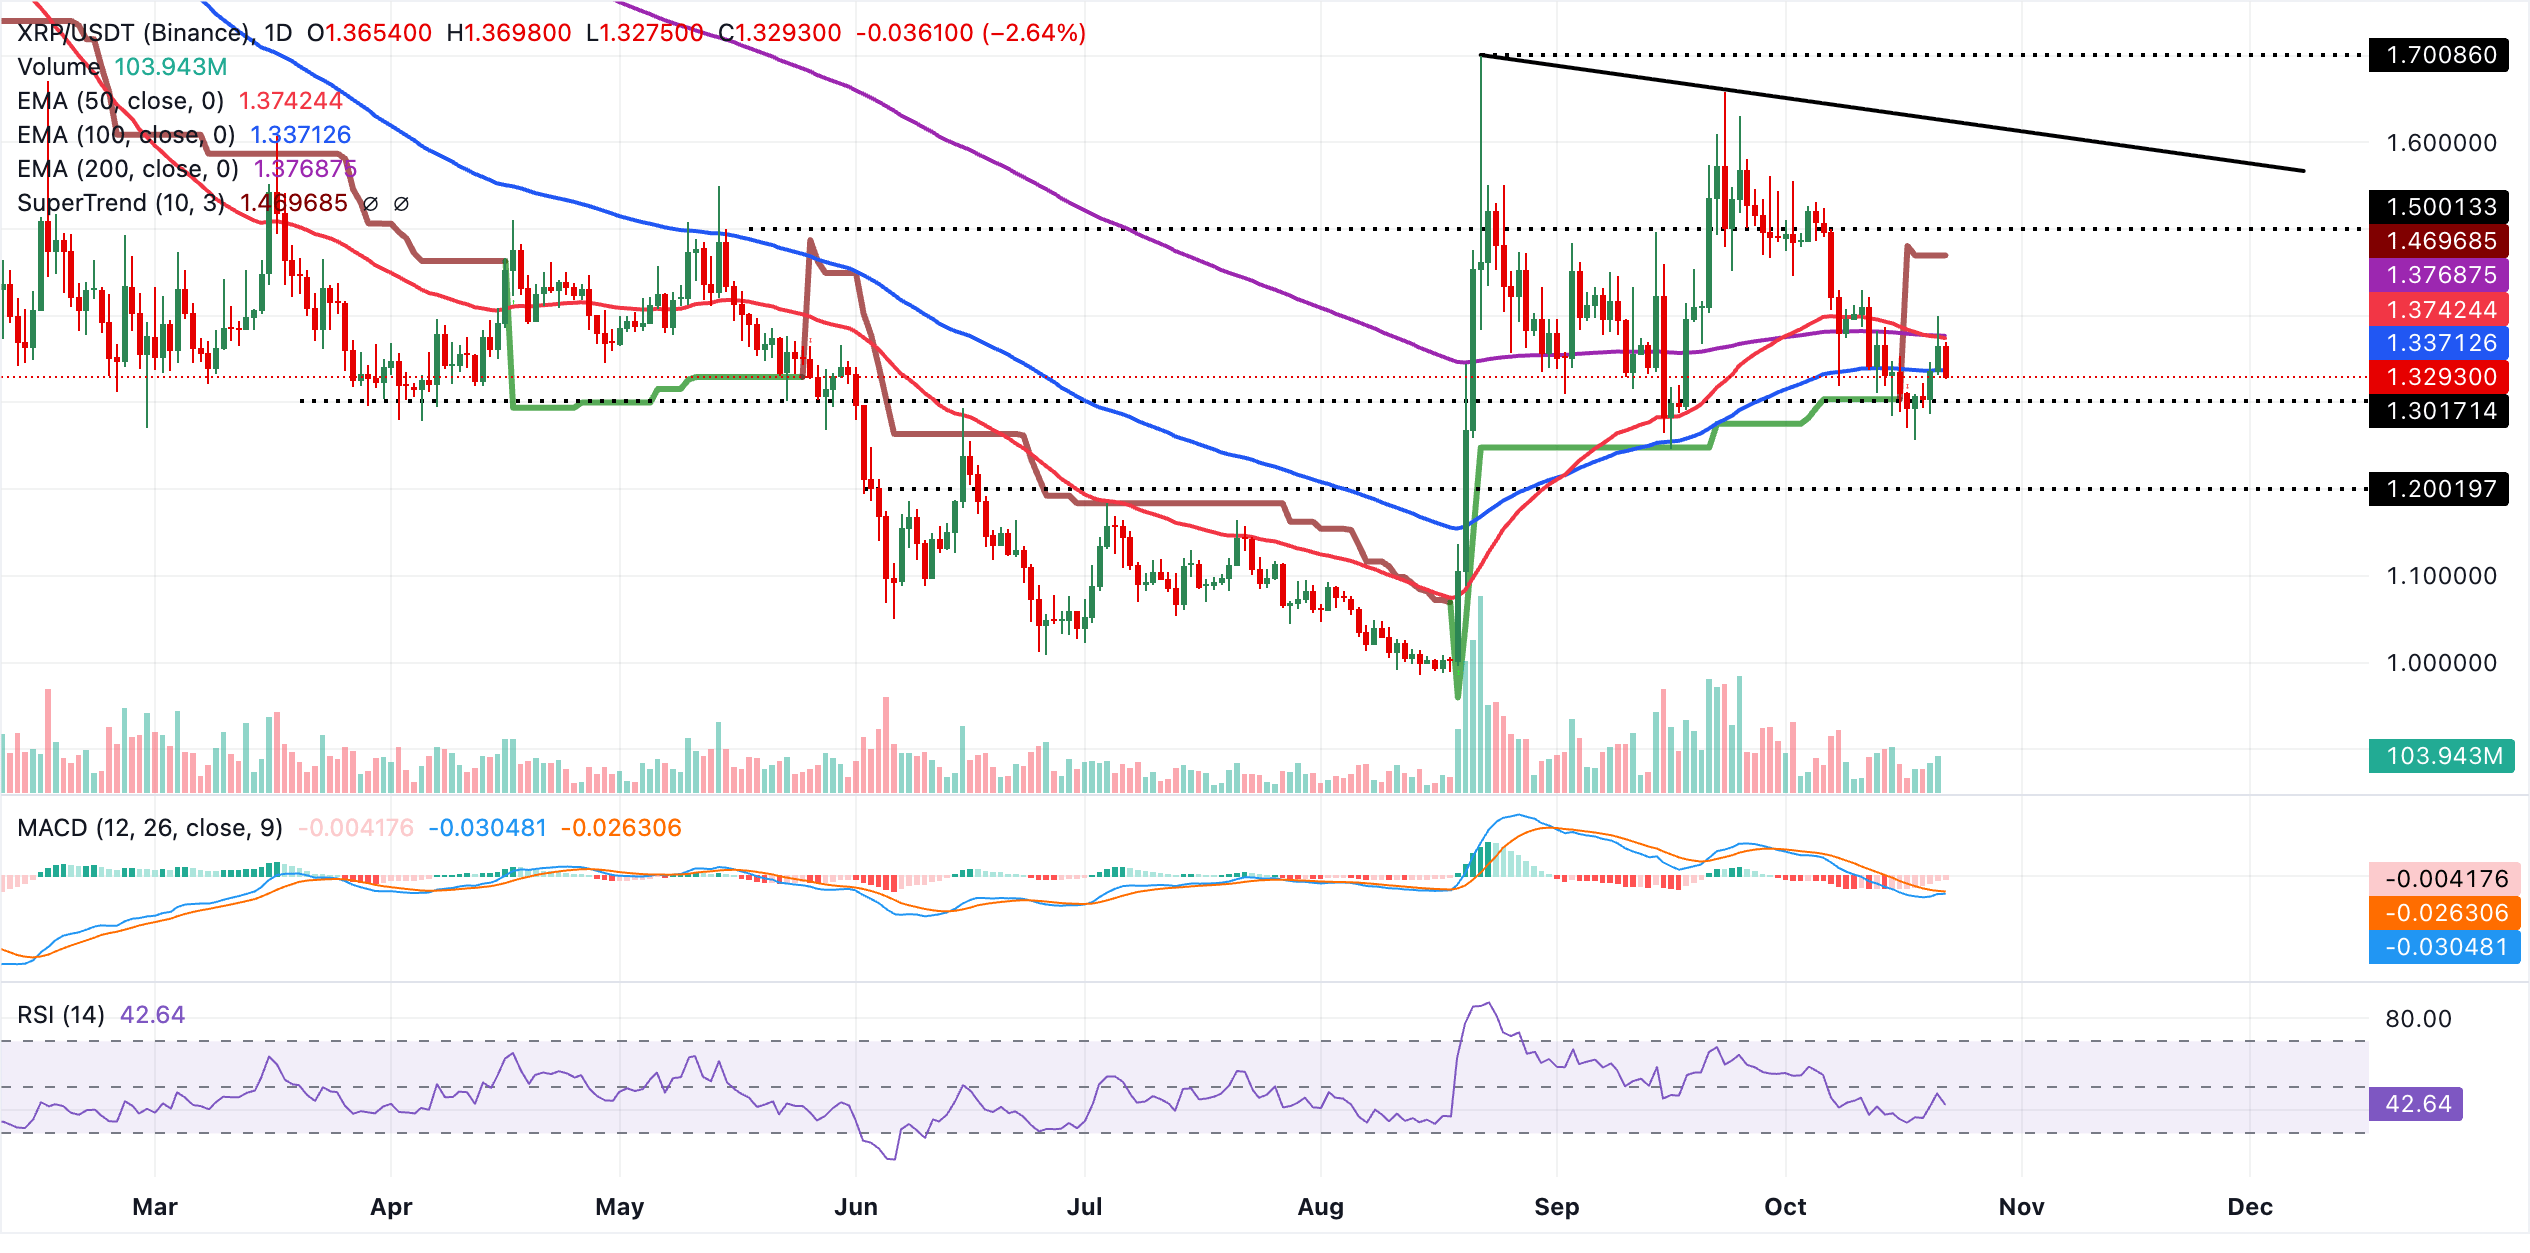
At around $1.34, the 100-day EMA forms the first upside barrier. The next, denser supply zone spans the 50-day EMA at approximately $1.37 and the 200-day EMA near $1.38, with the broader downtrend line likely to reinforce selling pressure. Further up, the SuperTrend indicator at $1.47 defines a more distant bearish trigger zone. XRP would need to regain that level to support the case for a lasting move away from its current downward bias.
(The technical analysis of this story was written with the help of an AI tool. Know more.)
Crypto ETF questions answered
Investors use an Exchange-Traded Fund (ETF) to obtain exposure to a particular asset. This investment vehicle or index follows the price of an underlying asset, but its scope can also extend to groups of assets and sectors. A Bitcoin ETF, for instance, follows Bitcoin’s price.
Yes. Approval for the first US Bitcoin futures ETF came from the US Securities & Exchange Commission in October 2021. Seven Bitcoin futures ETFs have received approval in total, while more than 20 await regulatory permission. According to the SEC, the cryptocurrency industry is new and vulnerable to manipulation. It cites this as the reason for delaying crypto-related futures ETFs over the past few years.
Yes. In January 2024, several Bitcoin spot Exchange-Traded Funds received SEC approval for listing and trading. The decision enabled institutional capital and mainstream investors to trade the leading cryptocurrency, and the industry welcomed it as a game-changing development.
Exposure without direct ownership is the principal benefit of crypto ETFs, reducing the risks and costs of holding a cryptocurrency. Investors also face a gentler learning curve and gain greater security because the ETF is responsible for safeguarding the underlying assets. The central drawback is the same lack of direct ownership, captured by the crypto saying “not your keys, not your coins.” Fees for active management can also make holding crypto through an ETF more expensive. Finally, although ETFs reduce the risks involved in holding an asset, fluctuations in the underlying cryptocurrency’s price are still likely to feed through to the fund.
POPULAR ARTICLES
11.1200 gives way as Euro retreats, French yields climb and Oil tests five-month highs2$1.30 Support Tested: Ripple (XRP) price forecast as protocol defers bug fix to November3January hike remains in focus for Japanese Yen after hawkish BoJ hold – Standard Chartered41.3440: British Pound could extend rebound against US Dollar – UOB5Bond market turmoil restores Swiss Franc’s safe-haven status6AUD/USD Price Forecast: Antipodeans face pressure as oil prices climb7New Zealand Dollar: Limited support against USD from RBNZ hikes - BBH8Euro: Monetary Reach and Its Constraints – Commerzbank9Cooling NZ inflation leaves New Zealand Dollar lagging
LIVE QUOTES


ALL ABOUT TECHNICAL
What Is the Dark Cloud Cover Pattern and How Do You Trade It?
What Is the Piercing Line Candlestick Pattern and How Do You Trade It?
What Are Tweezer Top and Bottom Candlestick Patterns?
Inside Bar Candlestick Pattern: What It Is, How to Identify It, and How to Trade It
Hanging Man Candlestick Pattern: How to Identify and Trade It
How to Draw Fibonacci Retracement: Mastering the Golden Ratio in Trading
What is the Relative Strength Index (RSI)
What is Scalping in Trading & How Does It Work
Get Started!
Sign up and access the Global Markets in less than 3 minutes

Connect With Us









Contacts
Phone: +61 2 8036 8388
Fax: +61 2 8036 8388
Email: support@tmgm.com



The information provided on this website is of a general nature only and does not constitute personal financial advice. Before acting on any information on this website, you should consider the suitability of the information in relation to your objectives, financial situation and needs. Investing in CFDs and FX Margin Contracts carries significant risks and is not suitable for all investors. You may lose more than your initial deposit. You do not own, or have, any interest in the underlying asset. We recommend that you seek independent advice and ensure you fully understand the risks involved before trading. It is important that you read and consider the disclosure document before you acquire any product listed on the website. The information and advertisements offered on this website are not intended for use by any person in any country or jurisdiction where such use would be contrary to local laws and regulations. The Products and Services offered on this website are not intended for residents of the United States, Malaysia and Thailand.
TMGM is authorized and regulated in various jurisdictions.
Trademax Australia Limited, trading as TMGM, is regulated by the Australian Securities and Investments Commission (ASIC), AFSL no. 436416 and is located at Level 28, One International Tower, 100 Barangaroo Avenue, 2000 Sydney, NSW Australia.
Email: support@tmgm.com.au
Trademax Global Limited, trading as TMGM, is authorized and regulated by the Vanuatu Financial Services Commission (VFSC), registration number 40356 and registered at 1276, Kumul Highway, Port Vila, Vanuatu, Republic of Vanuatu.
Email: support@tmgm.com
Trademax Global Markets (SE) Limited, trading as TMGM, is authorized and regulated by the Financial Services Authority (FSA) of Seychelles, with license number SD224. The company is registered at Office No 13, Providence Estate ABIS Centre, Mahe, Seychelles.
Email: support@tmgm.com
Trademax Global Markets (International) Pty Ltd, trading as TMGM, is authorized and regulated by the Financial Services Commission, Mauritius (FSC) with license no. GB22201012, and registered at 33, Edith Cavell Street C/o IQ EQ Fund Services (Mauritius) Ltd Port Louis, 11324 Mauritius.
Email: support@tmgm.com
Copyright © TMGM. All rights reserved