

Trading
Explore a wide range of markets with competitive pricing, deep liquidity, and advanced trading tools.
Learn More 
Platform
Trade seamlessly with TMGM's powerful platform, built for speed, precision, and a superior trading experience.
Learn More Trading Platform
Academy
Learn the fundamentals of trading with beginner-friendly resources, including guides, webinars, and market insights.
Learn More News & Analysis
Get real-time market updates and expert analysis to stay ahead of trading opportunities
Learn More News & Analysis
About
Learn what sets TMGM apart — our global presence, regulatory strength, and commitment to innovation in trading.
Learn More Why Choose TMGM
Sponsorship
$1,800 Recovery Eludes ETH After Futures and Spot Distribution: Ethereum Price Forecast
$1,750: Ethereum price today
- Negative funding rates have returned, signalling seller control in Ethereum futures.
- Rising volume during the price decline shows spot traders are adding to selling pressure.
- $1,827 continues to cap ETH.
Ethereum (ETH) fell more than 2% on Wednesday. The price stayed below $1,800 as sellers took control of its derivatives markets.
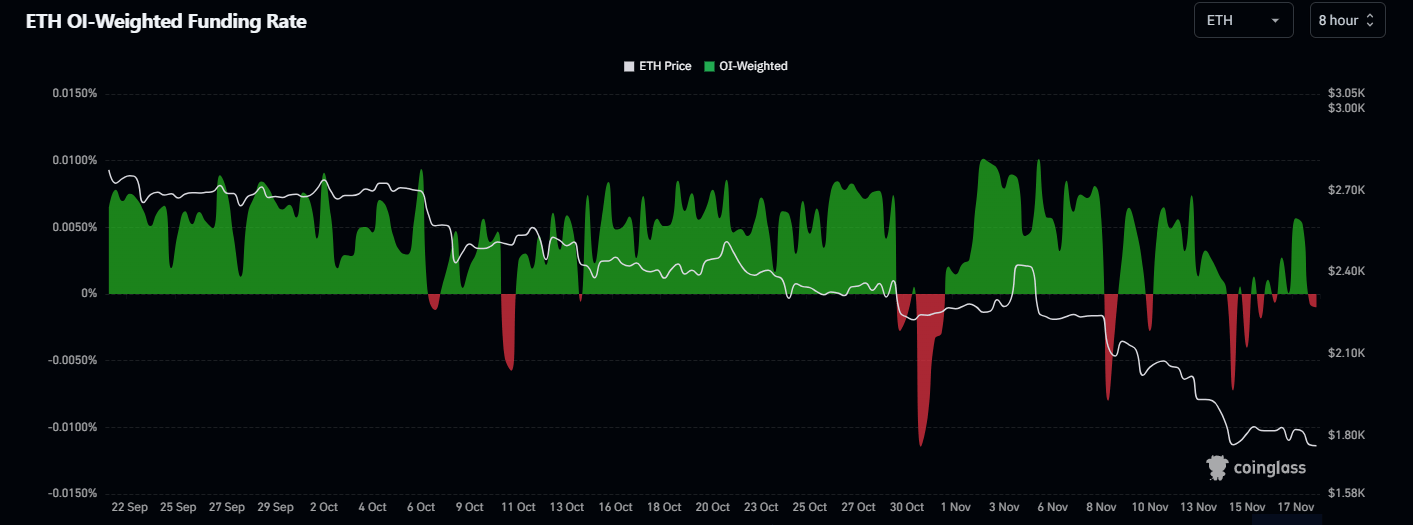
Over the past few hours, funding rates for ETH perpetuals have turned negative, signalling that short traders have temporarily regained the upper hand. Repeated negative readings since October have accompanied ETH's decline, pointing to participation by futures sellers as prices moved lower.

To align perpetual futures prices with the underlying spot price, traders exchange periodic funding payments. Positive funding means longs pay shorts; when funding turns negative, shorts pay longs.
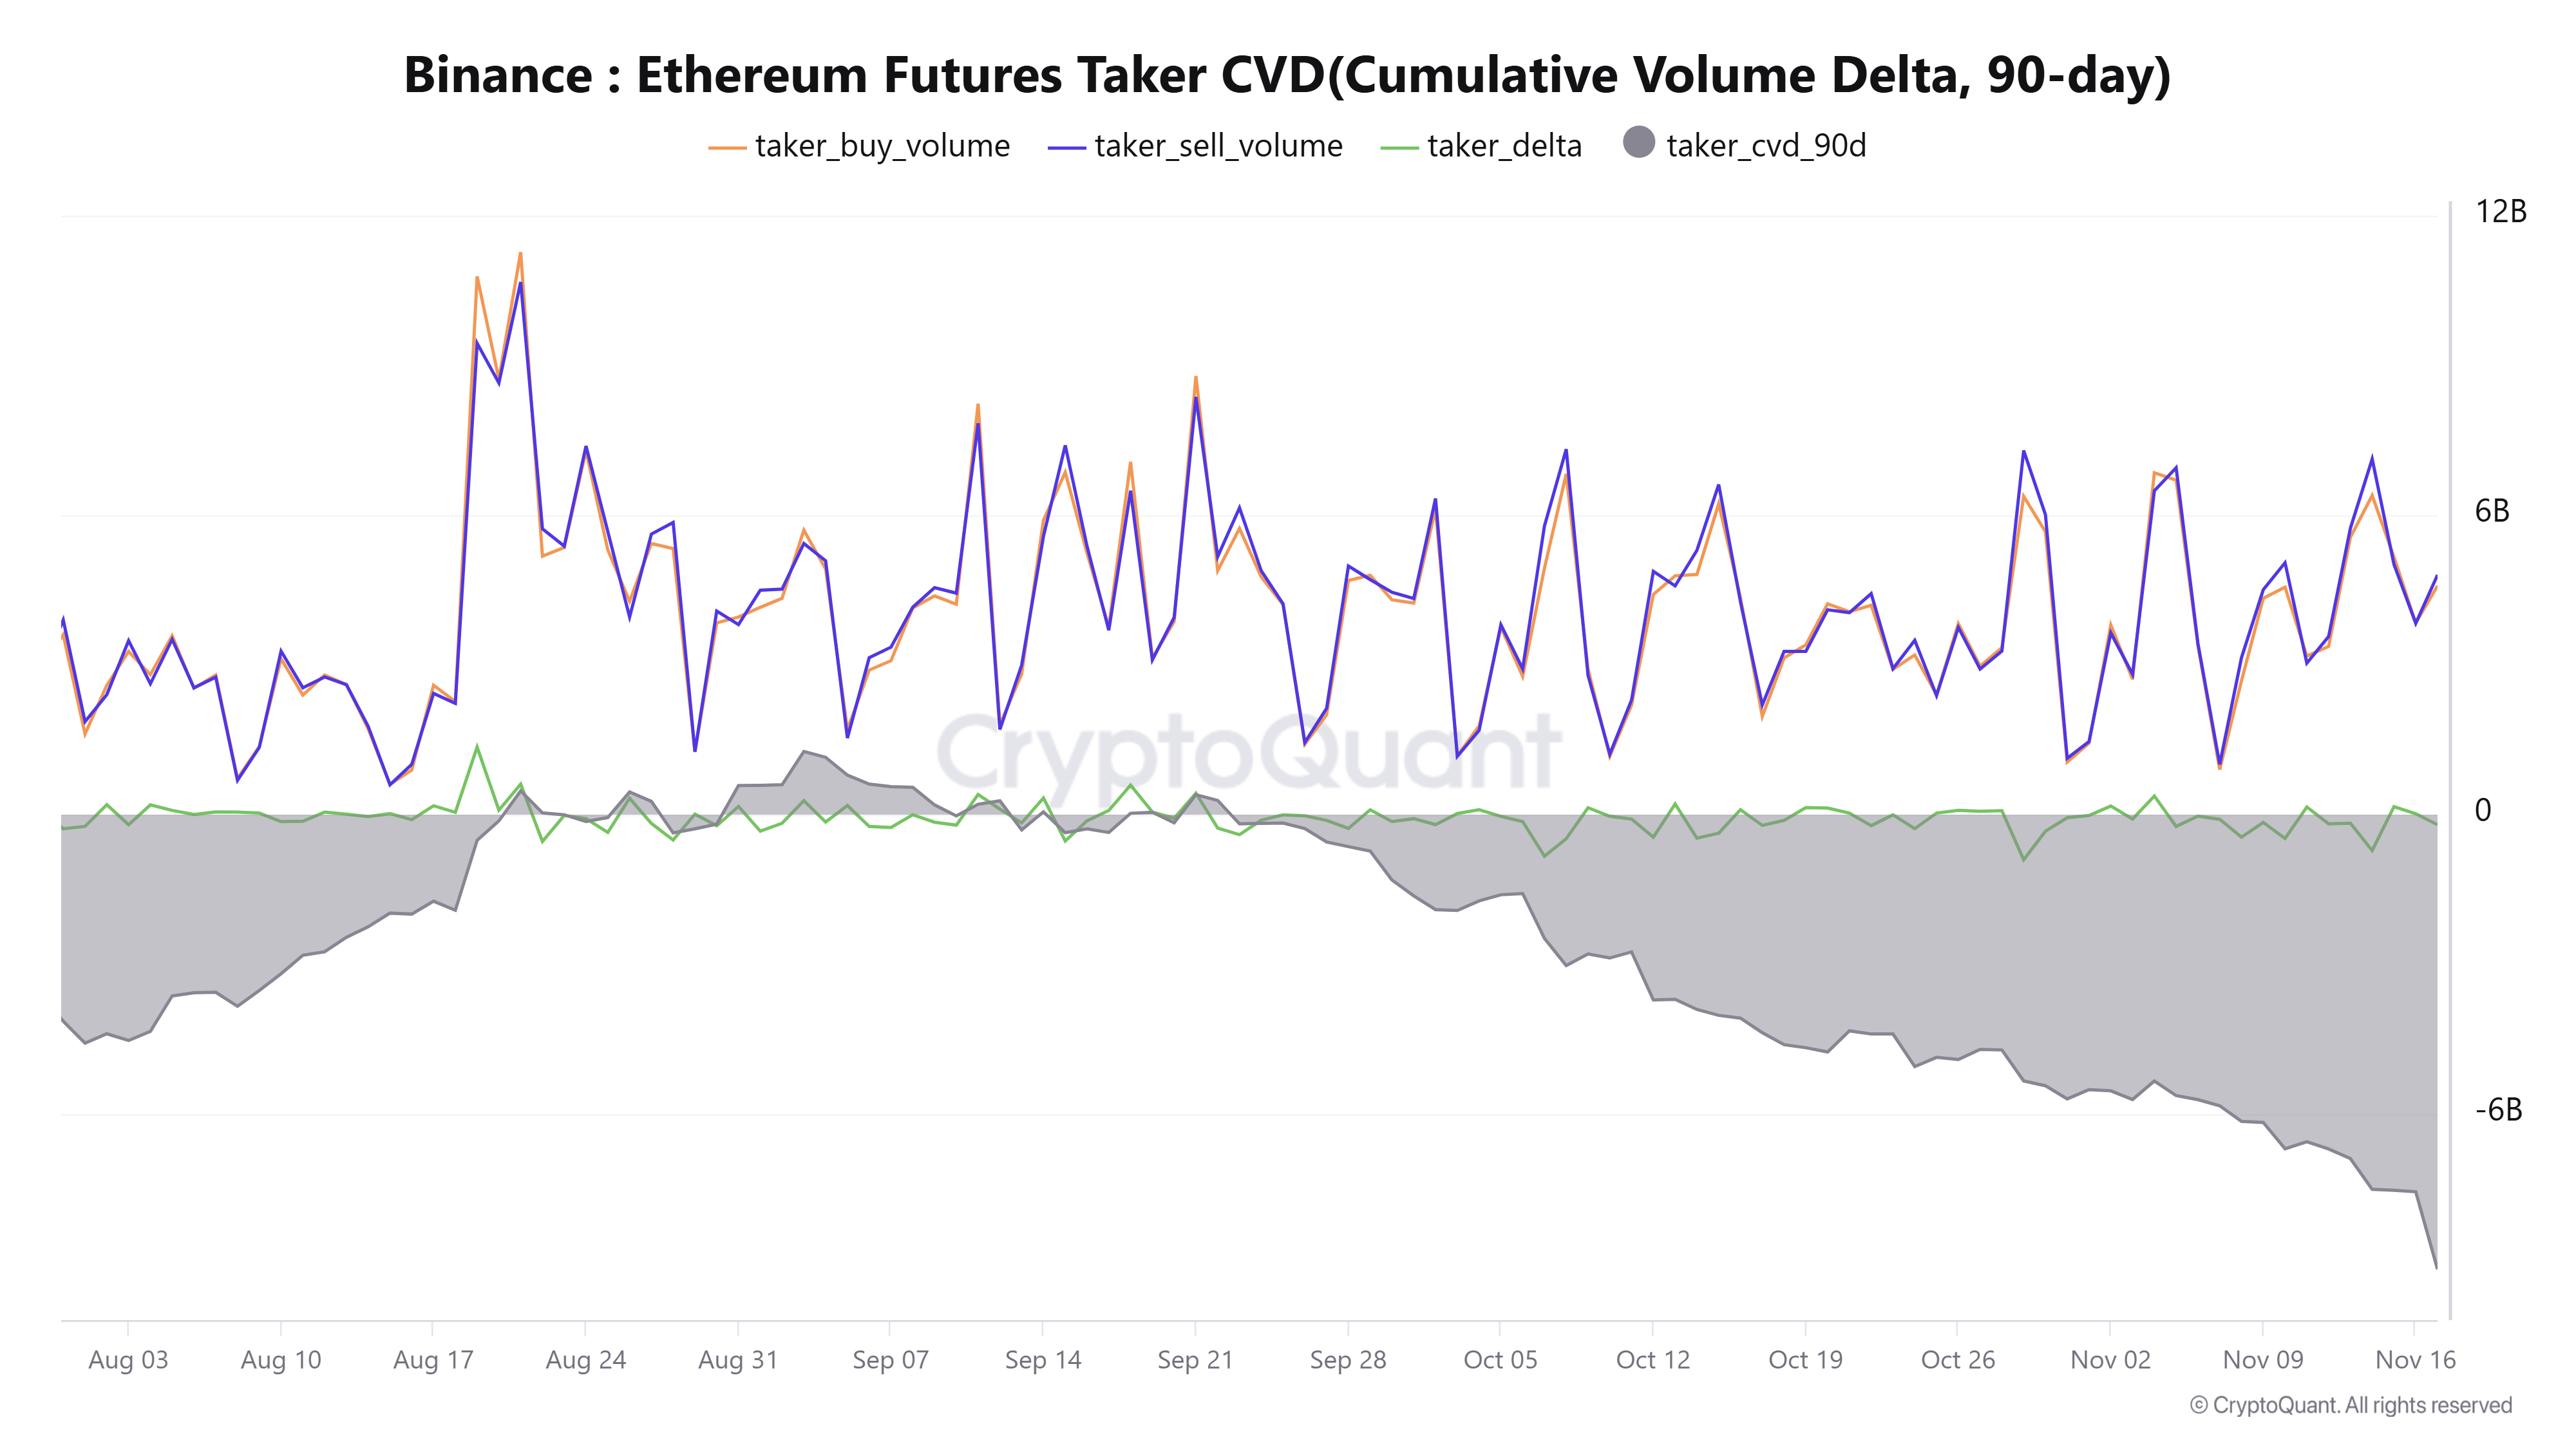
Binance's Futures Taker Cumulative Volume Delta offers clearer evidence of seller control. The metric measures the cumulative net difference between aggressive buying and selling on the crypto exchange. The latest ETH futures CVD stands at -$214 million. Meanwhile, the 90-day CVD fell from $1.253 billion in September to -$9.125 billion on Tuesday, the lowest reading since February. This shift indicates that aggressive market selling has built up without being fully absorbed by aggressive buyers.
1.00 million ETH exceeded as spot selling volume rises
Selling also spread beyond derivatives. As ETH prices fell, spot volume climbed above 1.00 million ETH from roughly 0.16 million to 0.38 million ETH earlier in October. The largest recent session volumes reached roughly 1.13 million and 1.00 million ETH, suggesting broad participation in the latest sell-off.
SoSoValue data show seven straight weeks of net outflows from US spot ETH exchange-traded funds (ETFs), making these products a significant contributor to the selling. Net withdrawals last week totalled $398.85 million.
Separately, CoinShares disclosed in its Q3 earnings report that its entire ETH treasury was sold for $16.6 million during the third quarter. The digital asset manager used the sale to support a share buyback programme.
$1,827 caps ETH: Ethereum technical outlook
Coinglass data put Ethereum liquidations over the past 24 hours at $84.9 million, with long positions accounting for $60.2 million.
ETH's bearish phase continues on the daily chart. Prices remain well below the 20-day, 50-day and 100-day Exponential Moving Averages (EMAs), which stand at $2,041, $2,224 and $2,263, respectively. Although conditions are deeply oversold, this alignment points to continued seller control. The 14-day Relative Strength Index (RSI) is near 23, while the Stochastic Oscillator (Stoch) sits at 5, suggesting downside momentum is stretched but has yet to reverse.
An initial recovery would face resistance at $1,827 and then $1,971, before reaching the 20-day EMA and the $2,101 barrier. Further resistance clusters around $2,204 and the 50-day and 100-day EMAs, followed by the horizontal level at $2,250. Beyond these lie a firmer barrier at $2,355 and higher levels towards $2,548 and above.
Immediate downside support lies at $1,706. A decisive breach would put $1,603 and subsequently $1,512 in focus, where dip buyers may try to stabilise prices.
(The technical analysis of this story was written with the help of an AI tool. Know more.)
POPULAR ARTICLES
1$1,800 Recovery Eludes ETH After Futures and Spot Distribution: Ethereum Price Forecast233.00: Taiwan Dollar Shows Signs of Recovery Against US Dollar – OCBC34.7%: Australia’s unemployment rate expected to hold steady4Singapore Dollar: Export support underpins stable trading range outlook – Commerzbank5Indonesian Rupiah: Limited pressure relief from surprise BI rate hike – BBH6US yields steer Singapore Dollar (SGD) recovery outlook - OCBC76.6520 in View as Chinese Yuan Shows Gradual Upside Bias Against US Dollar – UOB8Silver Price Forecast: RSI turns oversold as downtrend intensifies94.5% inflation peak forecast for United Kingdom in Q1 2027 - Societe Generale


Get Started!
Sign up and access the Global Markets in less than 3 minutes

Connect With Us









Contacts
Phone: +61 2 8036 8388
Fax: +61 2 8036 8388
Email: support@tmgm.com



The information provided on this website is of a general nature only and does not constitute personal financial advice. Before acting on any information on this website, you should consider the suitability of the information in relation to your objectives, financial situation and needs. Investing in CFDs and FX Margin Contracts carries significant risks and is not suitable for all investors. You may lose more than your initial deposit. You do not own, or have, any interest in the underlying asset. We recommend that you seek independent advice and ensure you fully understand the risks involved before trading. It is important that you read and consider the disclosure document before you acquire any product listed on the website. The information and advertisements offered on this website are not intended for use by any person in any country or jurisdiction where such use would be contrary to local laws and regulations. The Products and Services offered on this website are not intended for residents of the United States, Malaysia and Thailand.
TMGM is authorized and regulated in various jurisdictions.
Trademax Australia Limited, trading as TMGM, is regulated by the Australian Securities and Investments Commission (ASIC), AFSL no. 436416 and is located at Level 28, One International Tower, 100 Barangaroo Avenue, 2000 Sydney, NSW Australia.
Email: support@tmgm.com.au
Trademax Global Limited, trading as TMGM, is authorized and regulated by the Vanuatu Financial Services Commission (VFSC), registration number 40356 and registered at 1276, Kumul Highway, Port Vila, Vanuatu, Republic of Vanuatu.
Email: support@tmgm.com
Trademax Global Markets (SE) Limited, trading as TMGM, is authorized and regulated by the Financial Services Authority (FSA) of Seychelles, with license number SD224. The company is registered at Office No 13, Providence Estate ABIS Centre, Mahe, Seychelles.
Email: support@tmgm.com
Trademax Global Markets (International) Pty Ltd, trading as TMGM, is authorized and regulated by the Financial Services Commission, Mauritius (FSC) with license no. GB22201012, and registered at 33, Edith Cavell Street C/o IQ EQ Fund Services (Mauritius) Ltd Port Louis, 11324 Mauritius.
Email: support@tmgm.com
Copyright © TMGM. All rights reserved