

Trading
Explore a wide range of markets with competitive pricing, deep liquidity, and advanced trading tools.
Learn More 
Platform
Trade seamlessly with TMGM's powerful platform, built for speed, precision, and a superior trading experience.
Learn More Trading Platform
Academy
Learn the fundamentals of trading with beginner-friendly resources, including guides, webinars, and market insights.
Learn More News & Analysis
Get real-time market updates and expert analysis to stay ahead of trading opportunities
Learn More News & Analysis
About
Learn what sets TMGM apart — our global presence, regulatory strength, and commitment to innovation in trading.
Learn More Why Choose TMGM
Sponsorship
XRP and XLM Regain Momentum: Ripple and Stellar Outlook as Derivatives Activity Increases
- $1.35 holds beneath XRP’s recovery. Gains extend into a second consecutive day, supported by the 100-day EMA.
- $0.1800 returns as immediate support for XLM, with the RSI’s recovery towards bullish territory lending support.
- 2.23 billion XRP and 1.22 billion XLM mark the higher perpetual futures Open Interest totals, signalling greater derivatives market activity.
XRP has advanced above $1.36. Alongside Ripple (XRP), Stellar (XLM) is rebuilding momentum on Wednesday, with both tracking gains in major digital assets. XLM has hit $0.1854, and the advances reinforce recently tested support levels. Prices are edging higher against a backdrop of persistent United States (US) inflation, ahead of next week’s Federal Reserve (Fed) monetary policy decision.

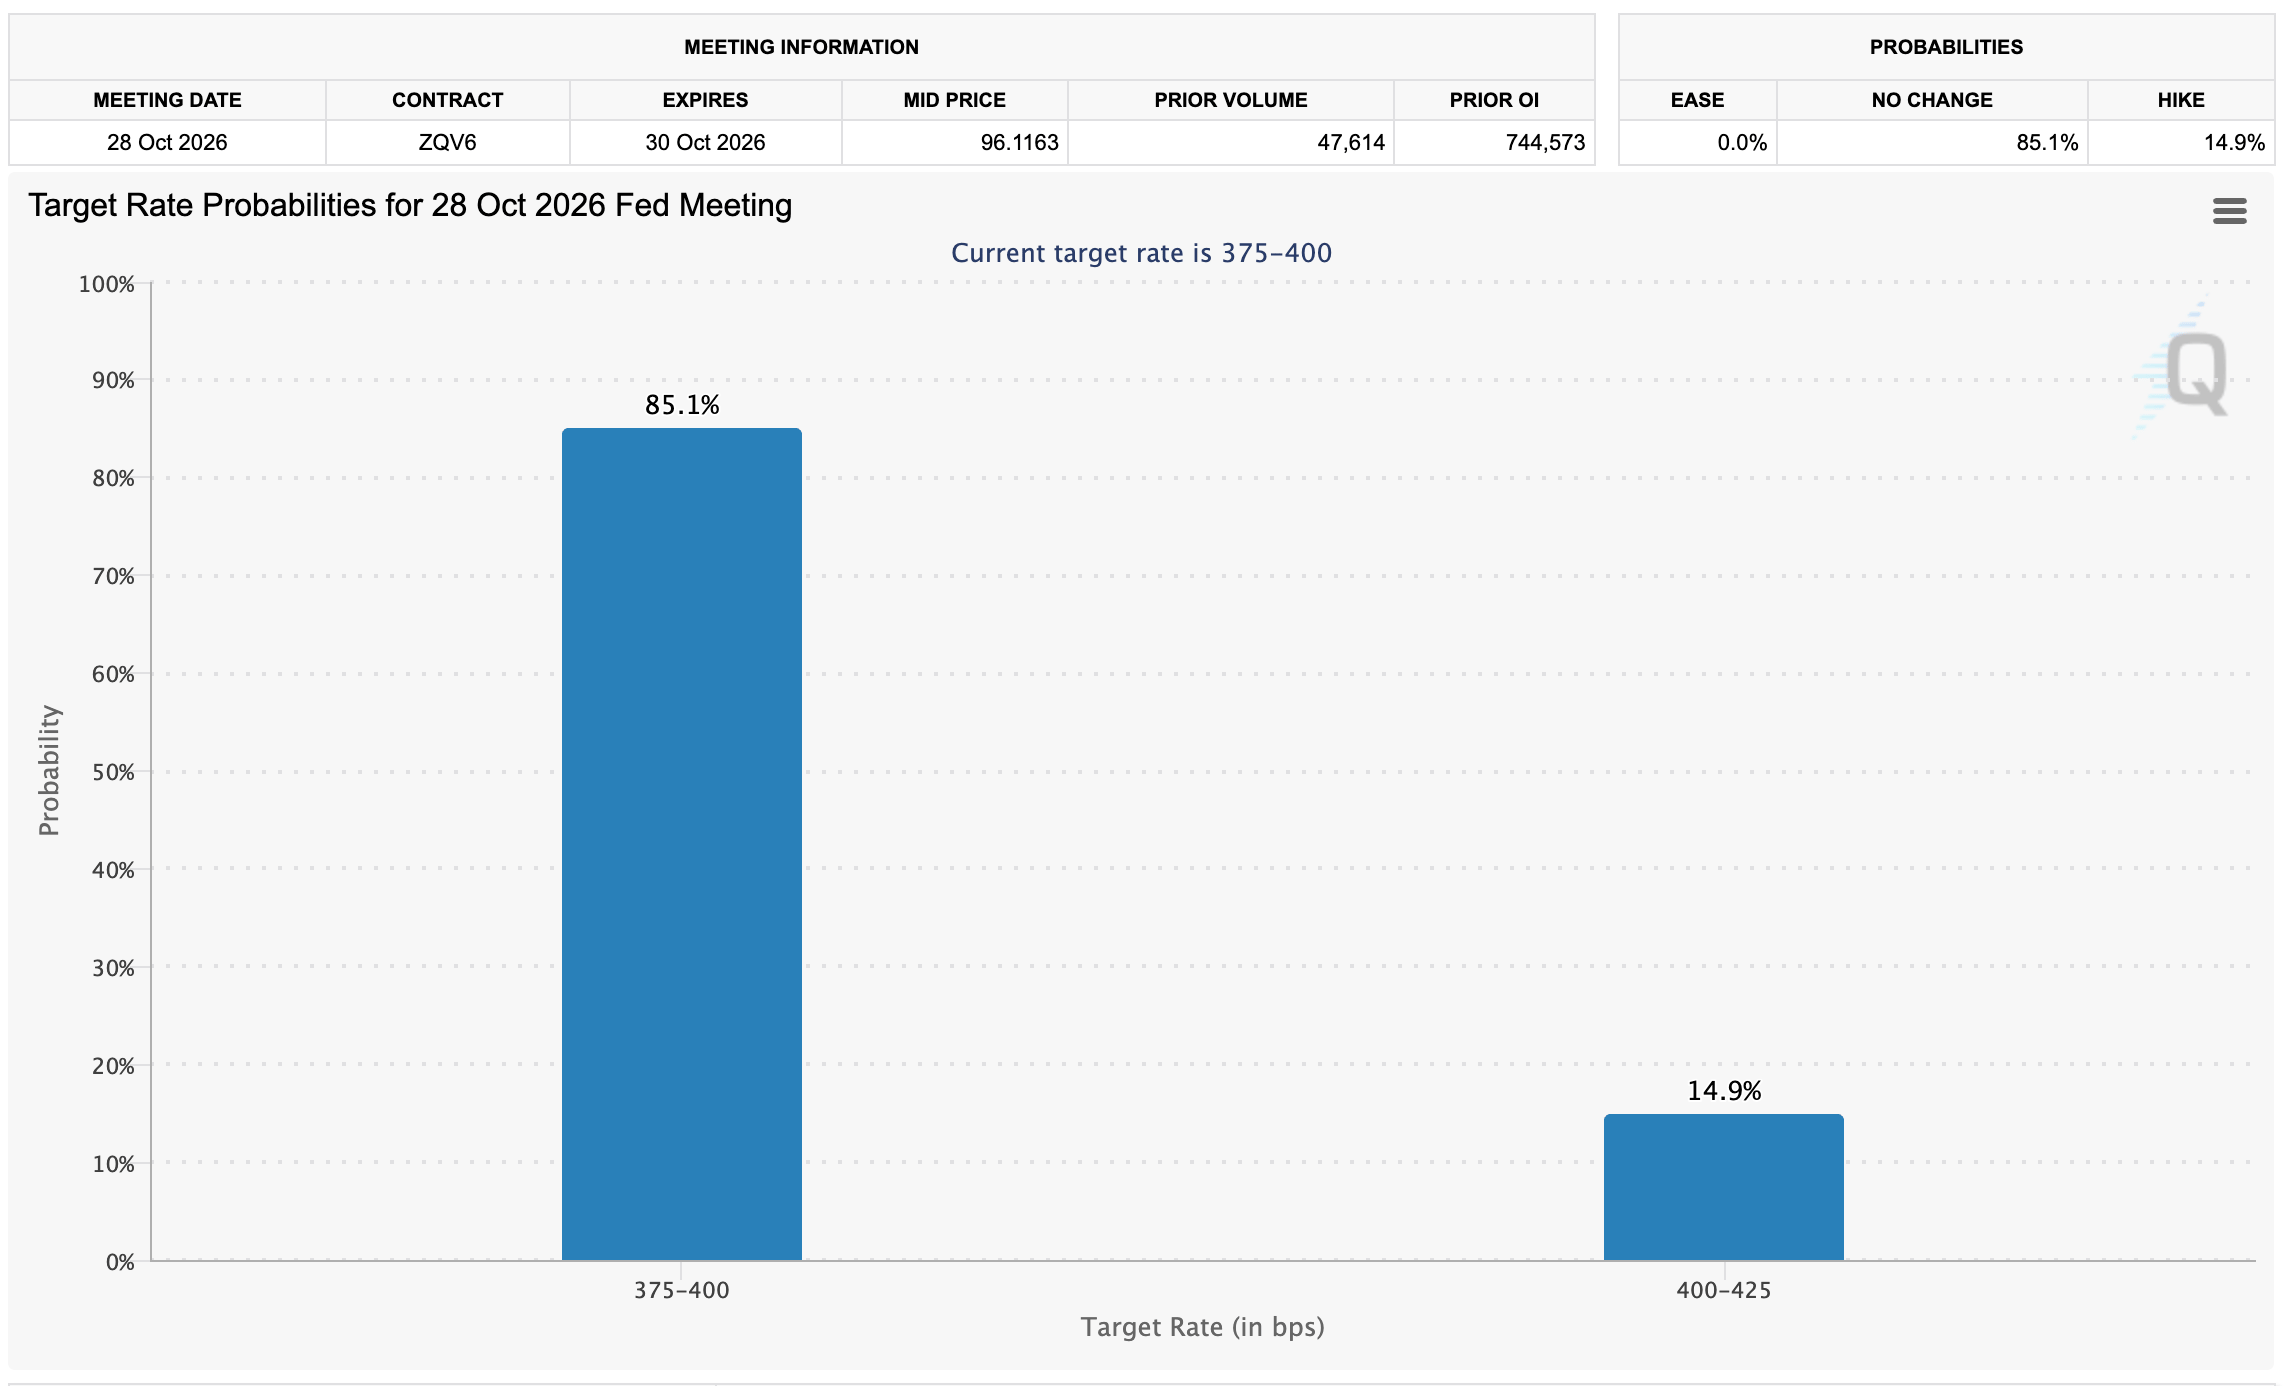
An 85% probability of interest rates remaining within the 3.75-4.00% range is priced in by the CME Group’s FedWatch Tool. The probability of a 25-basis-point increase is 15%. Even as XRP and XLM recover, traders appear to be keeping risk exposure limited ahead of the Fed decision.
XRP and XLM retail participation strengthens
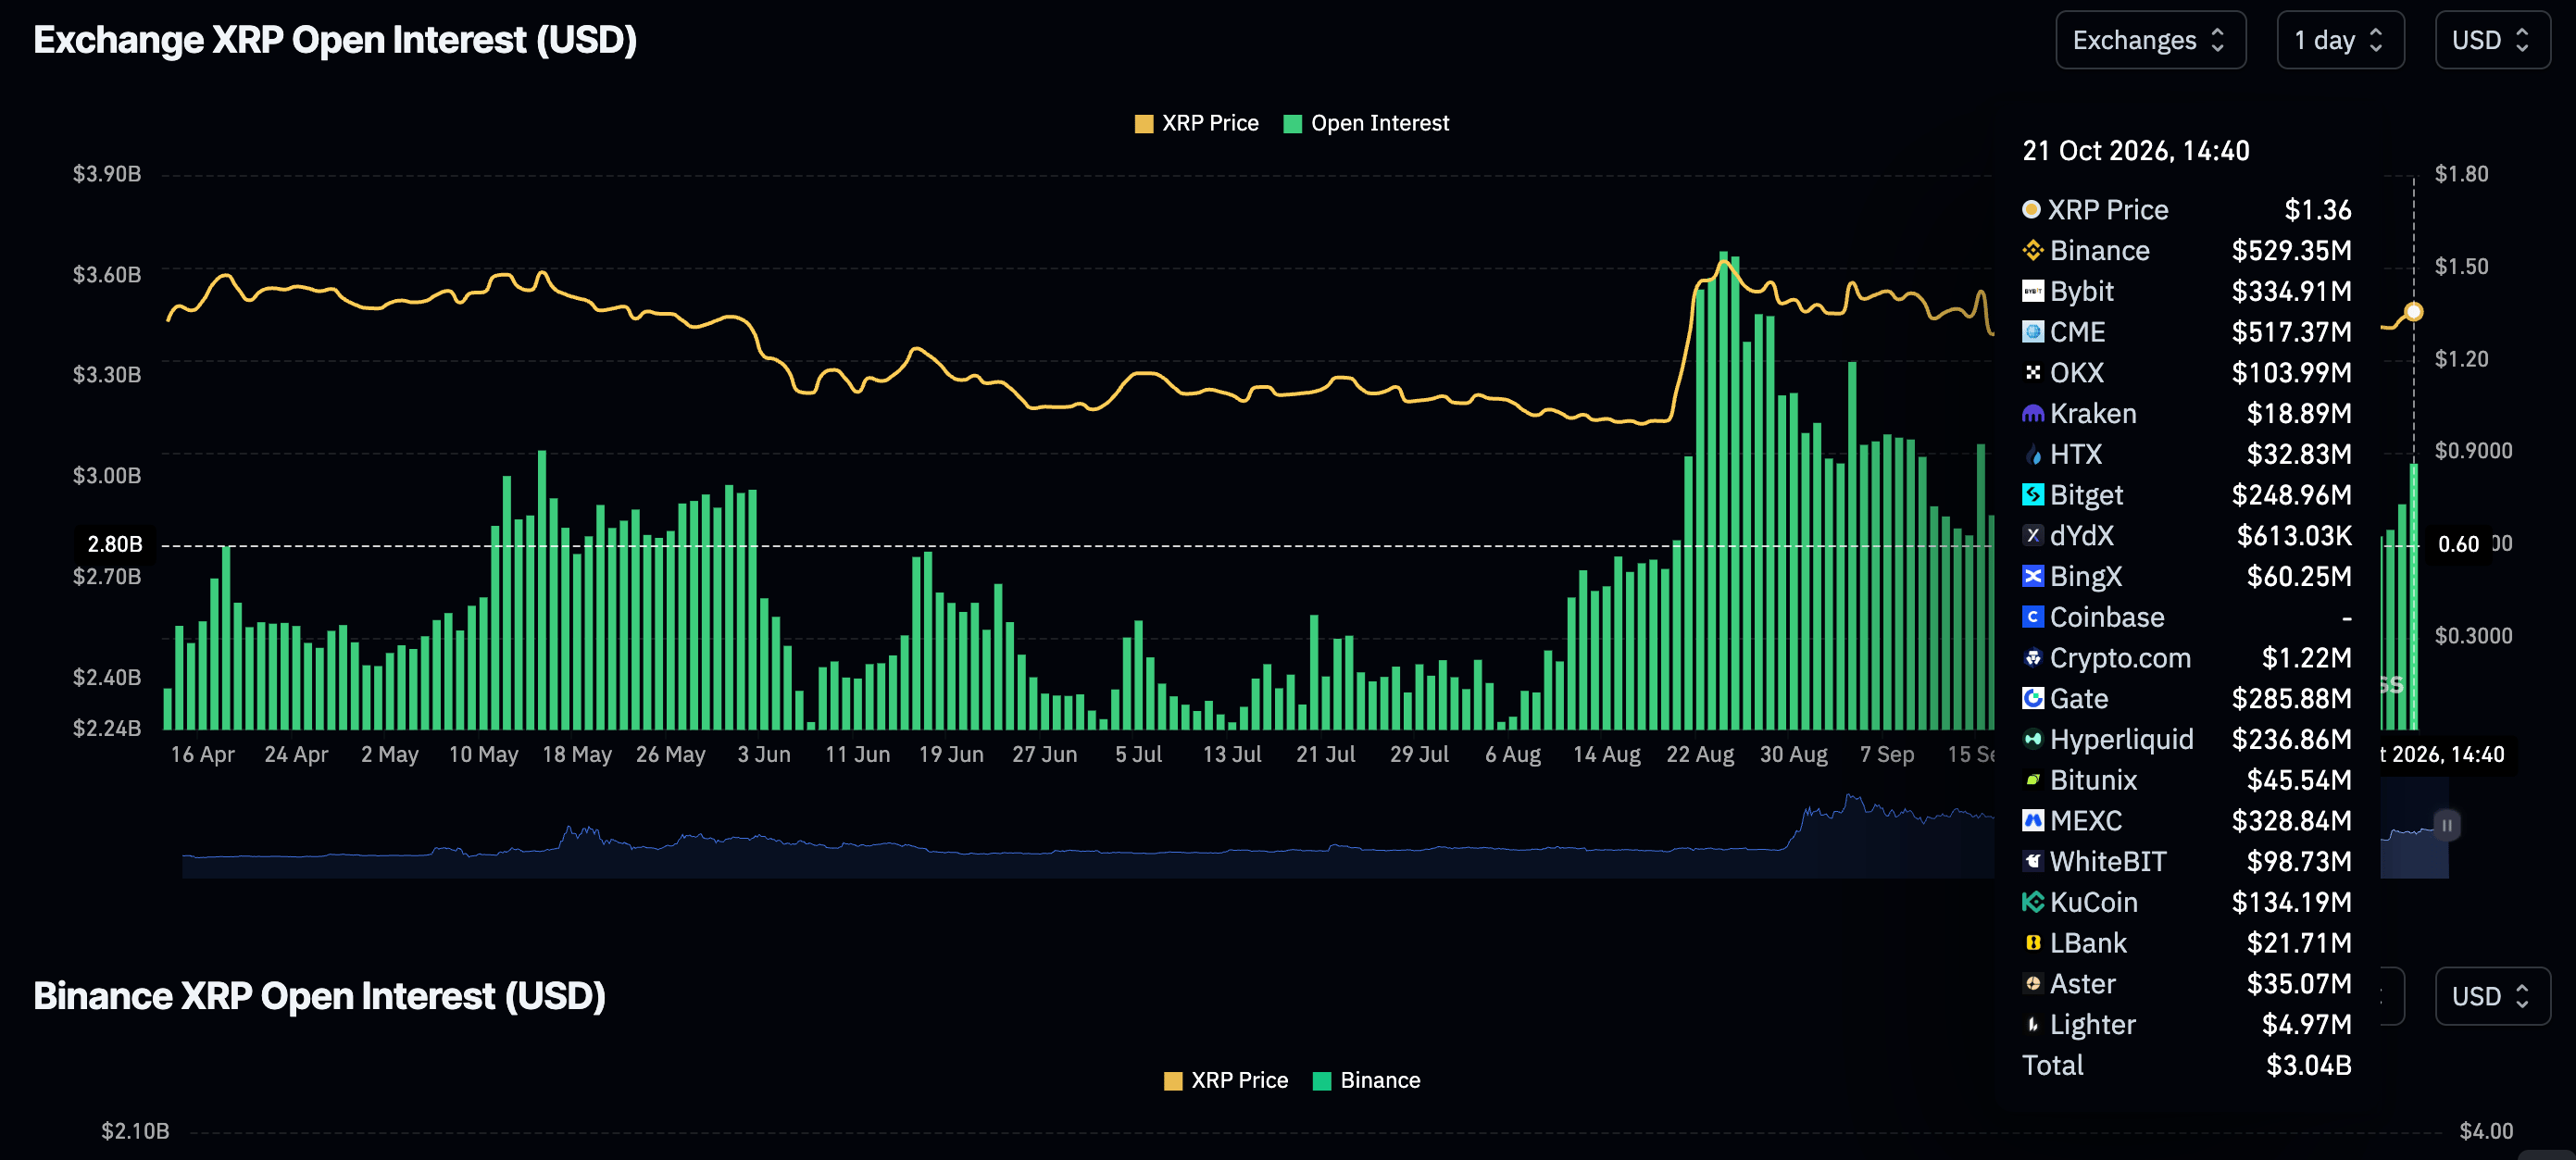
Perpetual futures Open Interest (OI) reached 2.23 billion XRP on Wednesday, a modest increase from 2.18 billion XRP a day earlier, as derivatives trading gathered pace. According to CoinGlass data, retail traders are attempting to establish an uptrend. OI stood at 2.12 billion XRP on Sunday.
Sustained interest is not yet confirmed, however. The latest reading remains well short of September’s peak of 2.46 billion XRP and August’s high of 2.77 billion XRP.
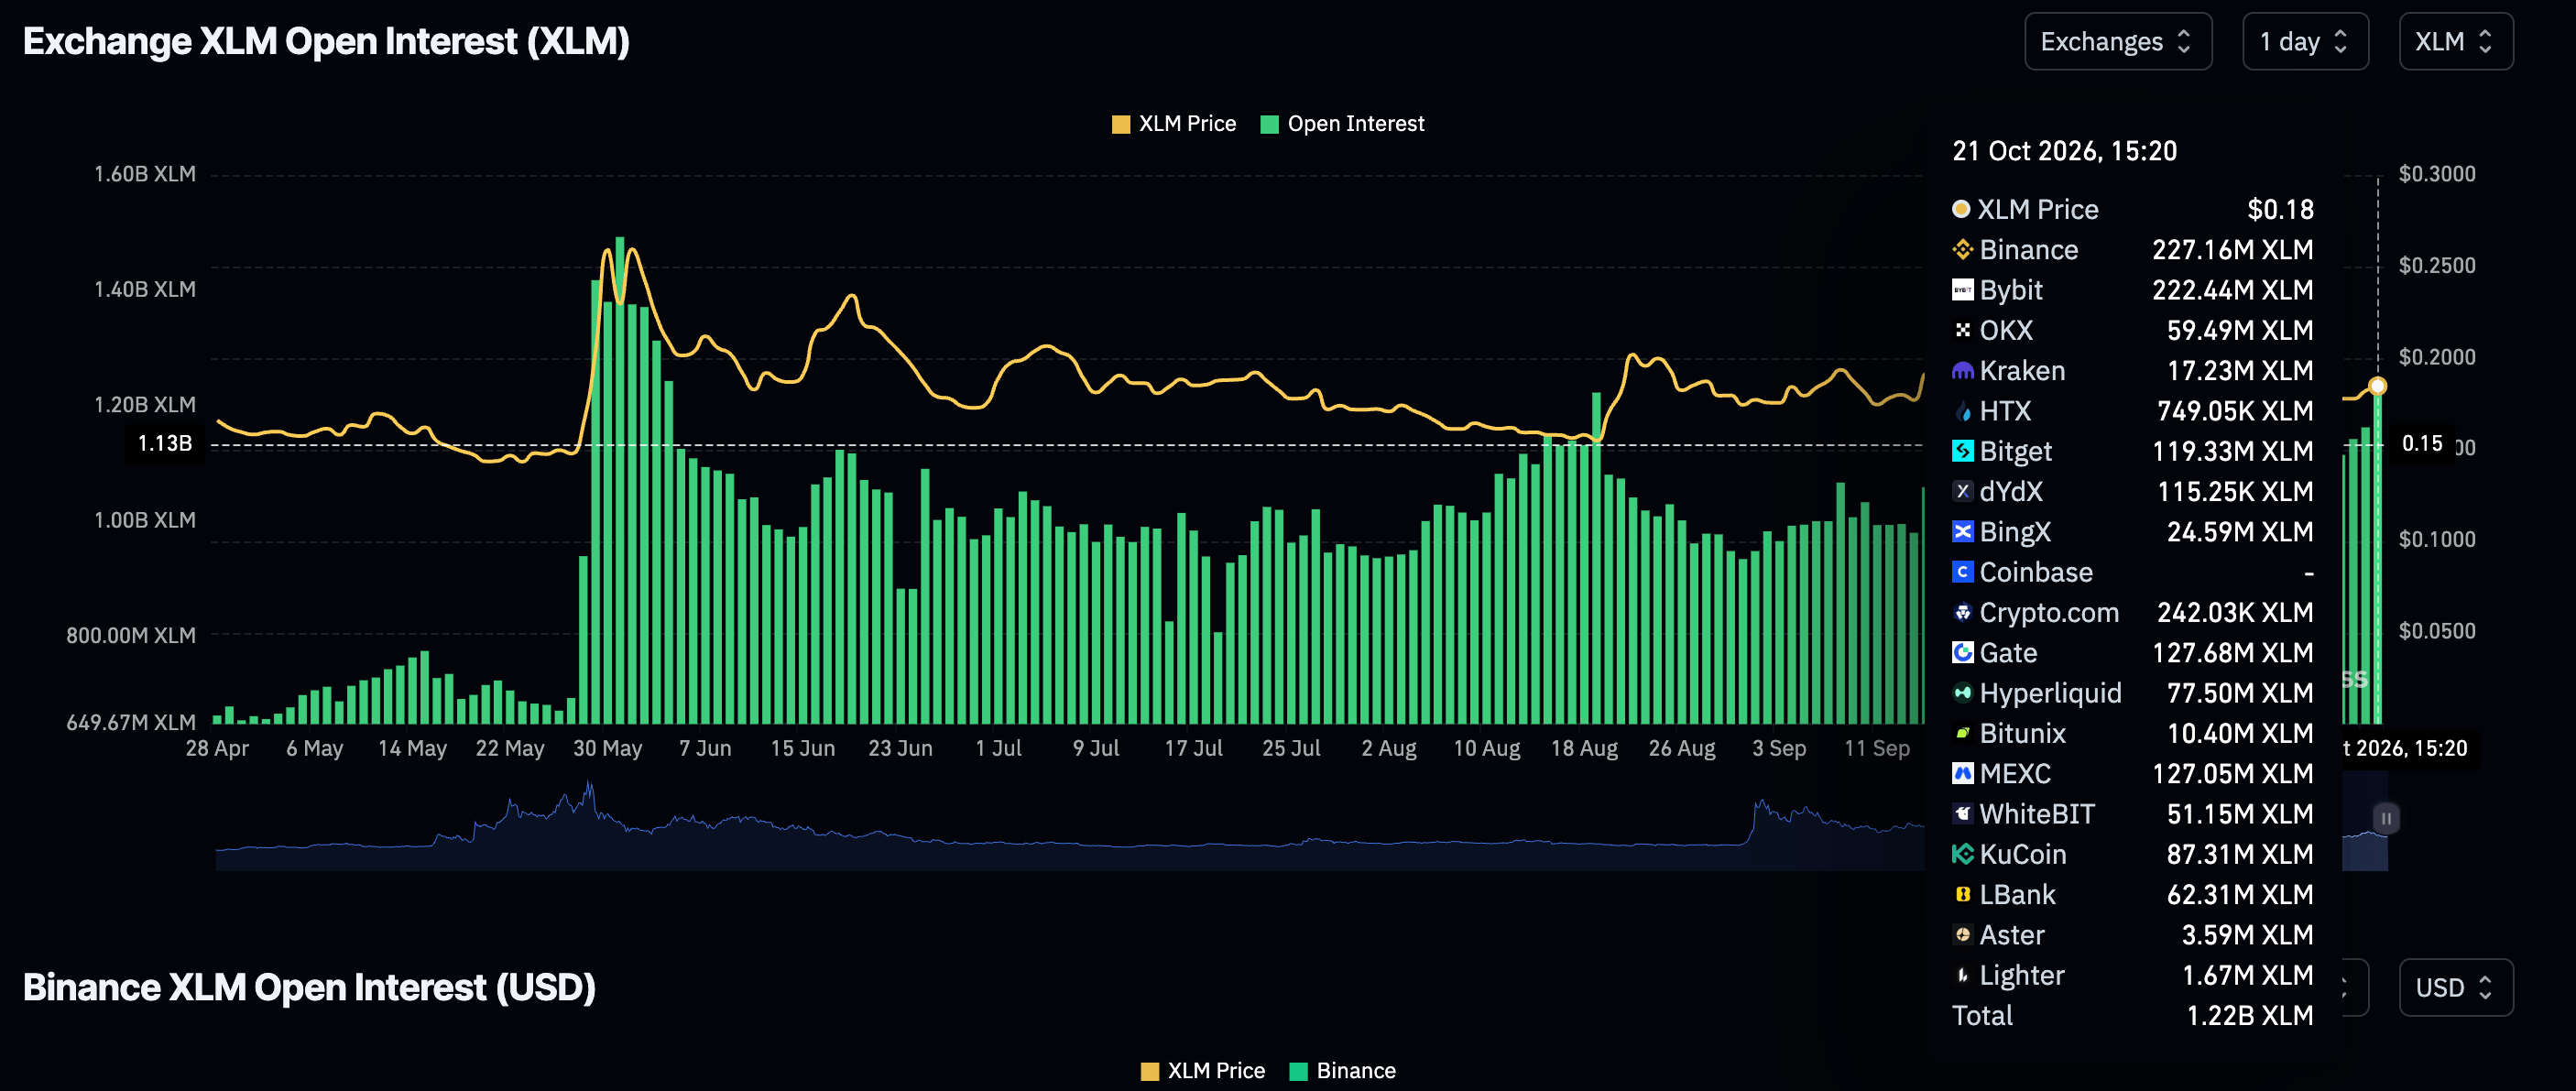
From 1.14 billion XLM the previous day, Stellar futures OI has increased to 1.22 billion XLM on Wednesday. Roughly 217 million XLM is held on Binance and 222 million XLM on Bybit. Total OI has recovered from Monday’s 1.12 billion XLM. Leveraged positions are expanding alongside the price advance, suggesting a recovery in speculative interest in the token.
XRP technical analysis: Selling pressure fades as price advances
At $1.36, XRP remains beneath both the 50-day and 200-day Exponential Moving Averages (EMAs), each at $1.38. That positioning maintains a bearish near-term bias, notwithstanding the latest rebound from recent lows.
Overhead barriers remain at the $1.47 SuperTrend line and the broader descending resistance trendline projected towards $1.61. With the Relative Strength Index (RSI) near 46 in neutral territory and the Moving Average Convergence Divergence (MACD) still marginally negative, the indicators point to fading upward momentum rather than a decisive bullish reversal.
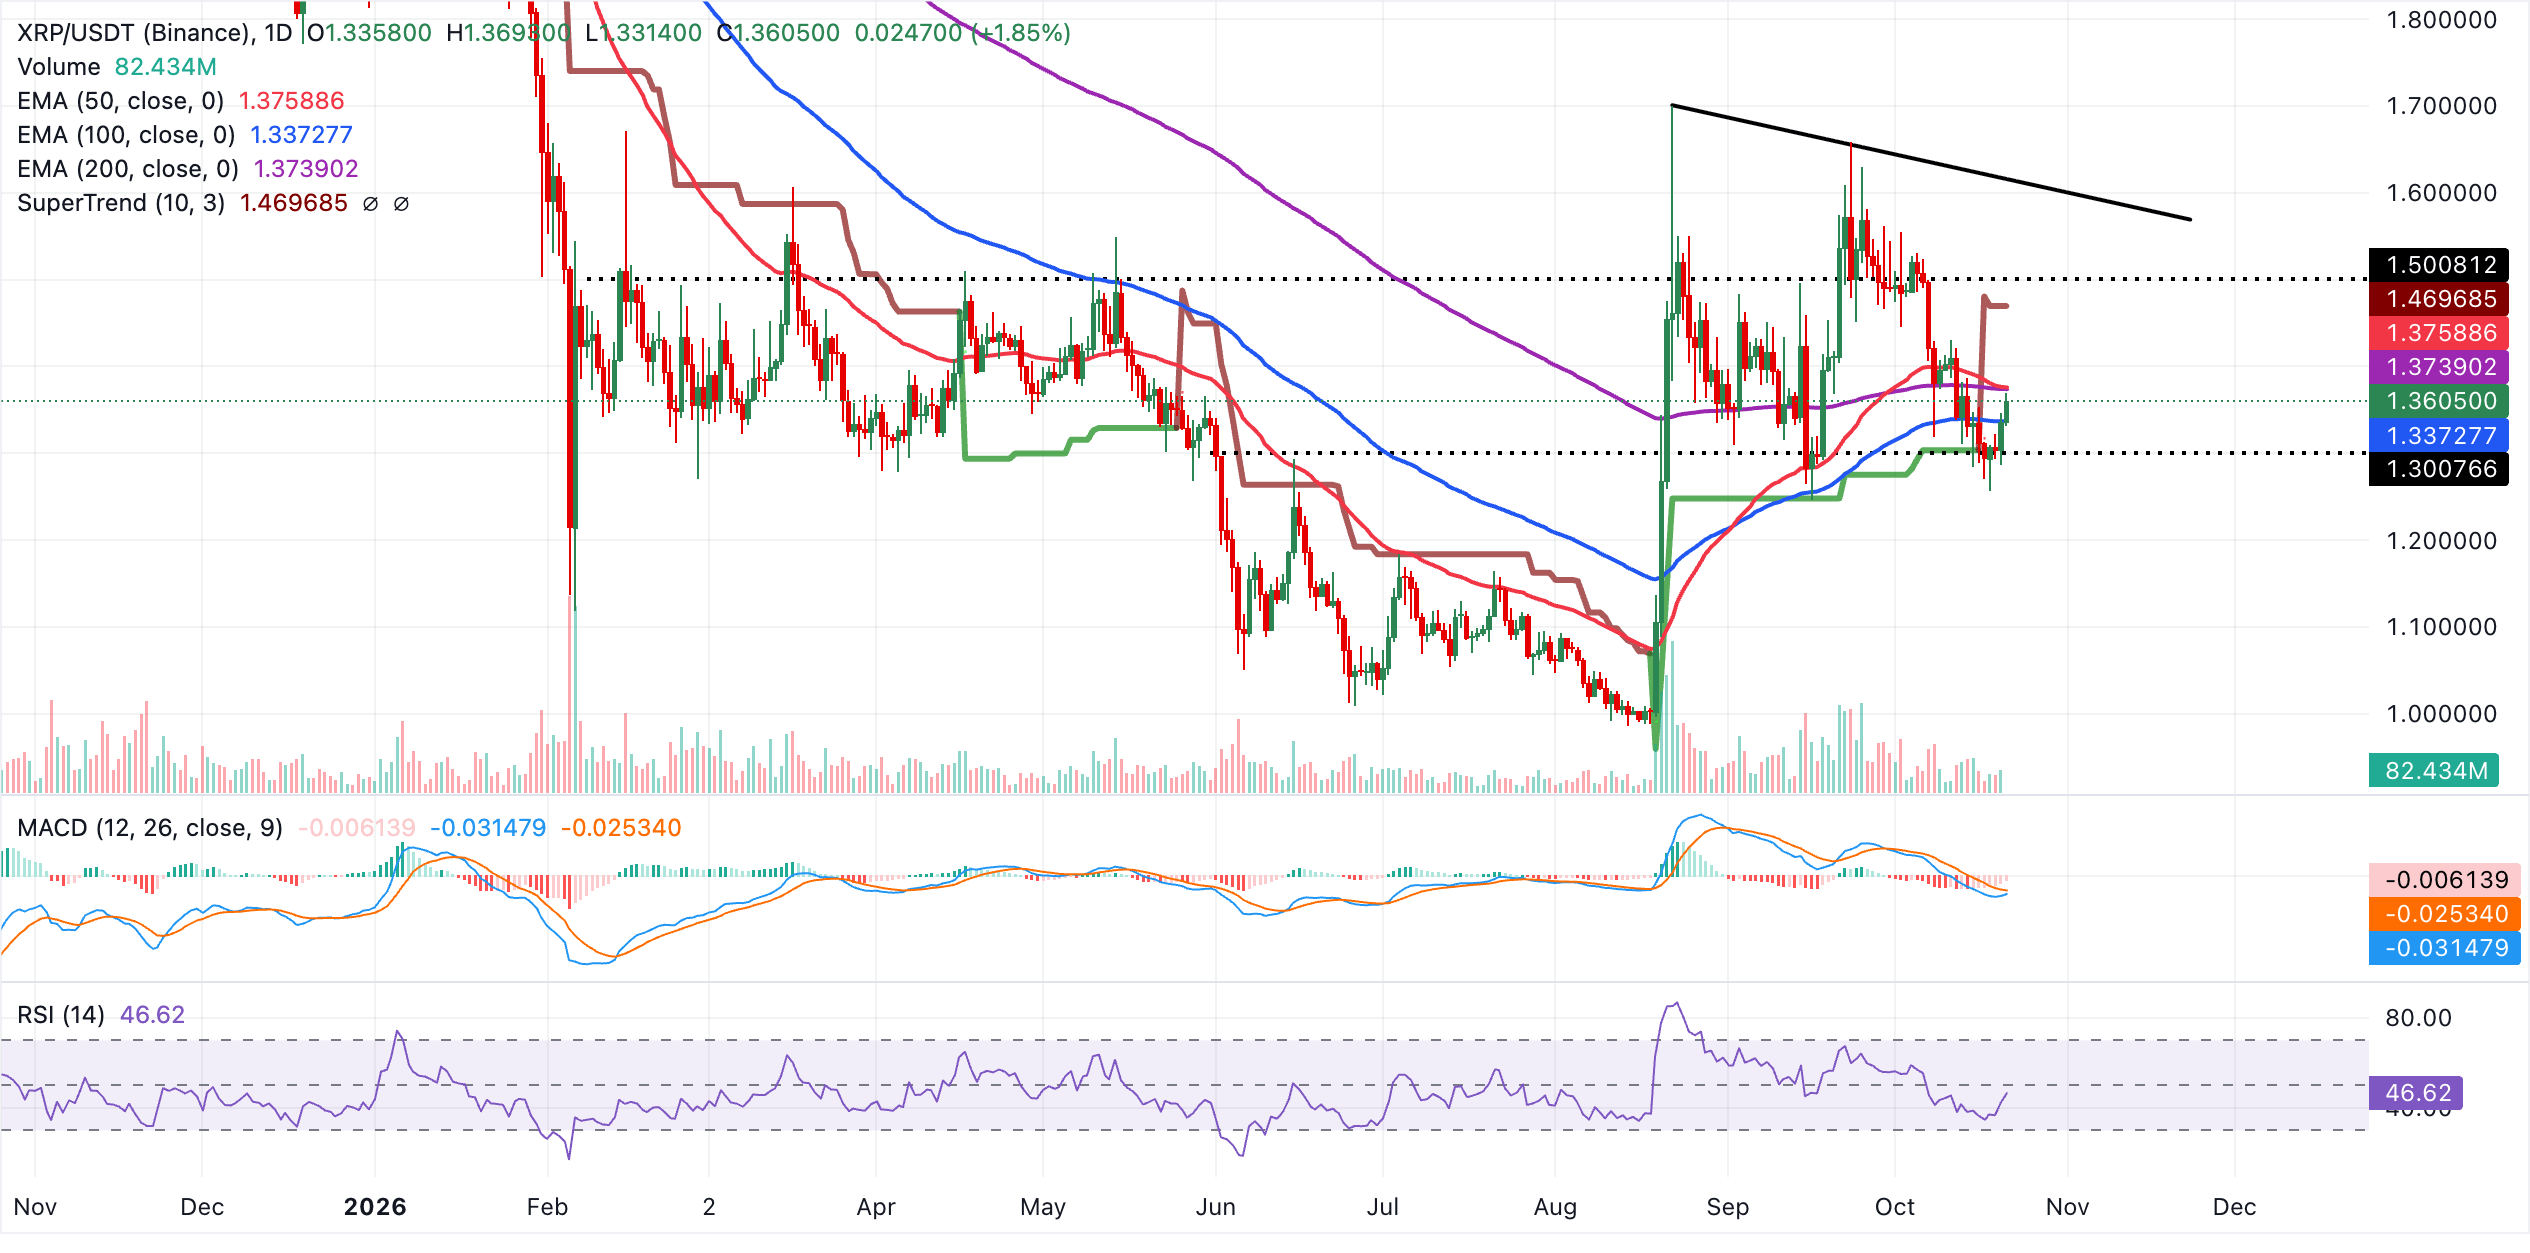
The 200-day EMA forms the first resistance level, overlapping with the 50-day EMA around $1.38. To relieve the prevailing downward pressure, XRP would need a daily close above this cluster. Beyond it, the SuperTrend barrier around $1.47 and the descending trendline area towards $1.62 present further hurdles. Initial downside support sits at the 100-day EMA of $1.34. A breach would likely pave the way for a larger retreat towards earlier price lows.
Stellar technical analysis: XLM bulls seek recovery on firmer momentum
At $0.1854, XLM is moving higher as buyers build momentum above recently established support around $0.1700. The two-day rise has not removed the bearish bias: the token remains beneath the 50-day, 100-day and 200-day EMAs, grouped between approximately $0.1900 and $0.1946. It also trades below SuperTrend resistance at $0.2060. A slowly recovering but negative MACD, together with an RSI near 44, indicates muted momentum rather than a forceful reversal.
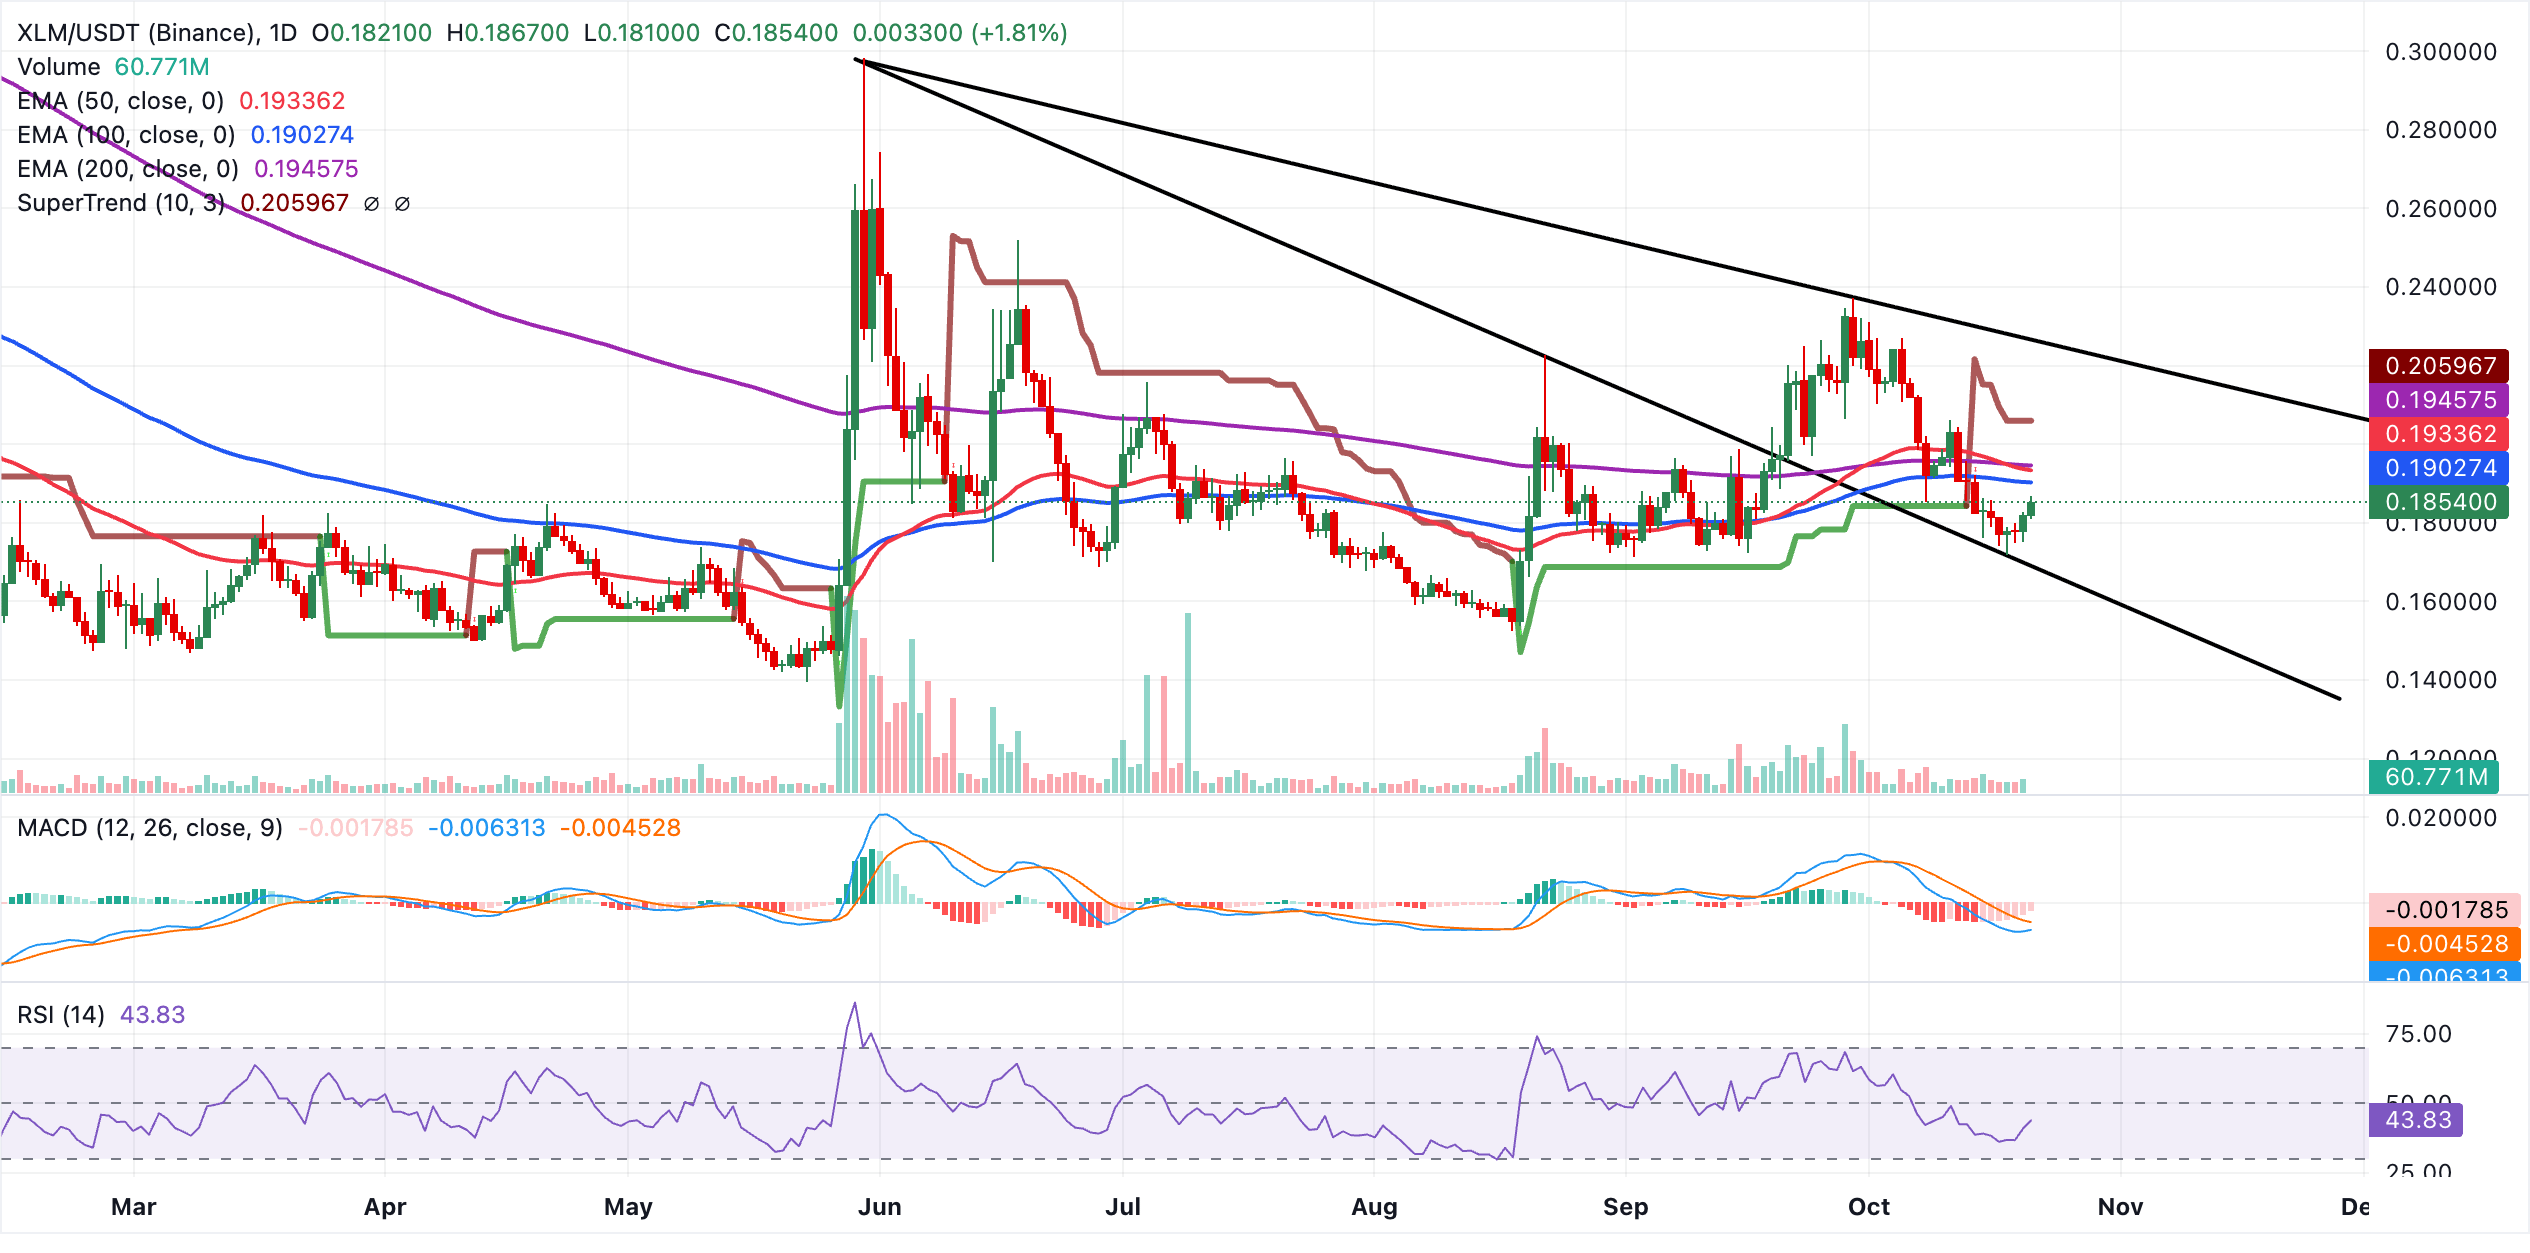
The 100-day EMA at $0.1903 is the first upside hurdle. Next come the 50-day EMA at $0.1934 and the 200-day EMA at $0.1946, forming a tight resistance cluster ahead of the $0.2060 SuperTrend level. Further up, descending trendline resistance sits around $0.2263. For downside moves, attention centres on the current $0.1854 price pivot. A sustained breach would bring the previous descending trendline breakout zone near $0.1685 into view as the next significant support.
(The technical analysis of this story was written with the help of an AI tool. Know more.)
FAQs on Bitcoin, altcoins and stablecoins
Ranked as the largest cryptocurrency by market capitalisation, Bitcoin is a virtual currency created to function as money. No single individual, group or entity can control this payment method, removing the need for third parties to participate in financial transactions.
Any cryptocurrency other than Bitcoin is classed as an altcoin, although some also exclude Ethereum because these two cryptocurrencies are the origins of forks. Under that interpretation, Litecoin is the first altcoin. It was forked from the Bitcoin protocol and is therefore an “improved” version of it.
Designed to maintain a steady price, stablecoins are cryptocurrencies backed by reserves of the assets they represent. Each stablecoin is pegged to a commodity or financial instrument, such as the US Dollar (USD), while an algorithm or demand regulates its supply. Their primary purpose is to give investors a route into and out of cryptocurrency trading and investment. They also offer a way to store value, given the volatility generally associated with cryptocurrencies.
Comparing Bitcoin’s market capitalisation with the combined market capitalisation of all cryptocurrencies gives the Bitcoin dominance ratio. This measure illustrates investor interest in Bitcoin. BTC dominance is typically high before and during a bull run, when investors favour relatively stable cryptocurrencies with large market capitalisations, such as Bitcoin. Falling BTC dominance generally signals a shift of capital and/or profits into altcoins in pursuit of greater returns. That shift usually sparks a surge in altcoin rallies.
POPULAR ARTICLES
118.70 draws closer for USD/MXN as Iran tensions intensify Mexican Peso sell-off2Colombian Peso: Further tightening expected from BanRep – Standard Chartered3Asia FX: Safe havens in focus amid risk-off bias – MUFG46.50% through 2027: Banxico expected to stay on hold, Citi Mexico Survey shows5Above $4,130: Gold recovers as Oil eases ahead of Fed decision6Forex Today: Markets keep watch on US data and geopolitics7XRP and XLM Regain Momentum: Ripple and Stellar Outlook as Derivatives Activity Increases8One-month high for Australian Dollar as hawkish RBA lends support91.3400 remains out of reach as British Pound stalls despite hot UK CPI and BoE rate-hike bets
LIVE QUOTES


ALL ABOUT TECHNICAL
What Is the Dark Cloud Cover Pattern and How Do You Trade It?
What Is the Piercing Line Candlestick Pattern and How Do You Trade It?
What Are Tweezer Top and Bottom Candlestick Patterns?
Inside Bar Candlestick Pattern: What It Is, How to Identify It, and How to Trade It
Hanging Man Candlestick Pattern: How to Identify and Trade It
How to Draw Fibonacci Retracement: Mastering the Golden Ratio in Trading
What is the Relative Strength Index (RSI)
What is Scalping in Trading & How Does It Work
Get Started!
Sign up and access the Global Markets in less than 3 minutes

Connect With Us









Contacts
Phone: +61 2 8036 8388
Fax: +61 2 8036 8388
Email: support@tmgm.com



The information provided on this website is of a general nature only and does not constitute personal financial advice. Before acting on any information on this website, you should consider the suitability of the information in relation to your objectives, financial situation and needs. Investing in CFDs and FX Margin Contracts carries significant risks and is not suitable for all investors. You may lose more than your initial deposit. You do not own, or have, any interest in the underlying asset. We recommend that you seek independent advice and ensure you fully understand the risks involved before trading. It is important that you read and consider the disclosure document before you acquire any product listed on the website. The information and advertisements offered on this website are not intended for use by any person in any country or jurisdiction where such use would be contrary to local laws and regulations. The Products and Services offered on this website are not intended for residents of the United States, Malaysia and Thailand.
TMGM is authorized and regulated in various jurisdictions.
Trademax Australia Limited, trading as TMGM, is regulated by the Australian Securities and Investments Commission (ASIC), AFSL no. 436416 and is located at Level 28, One International Tower, 100 Barangaroo Avenue, 2000 Sydney, NSW Australia.
Email: support@tmgm.com.au
Trademax Global Limited, trading as TMGM, is authorized and regulated by the Vanuatu Financial Services Commission (VFSC), registration number 40356 and registered at 1276, Kumul Highway, Port Vila, Vanuatu, Republic of Vanuatu.
Email: support@tmgm.com
Trademax Global Markets (SE) Limited, trading as TMGM, is authorized and regulated by the Financial Services Authority (FSA) of Seychelles, with license number SD224. The company is registered at Office No 13, Providence Estate ABIS Centre, Mahe, Seychelles.
Email: support@tmgm.com
Trademax Global Markets (International) Pty Ltd, trading as TMGM, is authorized and regulated by the Financial Services Commission, Mauritius (FSC) with license no. GB22201012, and registered at 33, Edith Cavell Street C/o IQ EQ Fund Services (Mauritius) Ltd Port Louis, 11324 Mauritius.
Email: support@tmgm.com
Copyright © TMGM. All rights reserved