

Trading
Explore a wide range of markets with competitive pricing, deep liquidity, and advanced trading tools.
Learn More 
Platform
Trade seamlessly with TMGM's powerful platform, built for speed, precision, and a superior trading experience.
Learn More Trading Platform
Academy
Learn the fundamentals of trading with beginner-friendly resources, including guides, webinars, and market insights.
Learn More News & Analysis
Get real-time market updates and expert analysis to stay ahead of trading opportunities
Learn More News & Analysis
About
Learn what sets TMGM apart — our global presence, regulatory strength, and commitment to innovation in trading.
Learn More Why Choose TMGM
Sponsorship
Near $52: XAG/USD Tumbles as Fed’s Waller Warns of Larger Rate Hike – Silver Price Forecast
- $52.20 in sight as Silver price slumps on Fed Waller’s larger rate hike warning.
- Fed Waller’s warning of aggressive monetary tightening lends support to the US Dollar.
- October’s US CPI release is firmly in investors’ focus.
Over 2% has been wiped off Silver price (XAG/USD). The metal trades near $52.20 in the European session, under heavy selling pressure after Federal Reserve (Fed) Governor Christopher Waller warned of a larger interest rate increase. His warning comes ahead of the United States (US) Consumer Price Index (CPI) release at 13:30 GMT.

Speaking during European trading, Fed Governor Waller called for additional monetary tightening. He also left open the possibility of a larger rate increase should inflationary pressures continue to build.
Fed Governor Waller said: “Half-point Fed rate hike may be needed in December, if October core CPI inflation comes in around 0.3% or higher,”
October US inflation tipped to ease before key Fed meeting
A marked easing in price pressures is now expected by economists at Deutsche Bank, following September’s strong reading. As they put it, “this time, our US economists expect inflation to have come down from its September pace, with both headline and core at +0.20% on the month,” pointing to expectations for a softer October CPI report ahead of the next Fed meeting.
In theory, non-yielding assets such as Silver become less attractive when concerns about aggressive Fed tightening intensify.
The US Dollar (USD) found some respite after Governor Christopher Waller warned of aggressive monetary tightening by the Fed. His comments helped the US Dollar Index (DXY) reverse its earlier losses and edge into positive territory above 101.70. The index measures the Greenback against six major currencies.
$52.36 Silver: bearish technical outlook below 20-day EMA
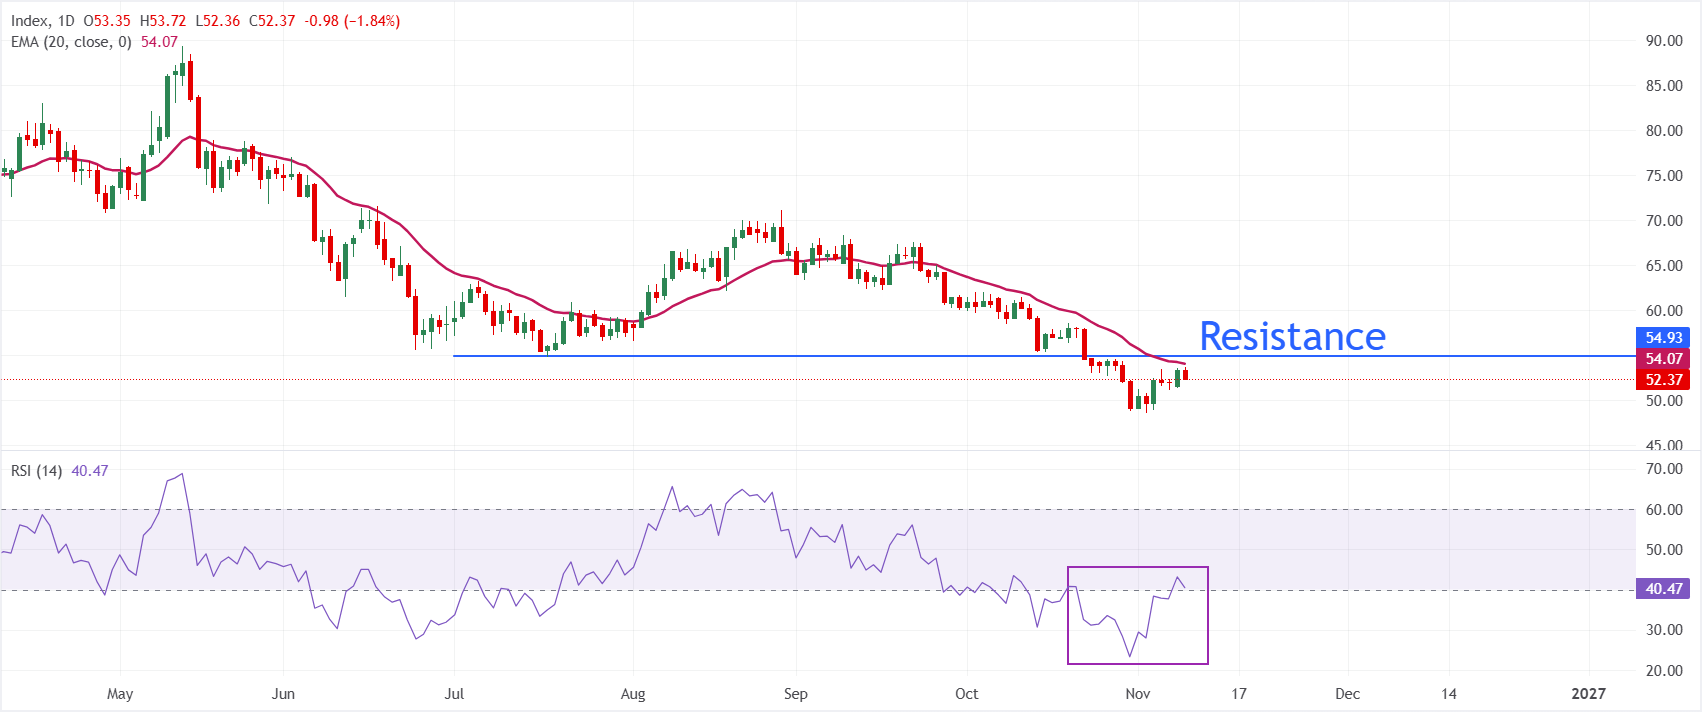
At $52.36 on the daily chart, XAG/USD remains below its 20-day Exponential Moving Average (EMA) of $54.07, leaving the near-term bias bearish. This dynamic barrier continues to constrain the price and weigh on the short-term trend. With the Relative Strength Index (14) near 40, momentum is weak rather than oversold, suggesting sellers retain the upper hand.
Initial significant resistance sits at the 20-day EMA of $54.07. Only a daily close above that level would relieve immediate downside pressure and pave the way for a corrective rebound. The current dataset identifies no nearby technical support. A further decline would therefore expose XAG/USD to tests of lower chart levels not covered here. Attention remains on whether buyers can regain the $54 area and stabilise the outlook.
(The technical analysis of this story was written with the help of an AI tool. Know more.)
Economic data indicator
Consumer Price Index excluding Food & Energy (MoM)
The Consumer Price Index (CPI) tracks inflationary or deflationary trends by periodically adding up the prices of a representative basket of goods and services. Compiled monthly, the data is published by the US Department of Labor Statistics. The MoM reading compares goods prices in the reference month with those in the preceding month. The CPI Ex Food & Energy removes the food and energy components, which are considered more volatile, to provide a more accurate gauge of price pressures. A higher reading is generally regarded as positive for the US Dollar (USD); a lower reading is generally regarded as negative.
Find out more.Next publication: Tue 10 November 2026 13:30
Release frequency: Every month
Consensus forecast: 0.2%
Prior reading: 0.3%
Data source: US Bureau of Labor Statistics
Around 2% YoY is the inflation rate envisaged under the US Federal Reserve’s mandate. The central bank has two objectives: price stability and maximum employment. Since the onset of the pandemic, which continues to this day, inflation has become the weakest pillar of that mandate. Supply-chain disruptions and bottlenecks continue to drive price pressures higher, leaving the Consumer Price Index (CPI) at multi-decade highs. Having already acted to curb inflation, the Fed is expected to retain an aggressive policy stance for the foreseeable future.
POPULAR ARTICLES
1Ripple Price Forecast: XRP Momentum Strengthens Despite Investor Capital Outflows2Brazilian Real: BRL faces pressure from politics and commodities - ING3Swedish Krona: Currency performance key to Riksbank policy path – BNY40.6710 area offers support for Australian Dollar against US Dollar as outlook continues to deteriorate5Hungarian Forint: HUF faces pressure against Euro as MNB maintains dovish stance – Commerzbank6UK consumer inflation growth slows: Pound Sterling price news and forecast as GBP extends retreat7Swiss Franc drops on monetary policy divergence; focus turns to Fed minutes8British Pound: MUFG Expects Inflation Spike to Remain Contained9Lowest in over a year: Gold plunges as Fed rate hike bets mount


Get Started!
Sign up and access the Global Markets in less than 3 minutes

Connect With Us









Contacts
Phone: +61 2 8036 8388
Fax: +61 2 8036 8388
Email: support@tmgm.com



The information provided on this website is of a general nature only and does not constitute personal financial advice. Before acting on any information on this website, you should consider the suitability of the information in relation to your objectives, financial situation and needs. Investing in CFDs and FX Margin Contracts carries significant risks and is not suitable for all investors. You may lose more than your initial deposit. You do not own, or have, any interest in the underlying asset. We recommend that you seek independent advice and ensure you fully understand the risks involved before trading. It is important that you read and consider the disclosure document before you acquire any product listed on the website. The information and advertisements offered on this website are not intended for use by any person in any country or jurisdiction where such use would be contrary to local laws and regulations. The Products and Services offered on this website are not intended for residents of the United States, Malaysia and Thailand.
TMGM is authorized and regulated in various jurisdictions.
Trademax Australia Limited, trading as TMGM, is regulated by the Australian Securities and Investments Commission (ASIC), AFSL no. 436416 and is located at Level 28, One International Tower, 100 Barangaroo Avenue, 2000 Sydney, NSW Australia.
Email: support@tmgm.com.au
Trademax Global Limited, trading as TMGM, is authorized and regulated by the Vanuatu Financial Services Commission (VFSC), registration number 40356 and registered at 1276, Kumul Highway, Port Vila, Vanuatu, Republic of Vanuatu.
Email: support@tmgm.com
Trademax Global Markets (SE) Limited, trading as TMGM, is authorized and regulated by the Financial Services Authority (FSA) of Seychelles, with license number SD224. The company is registered at Office No 13, Providence Estate ABIS Centre, Mahe, Seychelles.
Email: support@tmgm.com
Trademax Global Markets (International) Pty Ltd, trading as TMGM, is authorized and regulated by the Financial Services Commission, Mauritius (FSC) with license no. GB22201012, and registered at 33, Edith Cavell Street C/o IQ EQ Fund Services (Mauritius) Ltd Port Louis, 11324 Mauritius.
Email: support@tmgm.com
Copyright © TMGM. All rights reserved