

Trading
Explore a wide range of markets with competitive pricing, deep liquidity, and advanced trading tools.
Learn More 
Platform
Trade seamlessly with TMGM's powerful platform, built for speed, precision, and a superior trading experience.
Learn More Trading Platform
Academy
Learn the fundamentals of trading with beginner-friendly resources, including guides, webinars, and market insights.
Learn More News & Analysis
Get real-time market updates and expert analysis to stay ahead of trading opportunities
Learn More News & Analysis
About
Learn what sets TMGM apart — our global presence, regulatory strength, and commitment to innovation in trading.
Learn More Why Choose TMGM
Sponsorship
3 Top Price Predictions: Bitcoin, Ethereum, Ripple – BTC probes critical support, ETH remains under pressure below resistance, XRP losses deepen
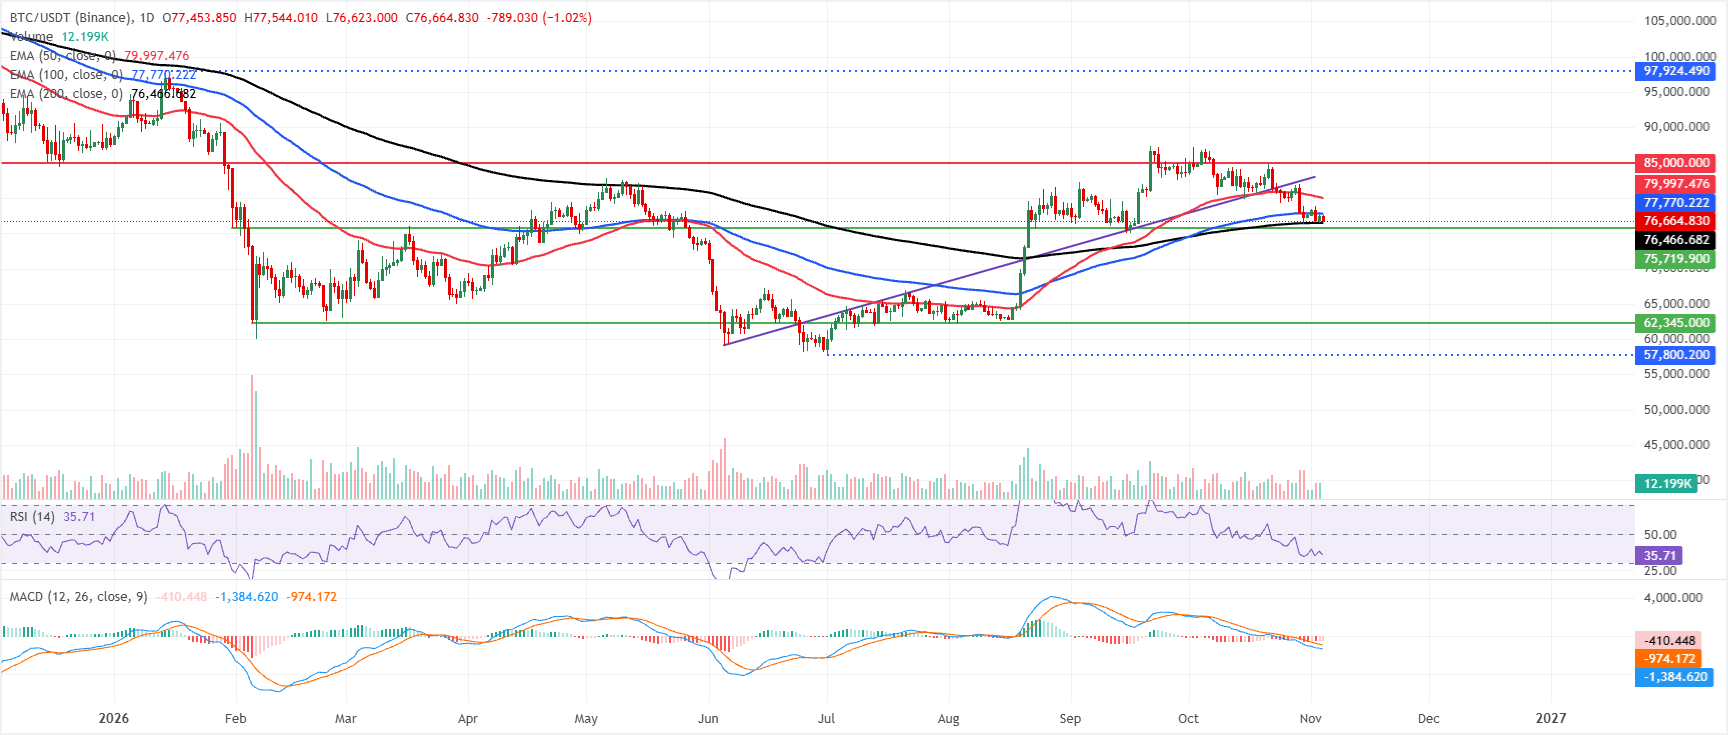
- $76,466 is Bitcoin’s key 200-day EMA level. The price drops towards it on Wednesday, with a decisive close below signalling scope for further losses.
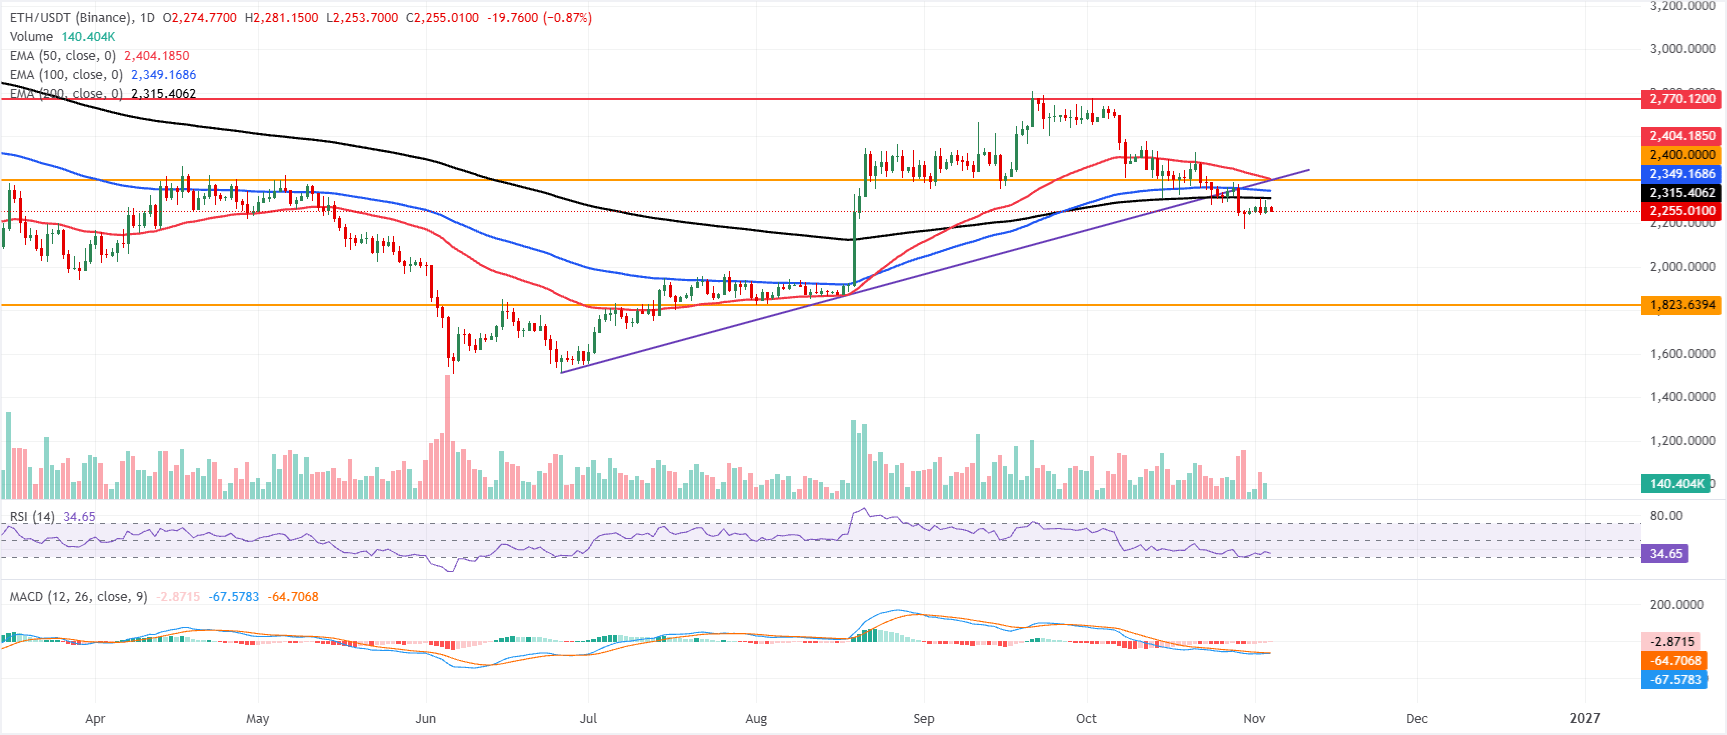
- Near $2,255, Ethereum continues to face selling pressure after failing to close above a crucial resistance zone.
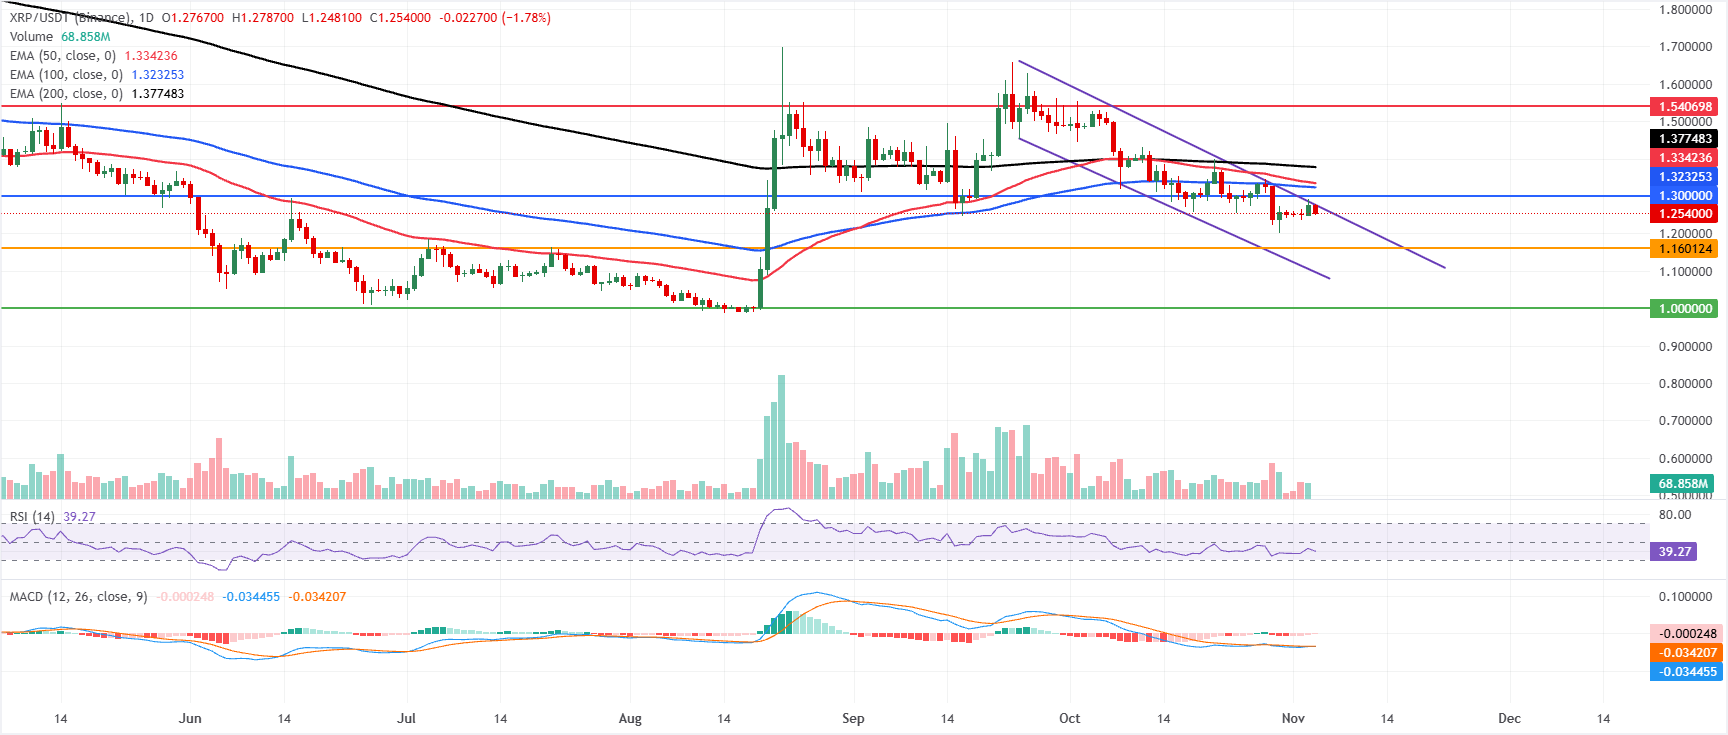
- Below $1.25, XRP encounters resistance at the upper trendline of its falling channel pattern.
$76,466 is the key support level approaching for Bitcoin (BTC). A decisive close beneath it could trigger a deeper decline. Bearish momentum keeps BTC, Ethereum (ETH) and Ripple (XRP) under pressure on Wednesday. With ETH unable to clear key resistance and XRP being rejected at the upper boundary of a falling channel pattern, all three point to the risk of further losses.

200-day EMA: Bitcoin risks deeper correction on a close below
$76,664 is Bitcoin’s Wednesday trading price. The near-term outlook remains bearish: BTC sits just above its 200-day Exponential Moving Average (EMA) at $76,466, while the 100-day EMA at $77,770 limits the upside.
Adding to overhead resistance is the 50-day EMA near $79,997. Around 35, the Relative Strength Index (RSI) points to easing downside pressure but offers no clear recovery signal. Despite tentative stabilisation above the 200-day EMA, the Moving Average Convergence Divergence (MACD) remains negative and below zero, indicating that bearish momentum retains control.
Any rebound would first encounter the 100-day EMA at $77,770, then the 50-day EMA around $79,997. Beyond these, the horizontal barrier near $85,000 presents a more substantial hurdle.
Immediate downside support sits at the 200-day EMA at $76,466. A decisive breach of this area would likely leave BTC vulnerable to a deeper correction over the coming sessions.
Ethereum remains below key resistance on a closing basis
At $2,255 on Wednesday, Ethereum retains a bearish near-term outlook below its 200-day and 100-day EMAs, at $2,315 and $2,349 respectively. The price has also fallen beneath the previously broken rising trendline, which now provides resistance near $2,399. An RSI reading of 34 places ETH close to oversold territory. Although bearish momentum has slowed, the negative MACD indicates that downside pressure persists.
A recovery would initially meet the 200-day EMA at $2,315, followed by the 100-day EMA at $2,349. Further resistance lies at the former trendline around $2,399 and a nearby horizontal barrier at $2,400. A stronger rebound would then encounter the 50-day EMA at $2,404, ahead of the higher ceiling at $2,770.
Should the decline continue, the horizontal support zone around $1,824 forms the key structural floor. Buyers would be expected to show greater interest there.
XRP retains a bearish bias
At $1.254 on Wednesday, XRP remains below its key EMAs, leaving the near-term bias bearish. Overhead resistance is layered across the 50-day EMA at $1.334, the 100-day EMA at $1.323 and the 200-day EMA at $1.377. These barriers reinforce the negative outlook as the price stays beneath the previous downward trendline break at $1.275.
With the RSI around 39 and the MACD slightly below zero, momentum remains weak. Selling pressure continues to dominate, although the immediate follow-through to the downside is not aggressive.
A rebound would first face the former trendline break around $1.275, then horizontal resistance at $1.300. The EMA cluster at $1.323 and $1.334 and the higher ceiling at $1.377 add further barriers, reinforcing the broader corrective structure. A more substantial recovery would likely encounter additional supply near $1.540 and $1.900.
Initial support lies at $1.160, ahead of a deeper floor at $1.000. A sustained move beneath these levels would create scope for a more pronounced bearish extension over the coming sessions.
(The technical analysis of this story was written with the help of an AI tool. Know more.)
Cryptocurrency prices: frequently asked questions
Demand and adoption among market participants are influenced by token launches. An exchange listing increases an asset’s liquidity and brings additional participants into its network. For a digital asset, this is generally bullish.
During a hack, an attacker uses exploits, bugs or other methods to seize a large quantity of an asset from a DeFi bridge, an exchange’s hot wallet or another crypto platform. The attacker subsequently moves the tokens off exchange platforms, ultimately selling them or swapping them for other cryptocurrencies or stablecoins. Widespread panic often follows, prompting a sell-off in the affected assets.
The direct effect on the US Dollar is the main channel through which macroeconomic events, such as interest-rate decisions by the US Federal Reserve, influence crypto assets. Higher interest rates generally weigh on Bitcoin and altcoin prices; lower rates tend to have the opposite effect. A fall in the US Dollar index makes risk assets and the leverage used to trade them cheaper, in turn lifting cryptocurrency prices.
By cutting miners’ block rewards in half, halvings restrict the supply of an asset and are therefore generally viewed as bullish events. When demand stays constant, a reduction in supply pushes the asset’s price higher.
POPULAR ARTICLES
11.1250 in view: Euro biased higher against US Dollar – UOB2$92 breached: Solana price forecast as SOL slides and downside risk builds3Indian Rupee extends gains as US midterm elections weigh on US Dollar4Swiss Franc strengthens as US Dollar faces pressure after US midterm elections5Above 1.1200: EUR/USD Price Forecast Highlights Gains Still Capped Below 100-day SMA6Australian Dollar rebounds as Democrats look to win both Houses7177.50: EUR/JPY Price Forecast as Pair Trades Below Level After Retreat From Descending Channel Top8Breaking: Senate control passes to Democrats9Near 101.25: US Dollar Index (DXY) plunges to late September lows as US election results emerge

Get Started!
Sign up and access the Global Markets in less than 3 minutes

Connect With Us









Contacts
Phone: +61 2 8036 8388
Fax: +61 2 8036 8388
Email: support@tmgm.com



The information provided on this website is of a general nature only and does not constitute personal financial advice. Before acting on any information on this website, you should consider the suitability of the information in relation to your objectives, financial situation and needs. Investing in CFDs and FX Margin Contracts carries significant risks and is not suitable for all investors. You may lose more than your initial deposit. You do not own, or have, any interest in the underlying asset. We recommend that you seek independent advice and ensure you fully understand the risks involved before trading. It is important that you read and consider the disclosure document before you acquire any product listed on the website. The information and advertisements offered on this website are not intended for use by any person in any country or jurisdiction where such use would be contrary to local laws and regulations. The Products and Services offered on this website are not intended for residents of the United States, Malaysia and Thailand.
TMGM is authorized and regulated in various jurisdictions.
Trademax Australia Limited, trading as TMGM, is regulated by the Australian Securities and Investments Commission (ASIC), AFSL no. 436416 and is located at Level 28, One International Tower, 100 Barangaroo Avenue, 2000 Sydney, NSW Australia.
Email: support@tmgm.com.au
Trademax Global Limited, trading as TMGM, is authorized and regulated by the Vanuatu Financial Services Commission (VFSC), registration number 40356 and registered at 1276, Kumul Highway, Port Vila, Vanuatu, Republic of Vanuatu.
Email: support@tmgm.com
Trademax Global Markets (SE) Limited, trading as TMGM, is authorized and regulated by the Financial Services Authority (FSA) of Seychelles, with license number SD224. The company is registered at Office No 13, Providence Estate ABIS Centre, Mahe, Seychelles.
Email: support@tmgm.com
Trademax Global Markets (International) Pty Ltd, trading as TMGM, is authorized and regulated by the Financial Services Commission, Mauritius (FSC) with license no. GB22201012, and registered at 33, Edith Cavell Street C/o IQ EQ Fund Services (Mauritius) Ltd Port Louis, 11324 Mauritius.
Email: support@tmgm.com
Copyright © TMGM. All rights reserved