
News & AnalysisCareer

Above $700 on Tuesday, BNB (BNB) is recovering as buyers seek to restore momentum after last week’s sell-off. Investor reaction to the security breach at Binance, the largest crypto exchange, was the main driver of the fall from Thursday’s highs above $760 to lows of $680.

Approximately $6.3 billion was affected by the hack, the largest in the crypto industry’s history. Working with blockchain stakeholders, Binance froze roughly $3 billion in assets believed to have been siphoned off by TraderTraitor, a hacker group linked to North Korea.
Deposits are exceeding withdrawals at Binance, generating net hourly inflows, co-founder Changpeng Zhao, popularly known as CZ, said on X on Tuesday. His update comes after the exchange resumed withdrawals on Sunday, having contained the security breach.
Initial withdrawals of $4.65 billion against deposits of $1.01 billion produced net outflows of about $3.64 billion, the exchange reported. According to Wednesday’s Proof of Reserves (PoR) snapshot, that amount equates to roughly 2.1% of Binance’s total assets under management of $171 billion.
Continued net hourly inflows could indicate that Binance has come through the disruption caused by the hack and is starting to regain users’ trust. To protect customers, Binance announced that it will meet the losses in full from its internal insurance fund and assets.
Retail appetite for BNB, however, has waned over recent days. Perpetual futures Open Interest (OI) stood at $1.74 million BNB on Tuesday, compared with 1.95 million BNB last Friday. This easing in retail risk appetite could put pressure on the token, constraining its recovery and increasing the likelihood of a prolonged sell-off.
At $700, BNB sits just above its 200-day Exponential Moving Average (EMA) near $692, offering immediate trend support. Overhead, the 100-day and 50-day EMAs at $708 and $729, respectively, continue to limit gains. Together with the SuperTrend line at $766, a subdued Relative Strength Index (RSI) around 39 and a negative Moving Average Convergence Divergence (MACD) histogram, this configuration points to a broadly bearish bias.
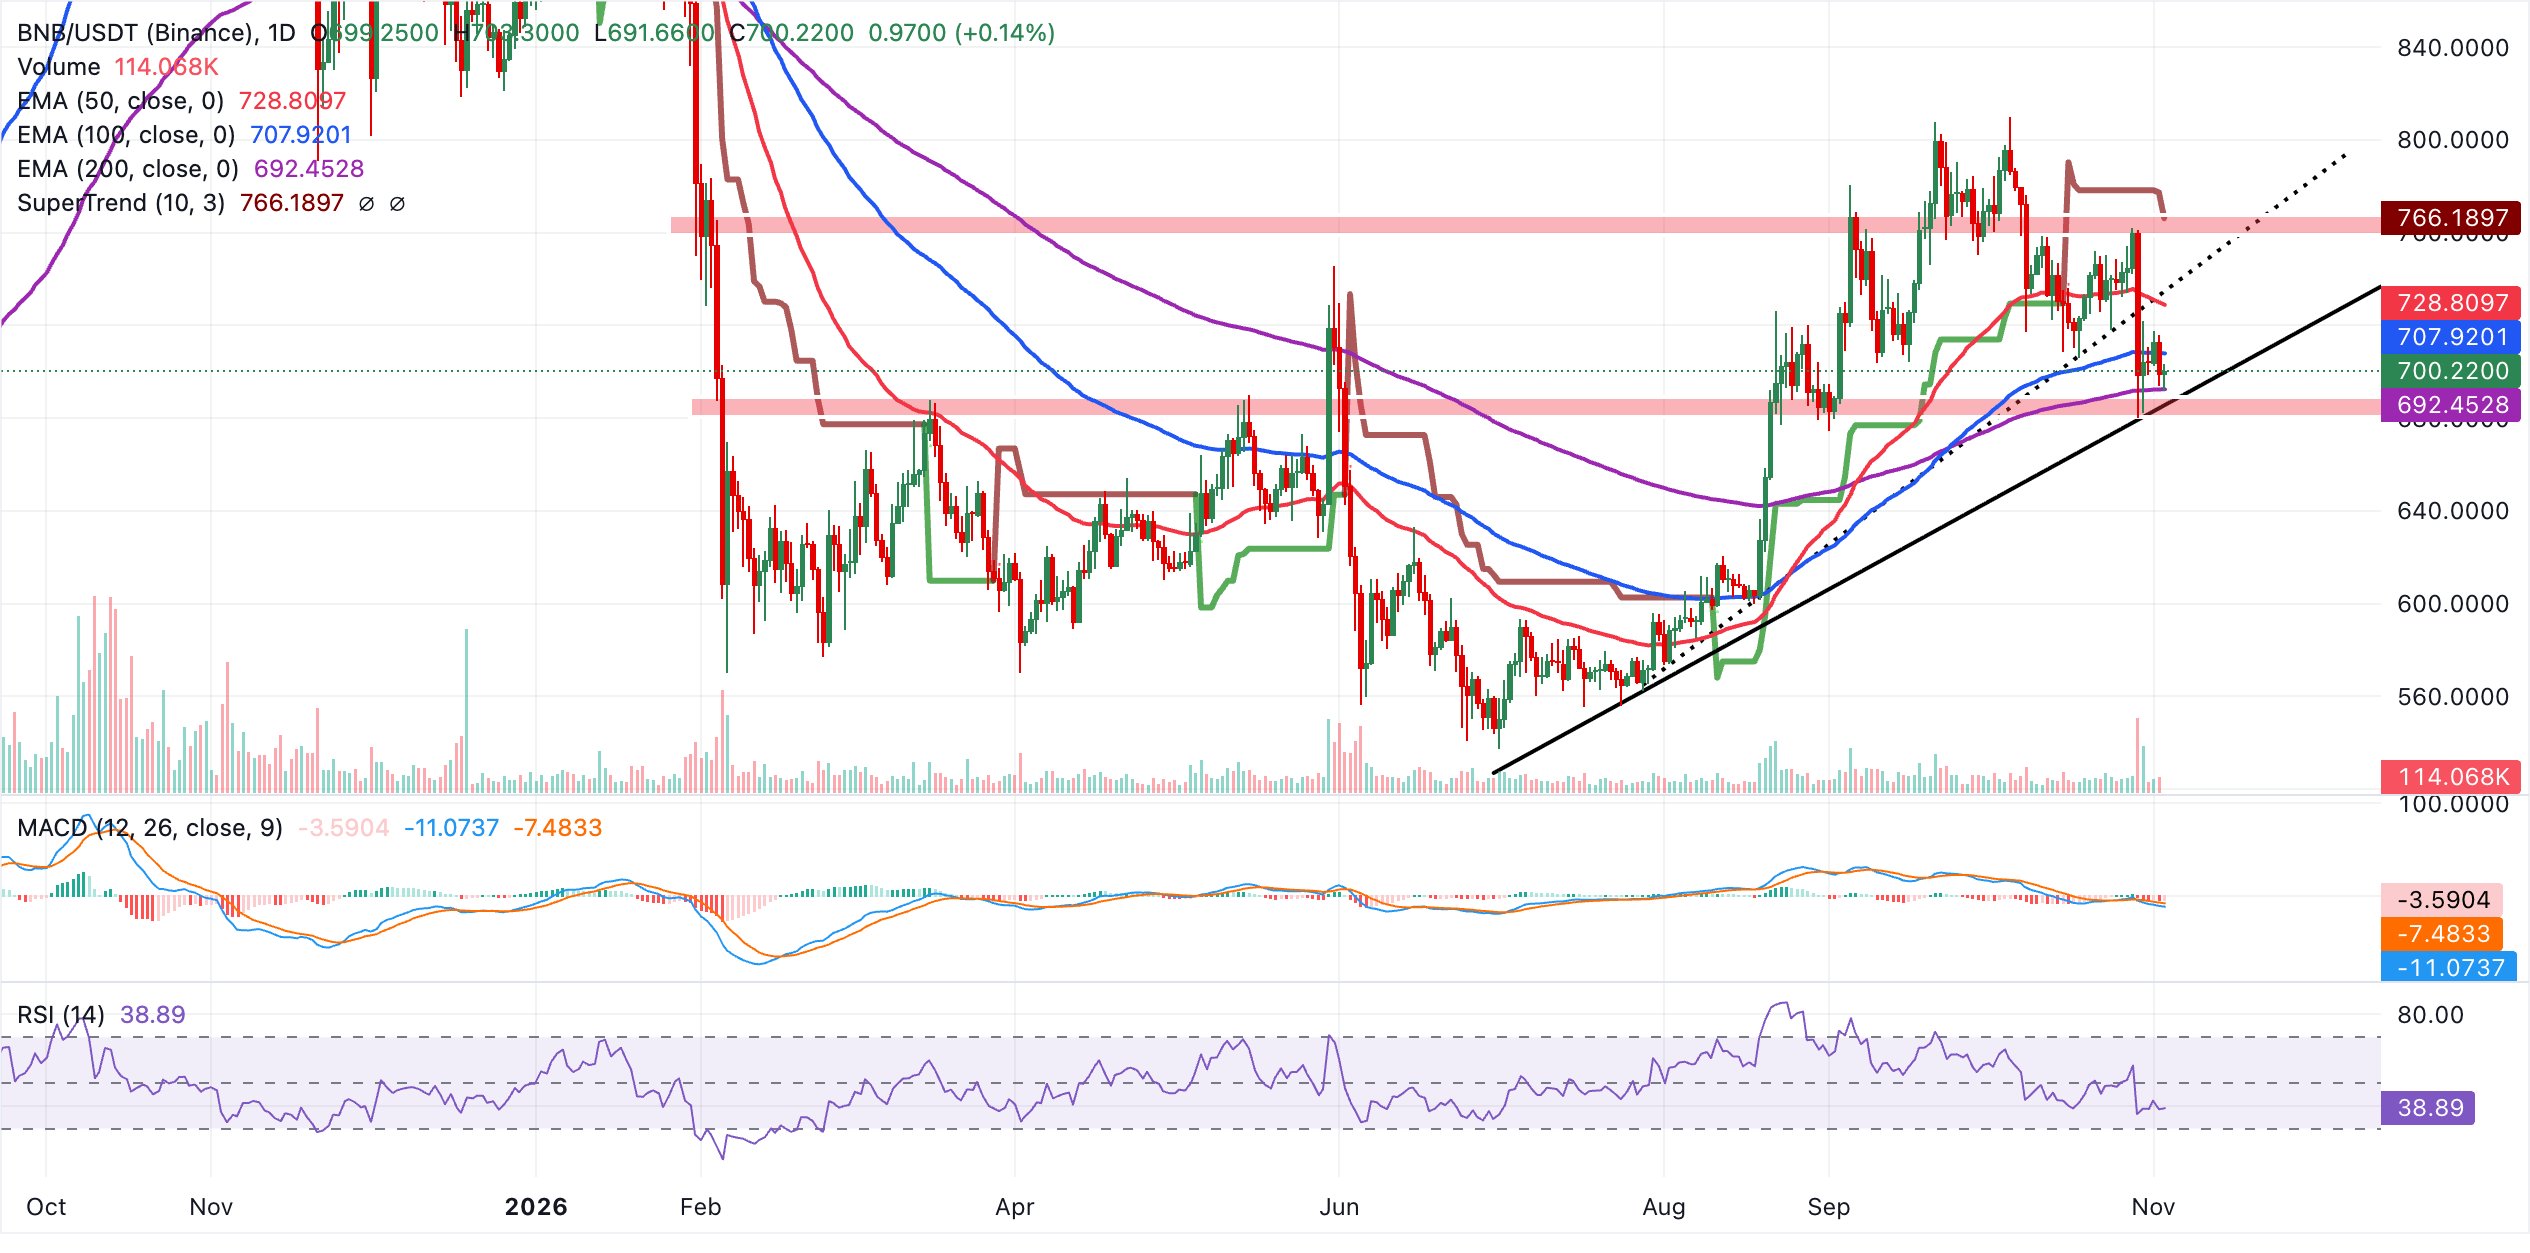
The first upside hurdle is the 100-day EMA around $708, ahead of the 50-day EMA near $729. Beyond those levels, the broken rising trendline at $736 presents a more substantial obstacle, with the SuperTrend zone around $766 then limiting further gains. Near-term support comes from the reclaimed 200-day EMA near $692, while the previous trendline-break area around $686 provides a lower line of defence. A failure to hold that area would likely leave scope for a deeper retreat within the broader upward channel.
(The technical analysis of this story was written with the help of an AI tool. Know more.)
An increase in Open Interest is linked to greater liquidity and fresh capital entering the market. It is viewed as an improvement in market efficiency, with the prevailing trend continuing. By contrast, falling Open Interest is regarded as evidence of liquidation: investors are exiting the market and aggregate demand for the asset is declining, encouraging bearish sentiment.
By increasing the liquidation risks traders face, funding fees narrow the gap between an asset’s spot price and its futures contract prices. When funding rates remain high and positive, they suggest bullish sentiment among market participants and expectations of a price rise. Persistently negative funding rates, by comparison, point to bearish sentiment: traders anticipate a decline in the cryptocurrency’s price, and a reversal into a bearish trend is likely.







Phone: +61 2 8036 8388
Fax: +61 2 8036 8388
Email: support@tmgm.com



The information provided on this website is of a general nature only and does not constitute personal financial advice. Before acting on any information on this website, you should consider the suitability of the information in relation to your objectives, financial situation and needs. Investing in CFDs and FX Margin Contracts carries significant risks and is not suitable for all investors. You may lose more than your initial deposit. You do not own, or have, any interest in the underlying asset. We recommend that you seek independent advice and ensure you fully understand the risks involved before trading. It is important that you read and consider the disclosure document before you acquire any product listed on the website. The information and advertisements offered on this website are not intended for use by any person in any country or jurisdiction where such use would be contrary to local laws and regulations. The Products and Services offered on this website are not intended for residents of the United States, Malaysia and Thailand.
TMGM is authorized and regulated in various jurisdictions.
Trademax Australia Limited, trading as TMGM, is regulated by the Australian Securities and Investments Commission (ASIC), AFSL no. 436416 and is located at Level 28, One International Tower, 100 Barangaroo Avenue, 2000 Sydney, NSW Australia.
Email: support@tmgm.com.au
Trademax Global Limited, trading as TMGM, is authorized and regulated by the Vanuatu Financial Services Commission (VFSC), registration number 40356 and registered at 1276, Kumul Highway, Port Vila, Vanuatu, Republic of Vanuatu.
Email: support@tmgm.com
Trademax Global Markets (SE) Limited, trading as TMGM, is authorized and regulated by the Financial Services Authority (FSA) of Seychelles, with license number SD224. The company is registered at Office No 13, Providence Estate ABIS Centre, Mahe, Seychelles.
Email: support@tmgm.com
Trademax Global Markets (International) Pty Ltd, trading as TMGM, is authorized and regulated by the Financial Services Commission, Mauritius (FSC) with license no. GB22201012, and registered at 33, Edith Cavell Street C/o IQ EQ Fund Services (Mauritius) Ltd Port Louis, 11324 Mauritius.
Email: support@tmgm.com
Copyright © TMGM. All rights reserved

