
News & AnalysisCareer

Wednesday’s decision by the US Federal Reserve (Fed) to hold the federal funds rate at 3.75%-4.00% has been followed by a broader cryptocurrency market retreat. Against this backdrop, Cardano (ADA) is under heavy selling pressure, losing over 4% so far on Thursday and falling below $0.2000. Sellers also dominate derivatives trading, with bullish positions being wiped out and the funding rate turning negative. A deeper decline threatens Cardano if sellers drive it beneath support at $0.1894, established by the 30 August low.

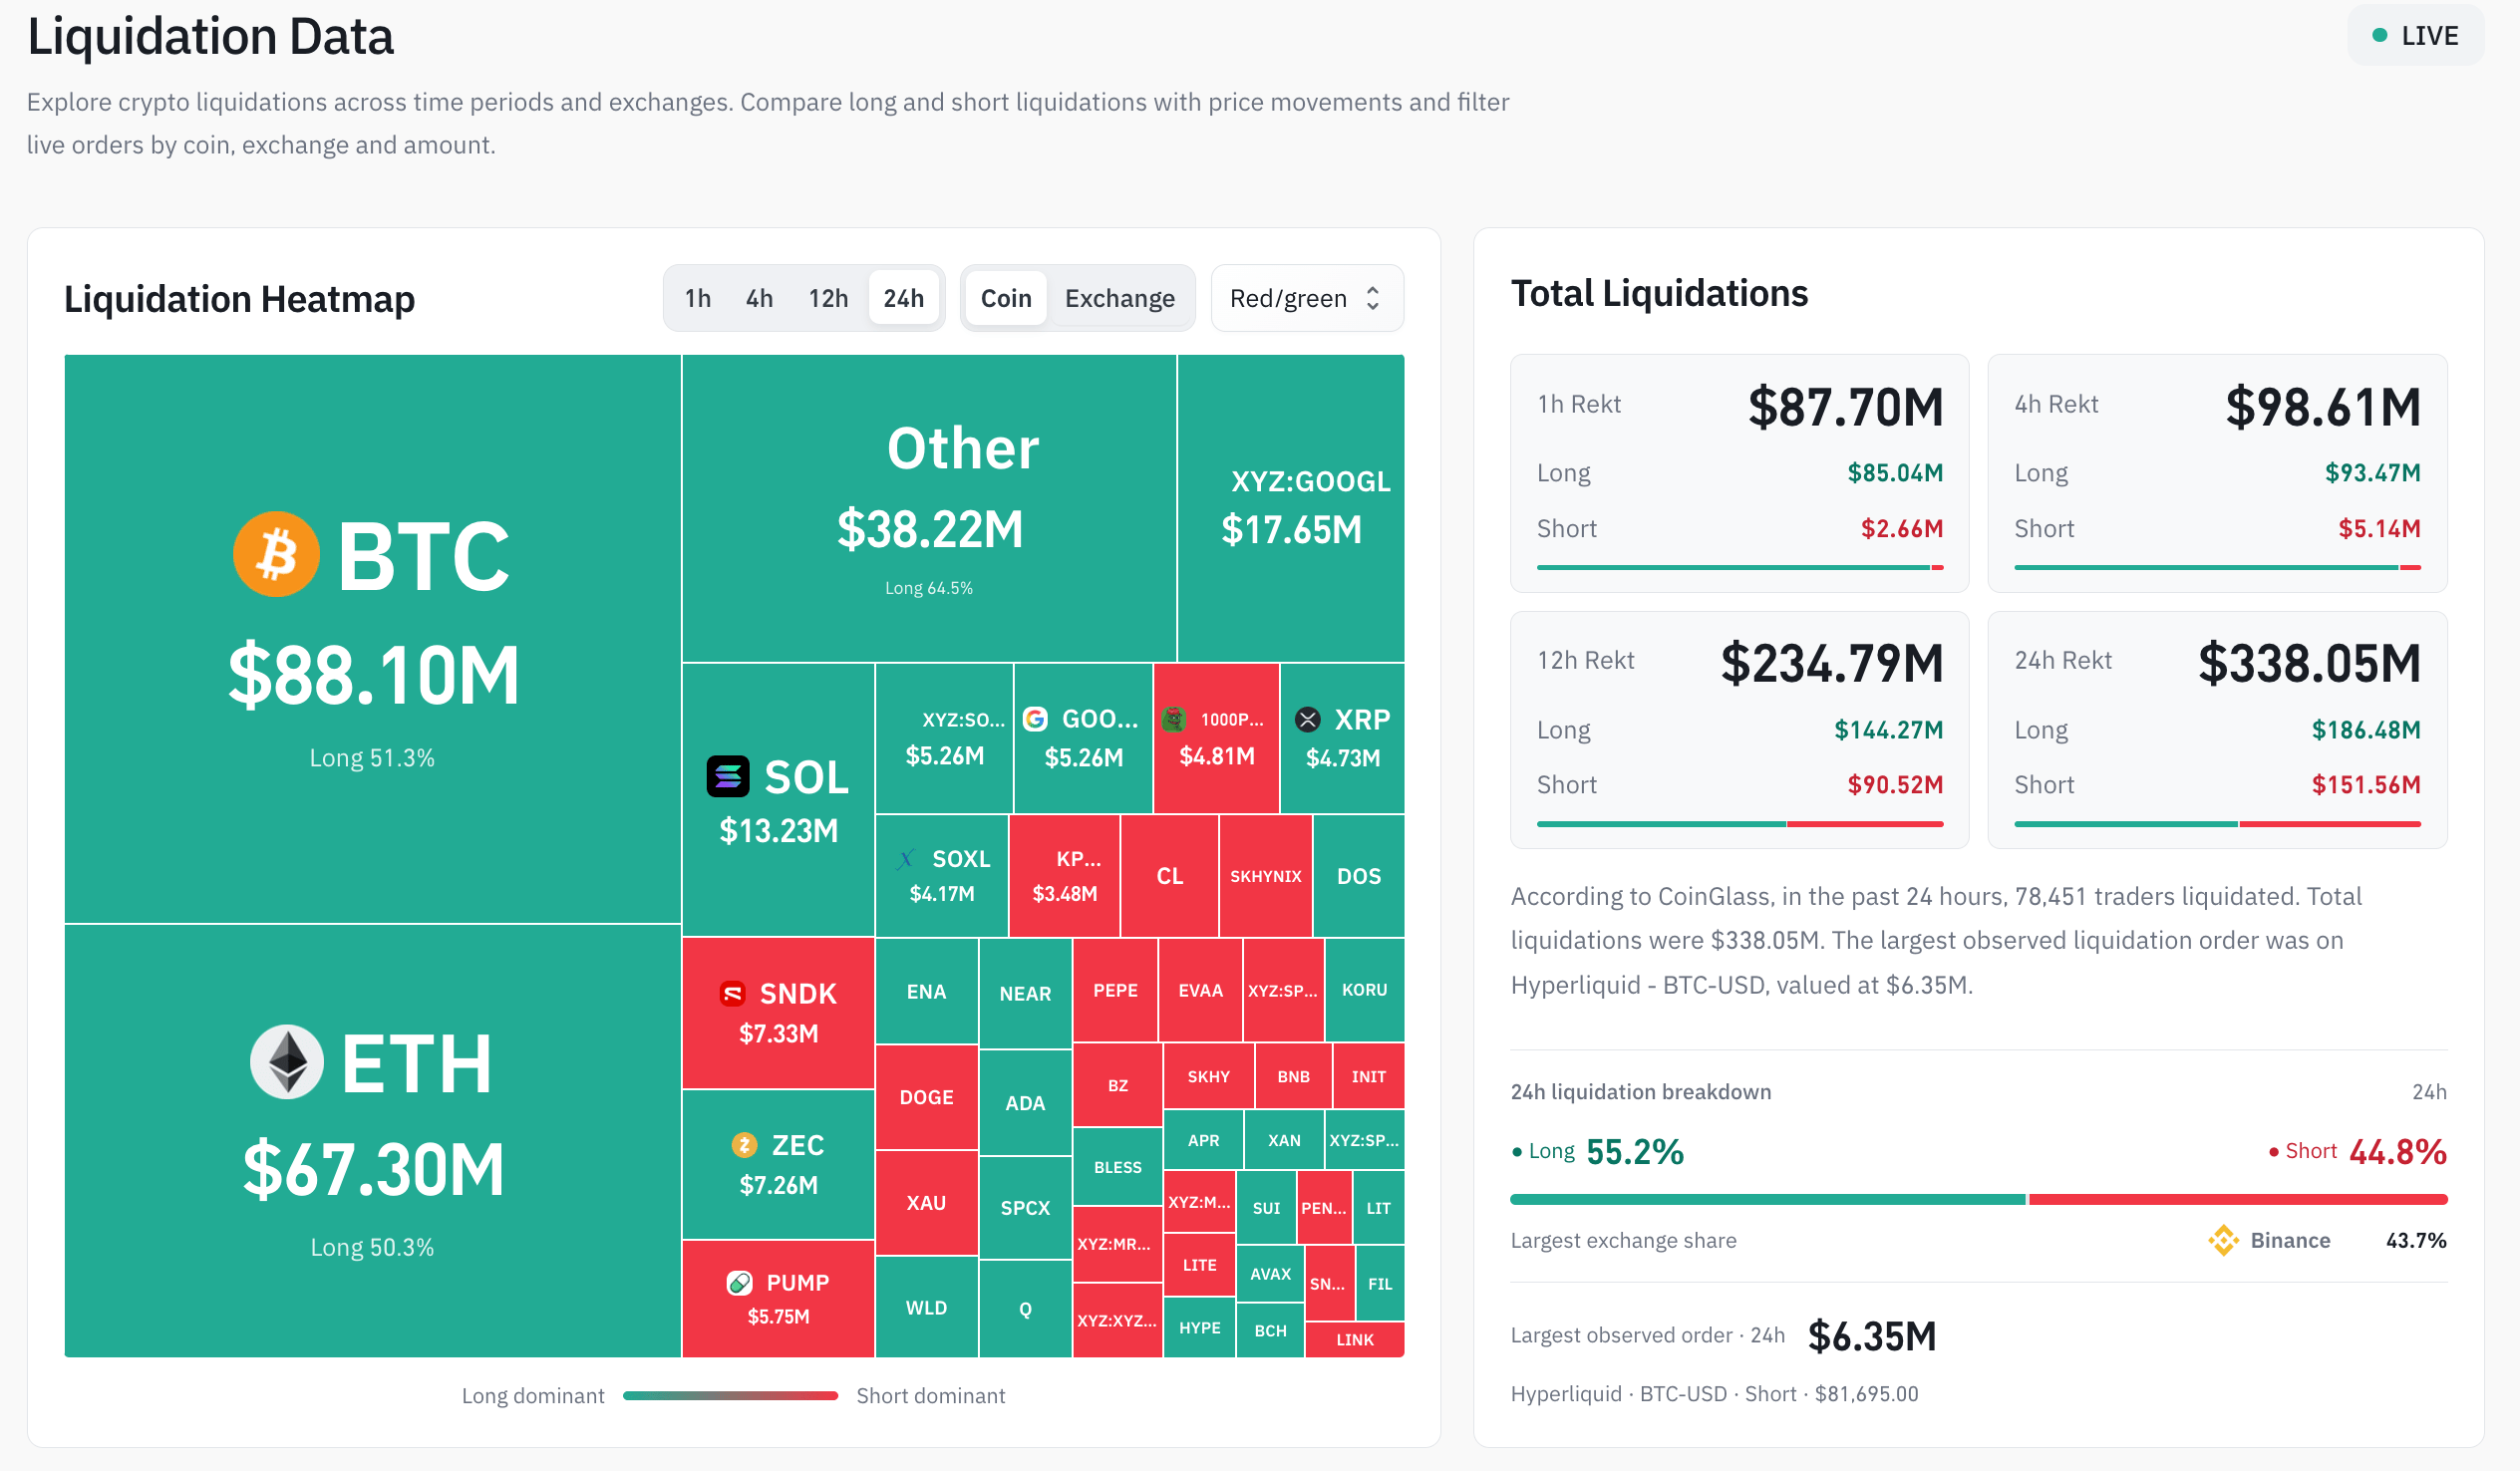
Retail support for Cardano is weakening alongside the wider cryptocurrency market. Total liquidations reached $338 million over the last 24 hours, according to CoinGlass, with long liquidations accounting for $186 million. This indicates that long positions are being forcibly closed. The selling pressure is consistent with moves in the leading cryptocurrencies: Bitcoin (BTC) has slipped below $80,000, while Ethereum (ETH) has fallen below $2,300.
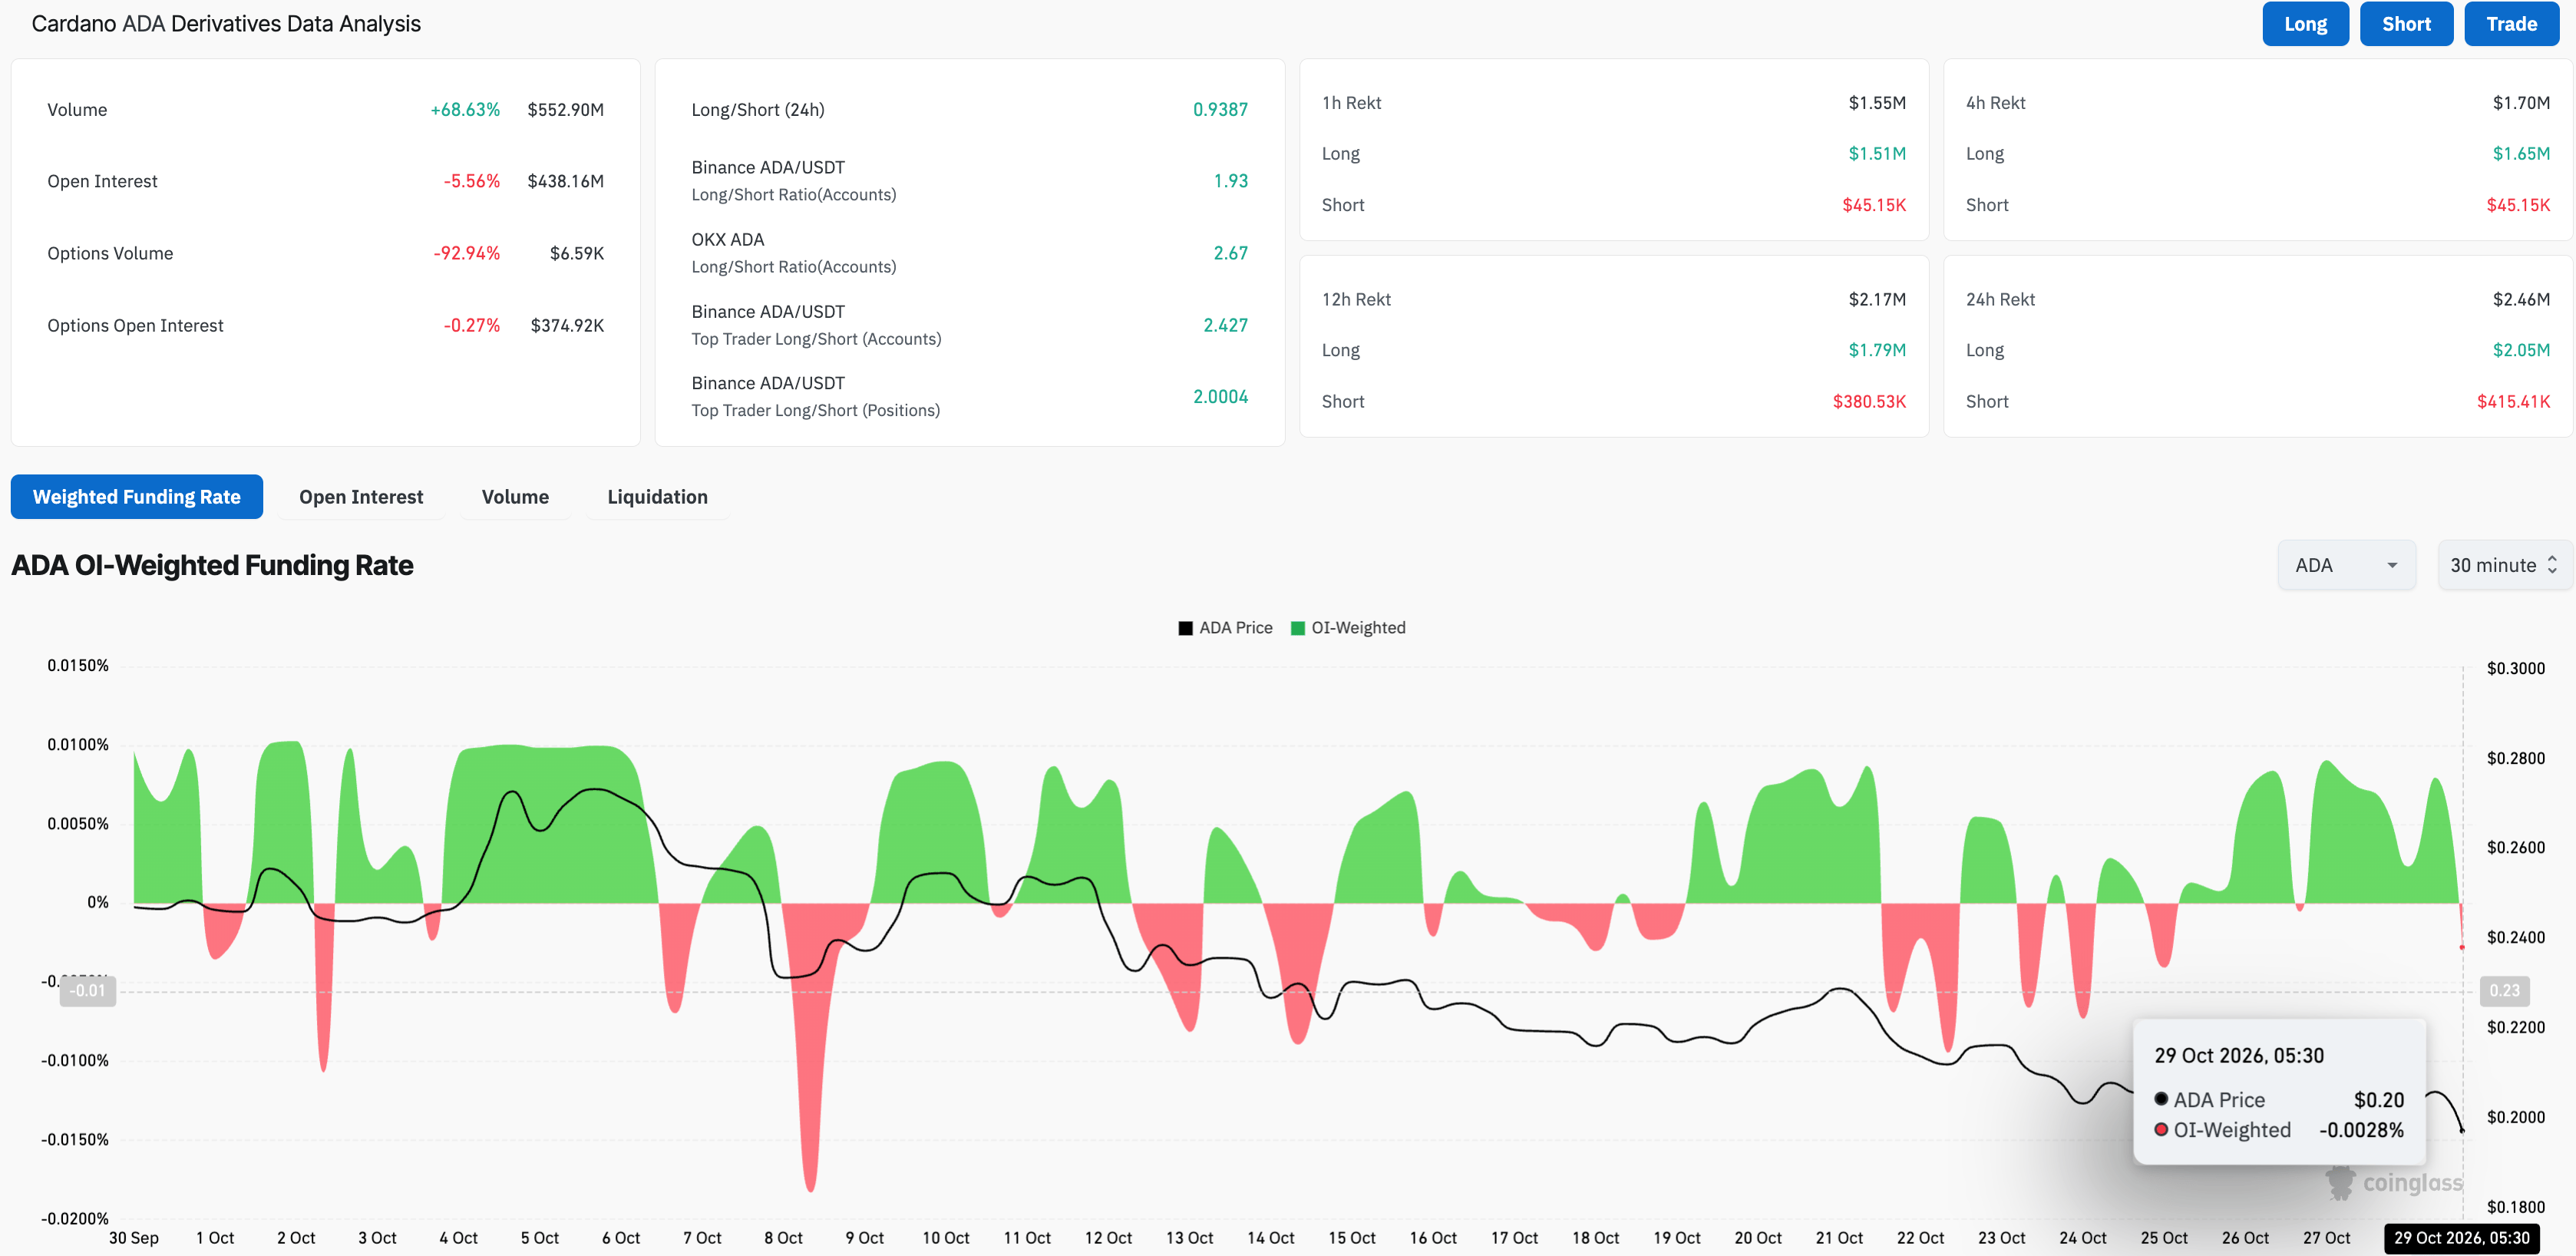
For ADA futures, Open Interest (OI) has fallen over 5% over the last 24 hours to $438.16 million, signalling a reduction in the notional value of all outstanding positions. Liquidations during the same period totalled $2.46 million, including $2.05 million in long positions. These figures suggest sellers have the upper hand as bullish positions are wiped out.
Meanwhile, a decline in the funding rate to -0.0028% signals traders’ willingness to take short positions in anticipation of further losses.
October’s decline in Cardano has reached roughly 25%, with the token trading at $0.1970 at the time of writing on Thursday. Trading well below both the 50-day Exponential Moving Average (EMA) of $0.2223 and the 200-day EMA of $0.2407, ADA remains constrained within its broader trend.
A fall of roughly 6% on 22 October confirmed ADA’s bearish reversal, as the price broke beneath the rising support trendline near $0.2223 linking the lows of 25 June and 18 August. The horizontal level of $0.1894, established by the 30 August low, now provides immediate support. If a break below this area is confirmed, the lows of 18 August and 28 July, near $0.1712 and $0.1537 respectively, could come under threat.
The momentum indicators also support a bearish reading. At 32, the Relative Strength Index (RSI) is hovering close to oversold territory. Meanwhile, the Moving Average Convergence Divergence (MACD) line sits beneath its signal line and the histogram remains negative, suggesting continued downward pressure.
Any advance would first encounter resistance at $0.2223, where the former trendline-break level coincides with the 50-day EMA. Only a sustained recovery above these levels would ease bearish pressure, bringing the more significant 200-day EMA at $0.2408 into focus as the next higher obstacle.
(The technical analysis of this story was written with the help of an AI tool. Know more.)







Phone: +61 2 8036 8388
Fax: +61 2 8036 8388
Email: support@tmgm.com



The information provided on this website is of a general nature only and does not constitute personal financial advice. Before acting on any information on this website, you should consider the suitability of the information in relation to your objectives, financial situation and needs. Investing in CFDs and FX Margin Contracts carries significant risks and is not suitable for all investors. You may lose more than your initial deposit. You do not own, or have, any interest in the underlying asset. We recommend that you seek independent advice and ensure you fully understand the risks involved before trading. It is important that you read and consider the disclosure document before you acquire any product listed on the website. The information and advertisements offered on this website are not intended for use by any person in any country or jurisdiction where such use would be contrary to local laws and regulations. The Products and Services offered on this website are not intended for residents of the United States, Malaysia and Thailand.
TMGM is authorized and regulated in various jurisdictions.
Trademax Australia Limited, trading as TMGM, is regulated by the Australian Securities and Investments Commission (ASIC), AFSL no. 436416 and is located at Level 28, One International Tower, 100 Barangaroo Avenue, 2000 Sydney, NSW Australia.
Email: support@tmgm.com.au
Trademax Global Limited, trading as TMGM, is authorized and regulated by the Vanuatu Financial Services Commission (VFSC), registration number 40356 and registered at 1276, Kumul Highway, Port Vila, Vanuatu, Republic of Vanuatu.
Email: support@tmgm.com
Trademax Global Markets (SE) Limited, trading as TMGM, is authorized and regulated by the Financial Services Authority (FSA) of Seychelles, with license number SD224. The company is registered at Office No 13, Providence Estate ABIS Centre, Mahe, Seychelles.
Email: support@tmgm.com
Trademax Global Markets (International) Pty Ltd, trading as TMGM, is authorized and regulated by the Financial Services Commission, Mauritius (FSC) with license no. GB22201012, and registered at 33, Edith Cavell Street C/o IQ EQ Fund Services (Mauritius) Ltd Port Louis, 11324 Mauritius.
Email: support@tmgm.com
Copyright © TMGM. All rights reserved


