
News & AnalysisCareer

Following a test of support near $80,000, Bitcoin’s early-week recovery attempts stalled at the $84,000 barrier. With buyers losing momentum, Bitcoin (BTC) is trading around $82,000 on Thursday, heading a wider cryptocurrency market correction.

A retreat towards $2,400 leaves Ethereum (ETH) reflecting Bitcoin’s weaker outlook. Ripple’s (XRP) move down towards $1.30 also underlines the broadly fragile technical picture, increasing the likelihood that the sell-off will persist.
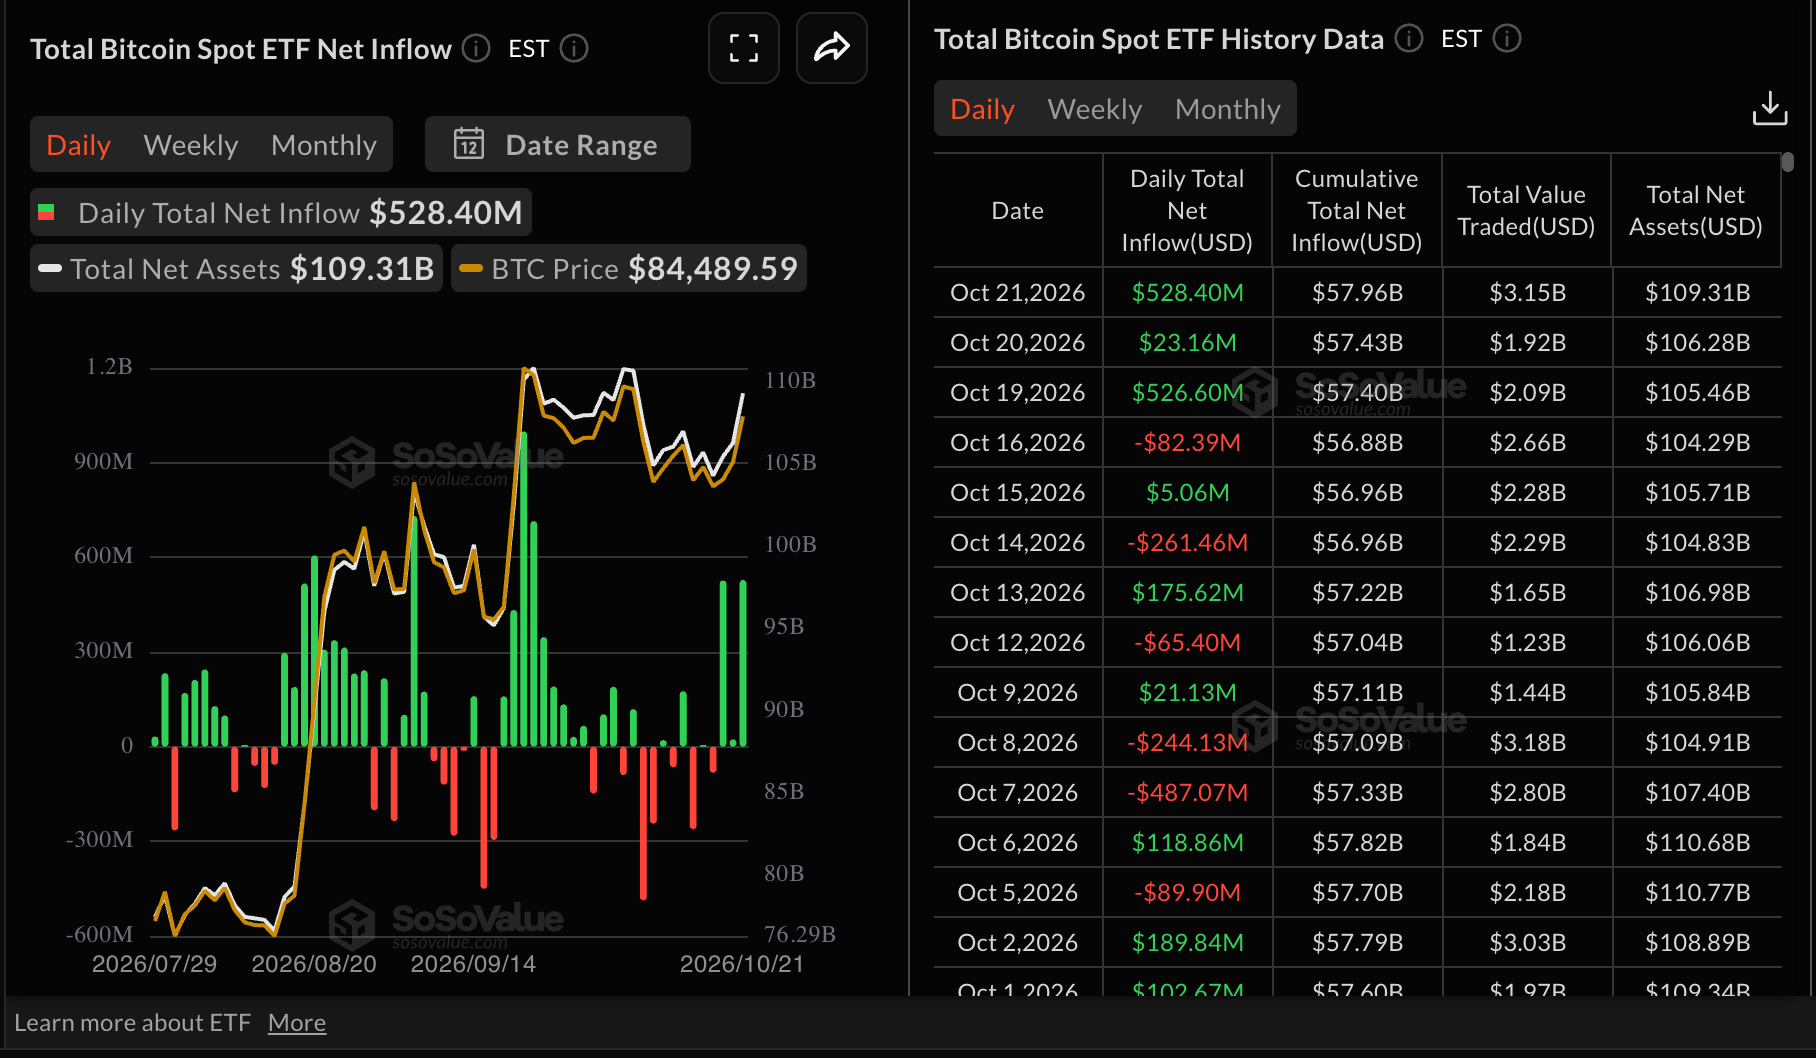
Wednesday brought approximately $528 million of inflows into Bitcoin spot Exchange-Traded Funds (ETFs), compared with $23 million on Tuesday. The uptake this week indicates that demand for digital asset investment products remains strong despite market volatility. Cumulative inflows reached $1 billion through Wednesday, providing some cushioning against selling pressure.
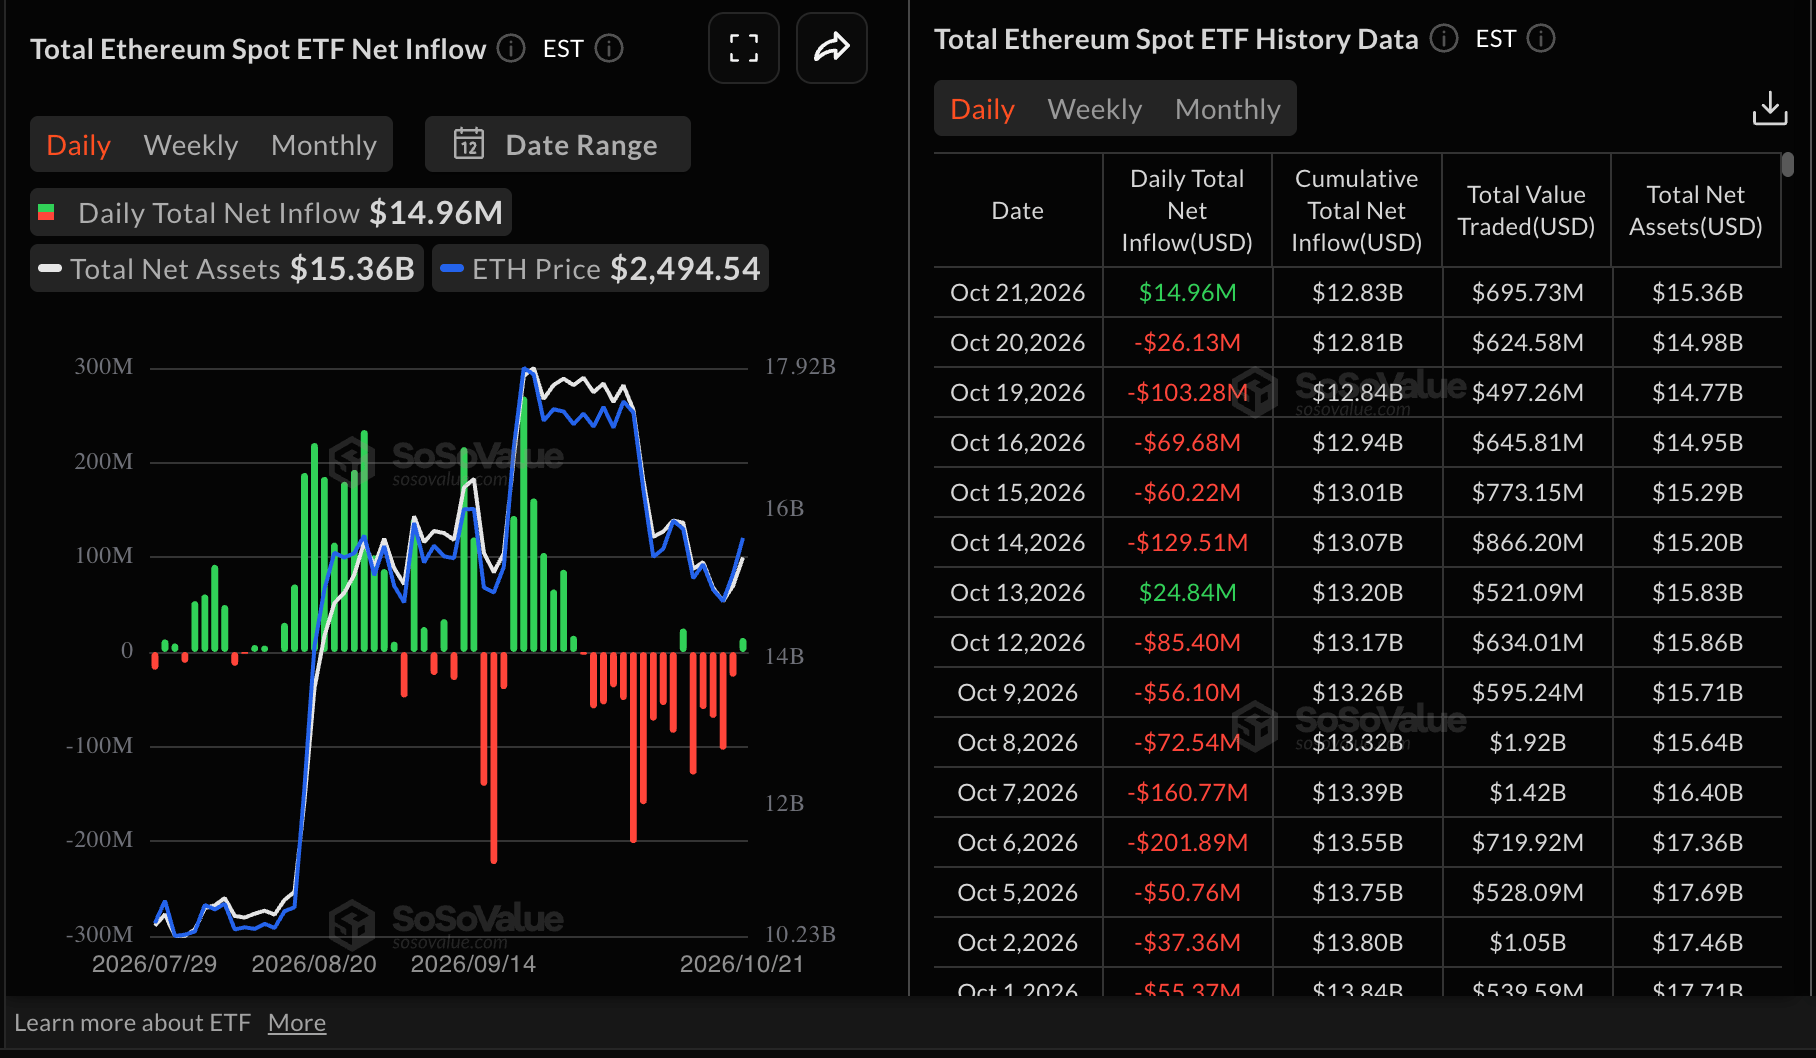
Inflows into Ethereum spot ETFs reached $15 million on Wednesday, marking a modest reversal after five consecutive days of outflows. Withdrawals had amounted to $26 million on the previous day and $105 million on Monday. SoSoValue puts outflows across October at approximately $1 billion.
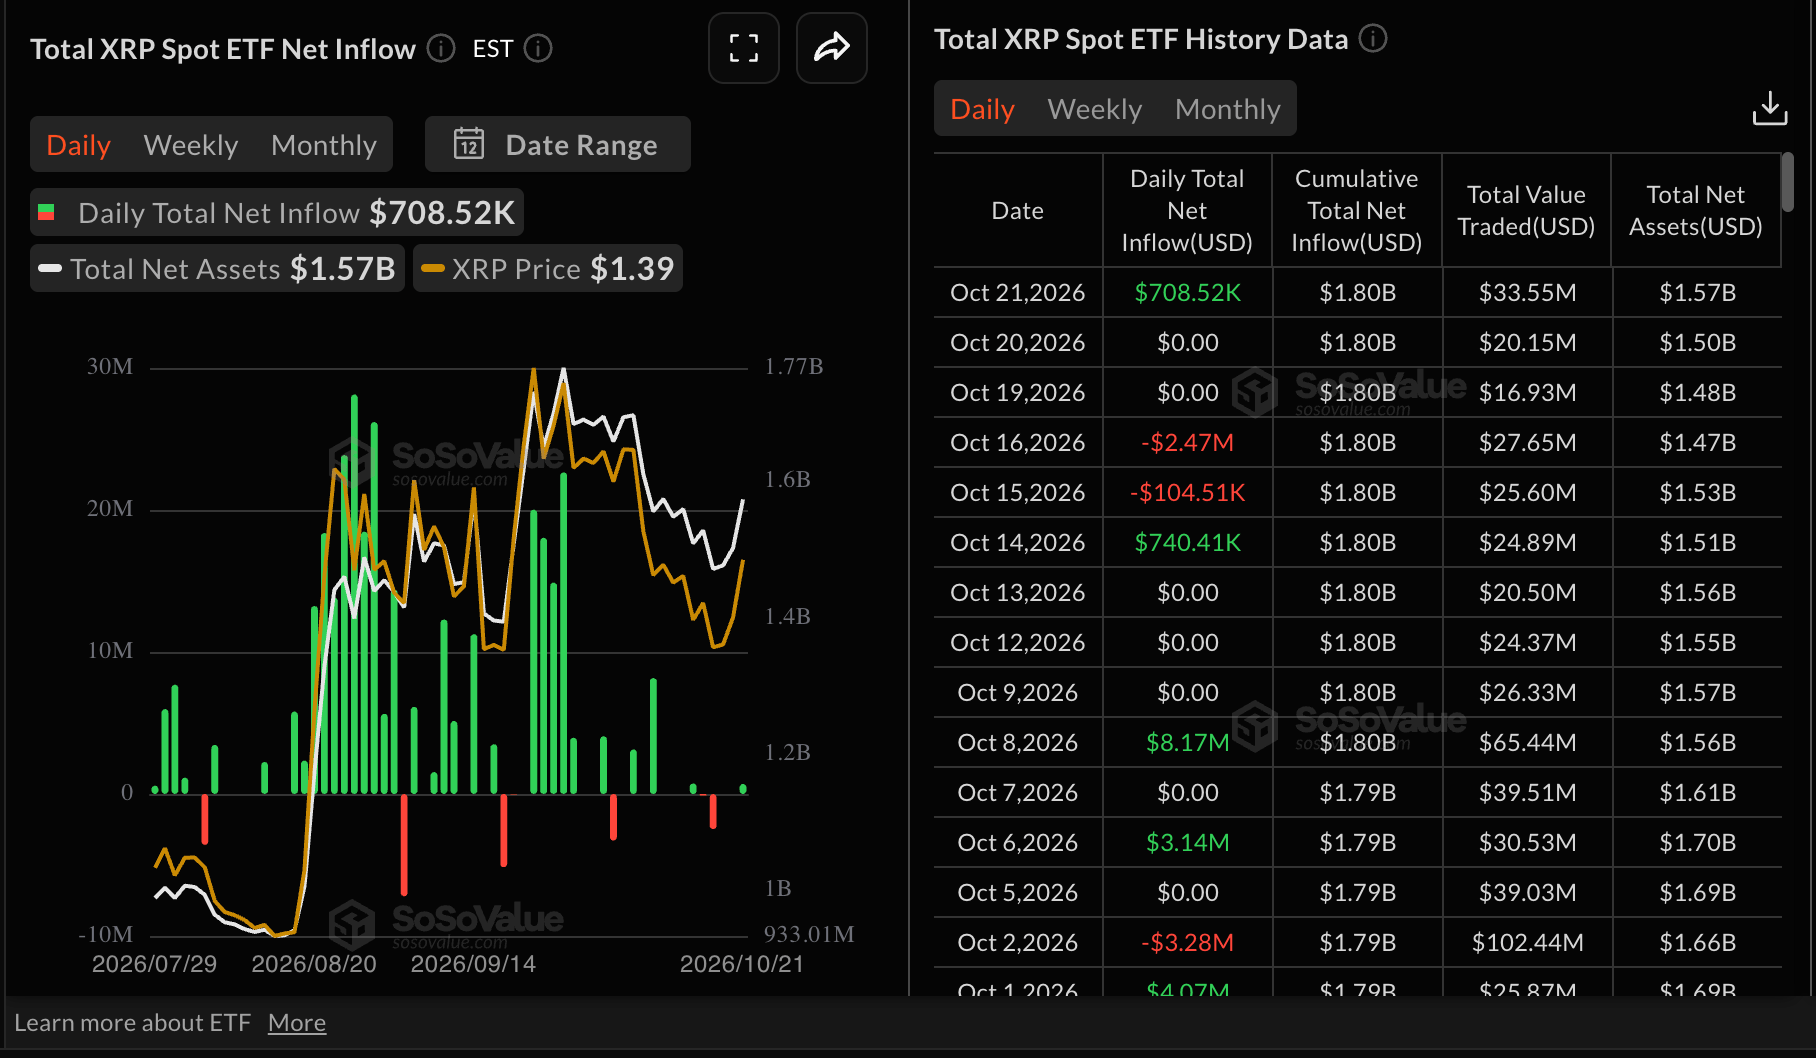
Muted trading, withdrawals and modest inflows continue to characterise a volatile market for XRP spot ETFs. After two consecutive days of subdued activity, Wednesday recorded inflows of approximately $709,000. Sustained inflows over the coming weeks could relieve wider selling pressure and give XRP room to consolidate before another attempt at recovery.
Increasing overhead pressure across the wider crypto market has pushed Bitcoin lower towards $82,000. Nevertheless, BTC retains a constructive bullish bias during the correction: it remains comfortably above its key Exponential Moving Averages, with further dynamic support provided by the SuperTrend line at about $79,664.
Momentum indicators present a more subdued picture. The Relative Strength Index (RSI) is close to 48, while the Moving Average Convergence Divergence (MACD) remains below zero. Together, they suggest that upward impulses are fading, although the broader structure continues to find support.
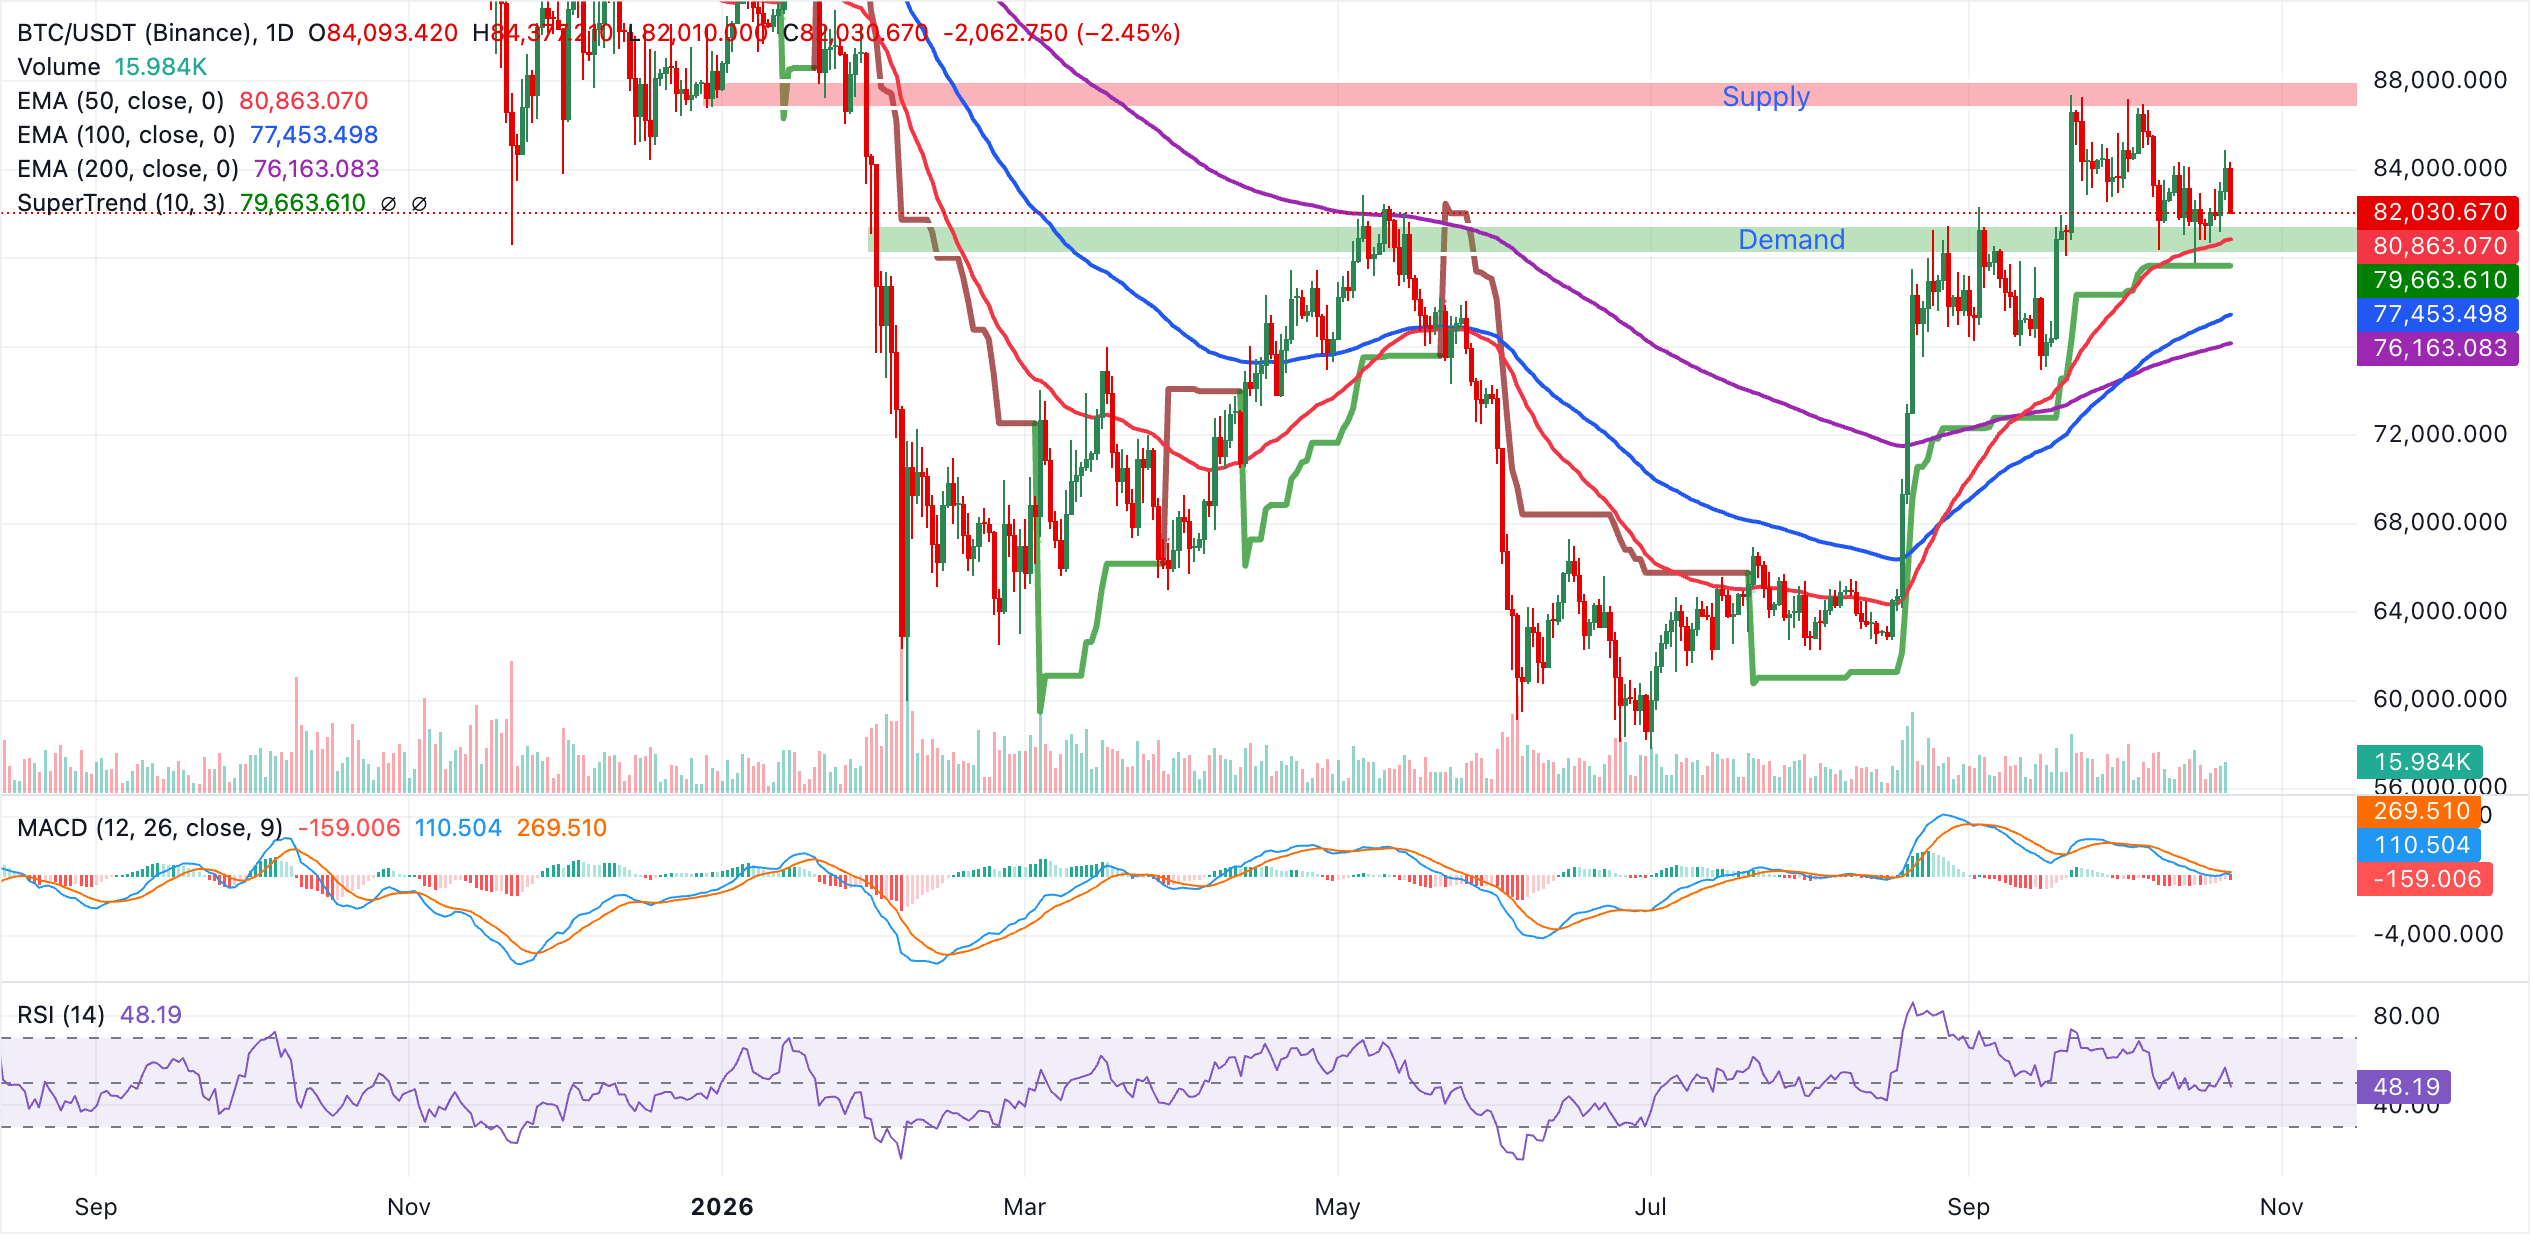
The first support level lies around $80,863 at the 50-day EMA. A daily close beneath it would bring the SuperTrend area near $79,664 into focus as the next demand zone. Further losses could put the 100-day EMA at roughly $77,453 in view, followed by the longer-term 200-day EMA near $76,163, where buyers would be expected to protect the broader bullish structure. While the price remains above this cluster of moving averages, declines are likely to be viewed as corrections within the established uptrend.
With Ethereum drifting towards $2,400 between its key moving averages, the short-term bias remains neutral to slightly bearish. Medium-term support is evident in its position above the 100-day and 200-day EMAs, at roughly $2,365 and $2,318 respectively. However, the 50-day EMA near $2,479 and the SuperTrend line around $2,676 continue to cap the price.
Buying pressure remains limited, as indicated by an RSI reading near 40. Meanwhile, the MACD is still negative but shows only a shallow bearish profile, suggesting that downward momentum is easing rather than signalling a decisive bullish reversal.
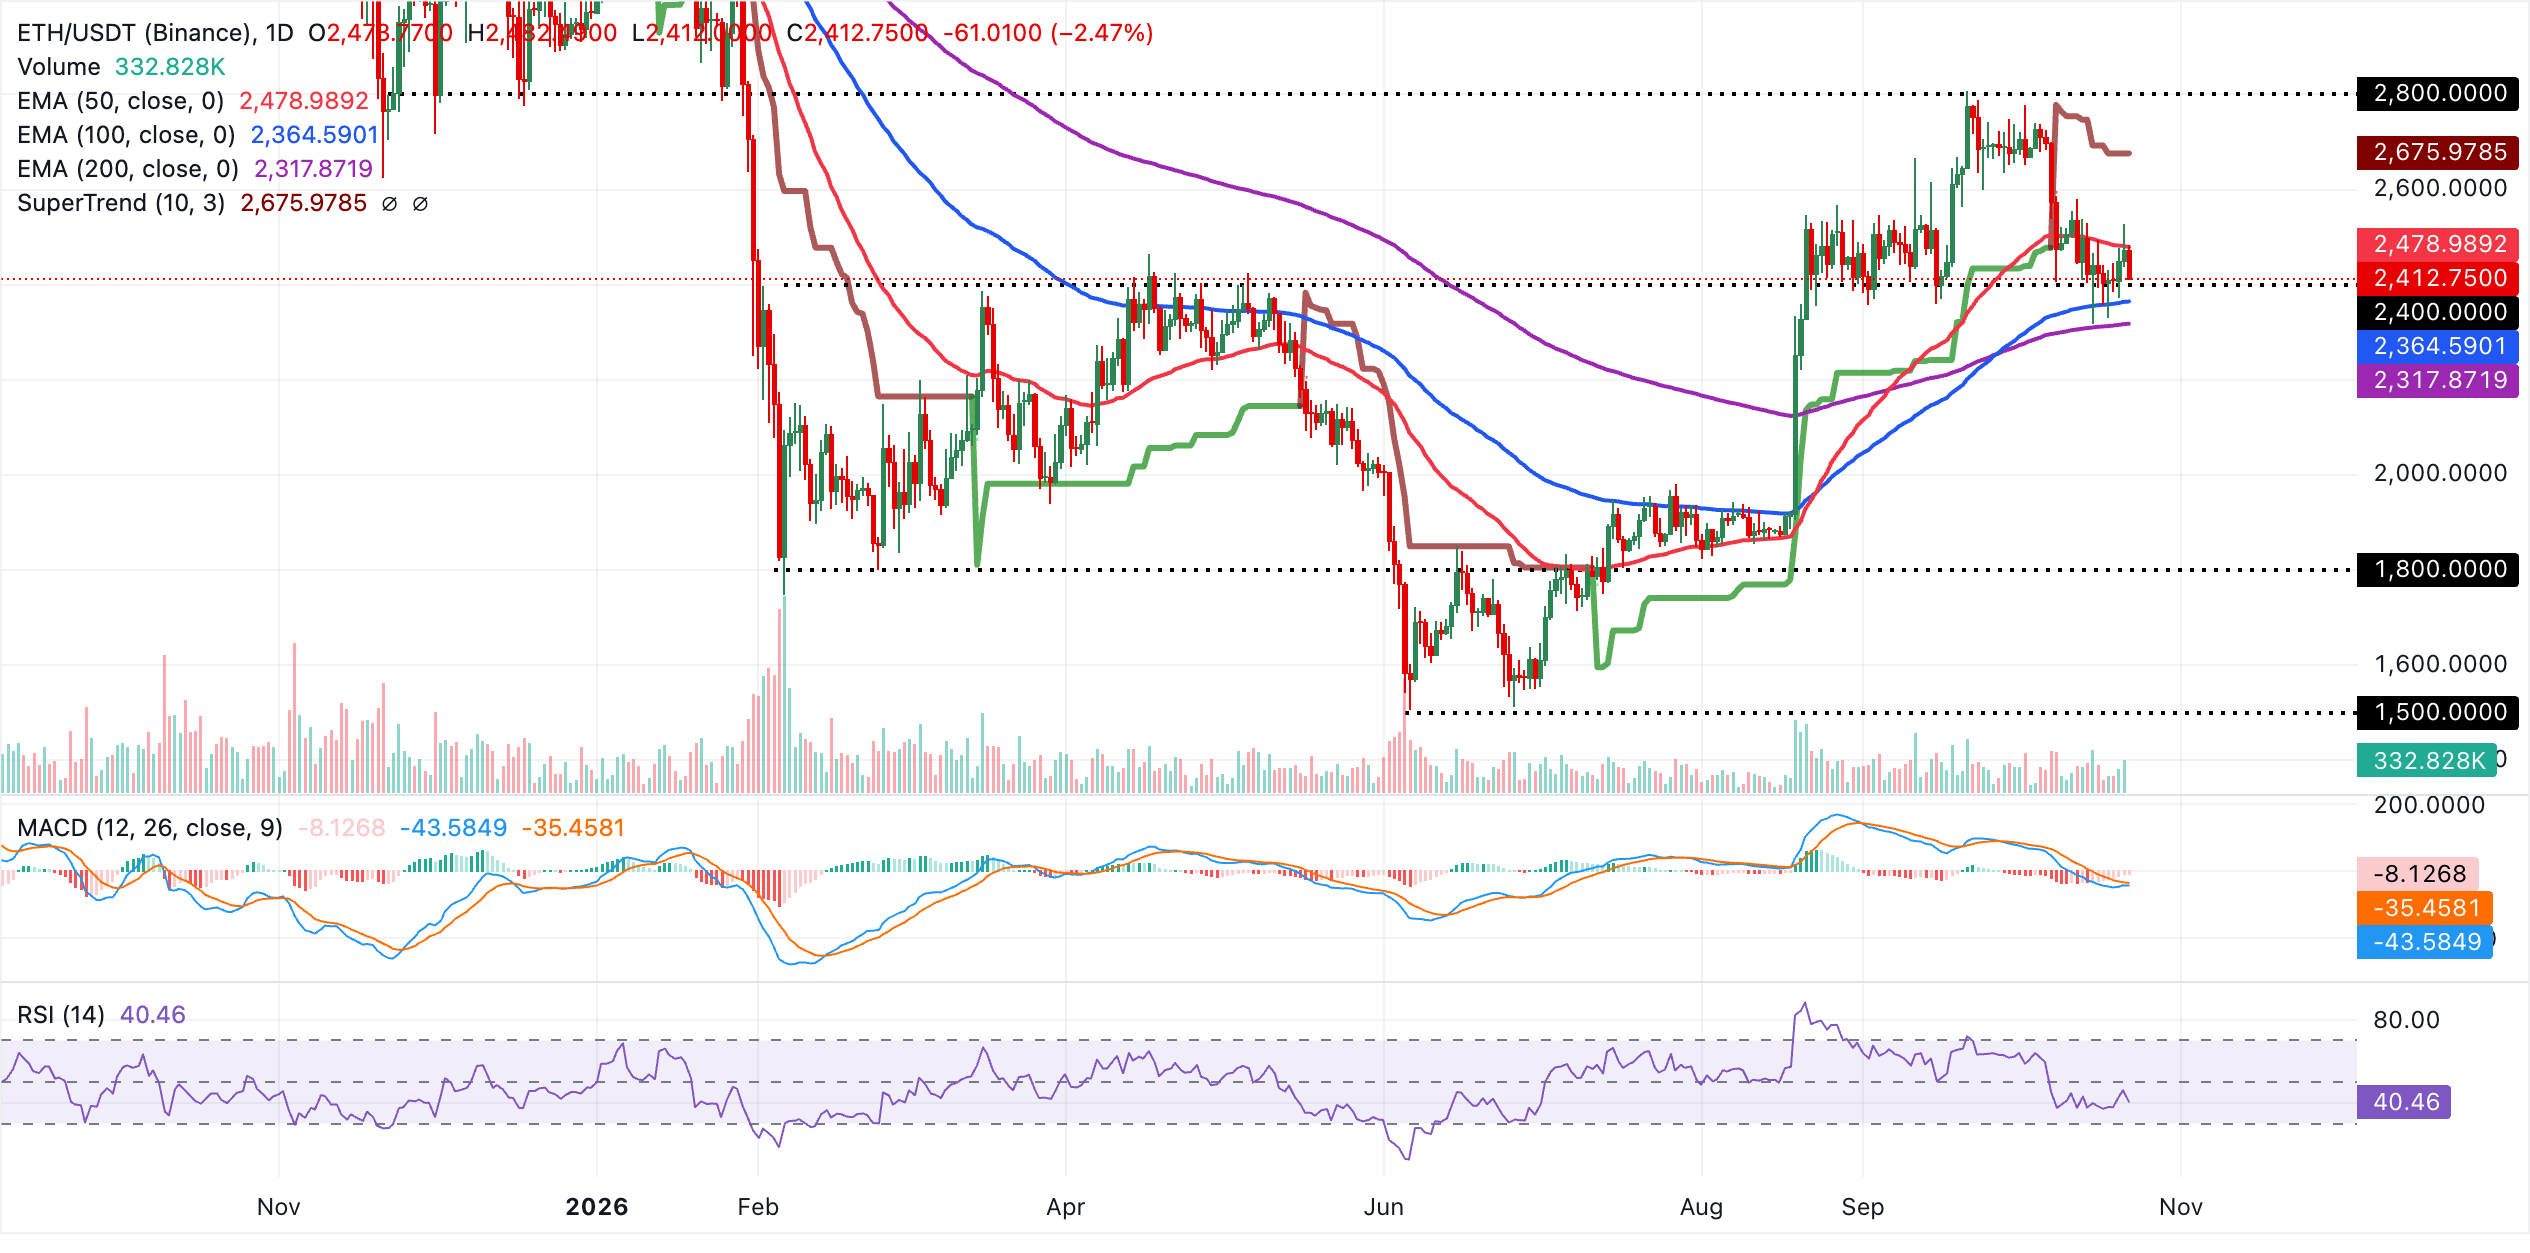
A rebound would first encounter resistance around $2,479 at the 50-day EMA. The SuperTrend line near $2,676 presents a firmer obstacle, where sellers are likely to return if the price attempts to recover. Immediate downside support lies at about $2,364 on the 100-day EMA, ahead of the 200-day EMA near $2,318. Closing below this area on a daily basis would strengthen the bearish picture and leave scope for a deeper correction. Holding above it, by contrast, would keep ETH consolidating within its broader uptrend.
Trading around $1.33, XRP remains beneath its major moving averages, leaving the near-term outlook bearish. The closest overhead barrier is the 100-day EMA at $1.34, followed by the 50-day EMA at $1.37 and the 200-day EMA at $1.38. Their alignment with the broader descending trendline structure suggests that rallies remain susceptible to renewed selling.
An RSI close to 43 and a marginally negative MACD point to muted momentum. Recovery attempts may therefore face difficulties for as long as the price stays below this group of averages.
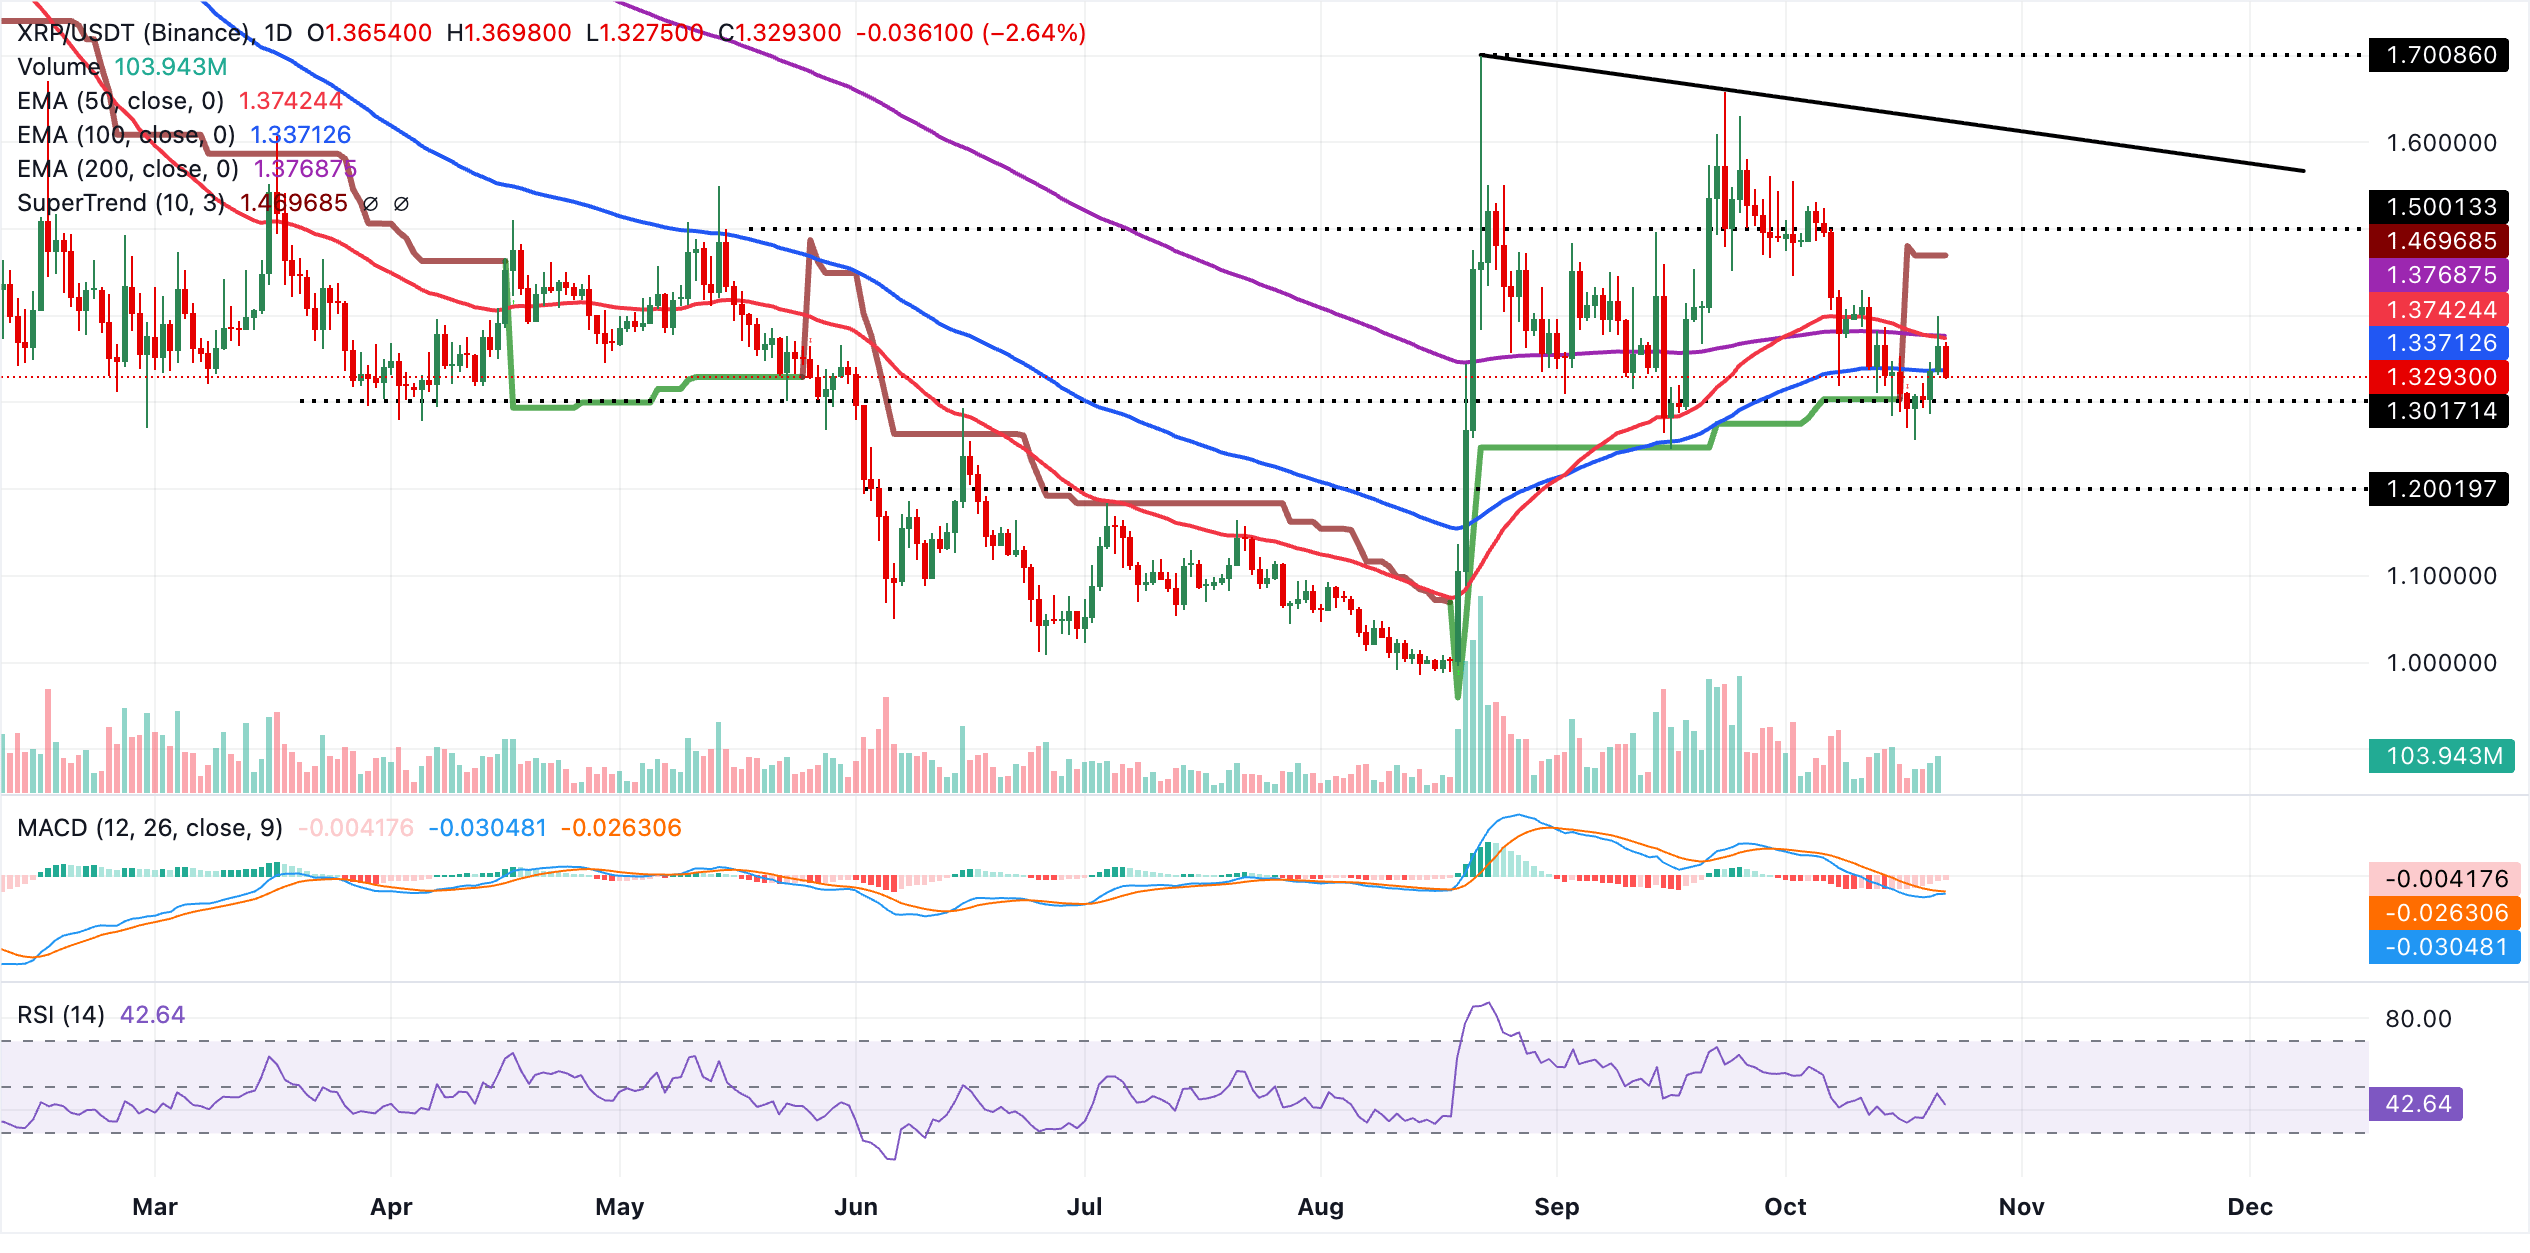
The first hurdle on the upside is around $1.34 at the 100-day EMA. Beyond it lies a denser supply zone, bounded by the 50-day EMA at roughly $1.37 and the 200-day EMA near $1.38, with the broader downtrend line likely to exert additional pressure. Further away, the SuperTrend indicator at $1.47 defines a bearish trigger zone. Reclaiming that level would be necessary to make the case for a lasting move away from the prevailing downward bias.
(The technical analysis of this story was written with the help of an AI tool. Know more.)
Investors use an Exchange-Traded Fund (ETF) to obtain exposure to a particular asset. This investment vehicle or index follows the price of an underlying asset, but its scope can also extend to groups of assets and sectors rather than a single holding. A Bitcoin ETF, for instance, follows the price of Bitcoin.
Yes. October 2021 saw the US Securities & Exchange Commission approve the first Bitcoin futures ETF in the US. Seven Bitcoin futures ETFs have received approval in total, while more than 20 are still awaiting the regulator’s consent. According to the SEC, the cryptocurrency industry is new and vulnerable to manipulation; this is its stated reason for delaying crypto-related futures ETFs over the last few years.
Yes. In January 2024, several Bitcoin spot Exchange-Traded Funds received SEC approval for listing and trading. The decision enabled institutional capital and mainstream investors to trade the leading cryptocurrency, and the industry welcomed it as a game changer.
Exposure to a cryptocurrency without owning it directly is the principal benefit of crypto ETFs, reducing the risks and costs involved in holding the asset. Investors also face a less demanding learning curve and benefit from greater security, as the ETF takes responsibility for safeguarding the underlying holdings. The chief drawback is the lack of direct ownership, captured by the crypto saying “not your keys, not your coins.” Fees for active management are another disadvantage, adding to the costs associated with holding crypto. Lastly, although ETFs reduce the risks of holding an asset, fluctuations in the underlying cryptocurrency’s price are still likely to feed through to the investment vehicle.







Phone: +61 2 8036 8388
Fax: +61 2 8036 8388
Email: support@tmgm.com



The information provided on this website is of a general nature only and does not constitute personal financial advice. Before acting on any information on this website, you should consider the suitability of the information in relation to your objectives, financial situation and needs. Investing in CFDs and FX Margin Contracts carries significant risks and is not suitable for all investors. You may lose more than your initial deposit. You do not own, or have, any interest in the underlying asset. We recommend that you seek independent advice and ensure you fully understand the risks involved before trading. It is important that you read and consider the disclosure document before you acquire any product listed on the website. The information and advertisements offered on this website are not intended for use by any person in any country or jurisdiction where such use would be contrary to local laws and regulations. The Products and Services offered on this website are not intended for residents of the United States, Malaysia and Thailand.
TMGM is authorized and regulated in various jurisdictions.
Trademax Australia Limited, trading as TMGM, is regulated by the Australian Securities and Investments Commission (ASIC), AFSL no. 436416 and is located at Level 28, One International Tower, 100 Barangaroo Avenue, 2000 Sydney, NSW Australia.
Email: support@tmgm.com.au
Trademax Global Limited, trading as TMGM, is authorized and regulated by the Vanuatu Financial Services Commission (VFSC), registration number 40356 and registered at 1276, Kumul Highway, Port Vila, Vanuatu, Republic of Vanuatu.
Email: support@tmgm.com
Trademax Global Markets (SE) Limited, trading as TMGM, is authorized and regulated by the Financial Services Authority (FSA) of Seychelles, with license number SD224. The company is registered at Office No 13, Providence Estate ABIS Centre, Mahe, Seychelles.
Email: support@tmgm.com
Trademax Global Markets (International) Pty Ltd, trading as TMGM, is authorized and regulated by the Financial Services Commission, Mauritius (FSC) with license no. GB22201012, and registered at 33, Edith Cavell Street C/o IQ EQ Fund Services (Mauritius) Ltd Port Louis, 11324 Mauritius.
Email: support@tmgm.com
Copyright © TMGM. All rights reserved


