
News & AnalysisCareer

At close to $1.20, Ripple (XRP) remains constrained by its technical structure after selling erased the early-week advance to $1.34 sparked by the United States (US) midterm elections. Ahead of the Democrats taking control of Congress in January, regulatory unease prompted many market participants to reposition and rebalance their portfolios.

Concerns over the direction of US crypto regulation once Democrats take control of the House and Senate in January are adding to the headwinds facing the wider cryptocurrency market.
Senator Elizabeth Warren is poised to chair the Senate Banking Committee, according to a Wall Street Journal report published on Thursday. Expectations are that Warren will push for tougher crypto regulation and consumer protections for crypto entities.
Investigations into alleged insider trading in prediction markets may also feature among Warren’s early priorities, the report notes, alongside an assessment of alleged conflicts of interest involving US President Donald Trump and his family. Her appointment as Senate Banking Committee Chair has not yet been confirmed, although observers consider the chances of an alternative candidate to be slim.
In an opinion piece published in Time on Thursday, Senator Warren wrote: “Democrats won this election by claiming we are on the side of working people, and working people are counting on us to deliver,”
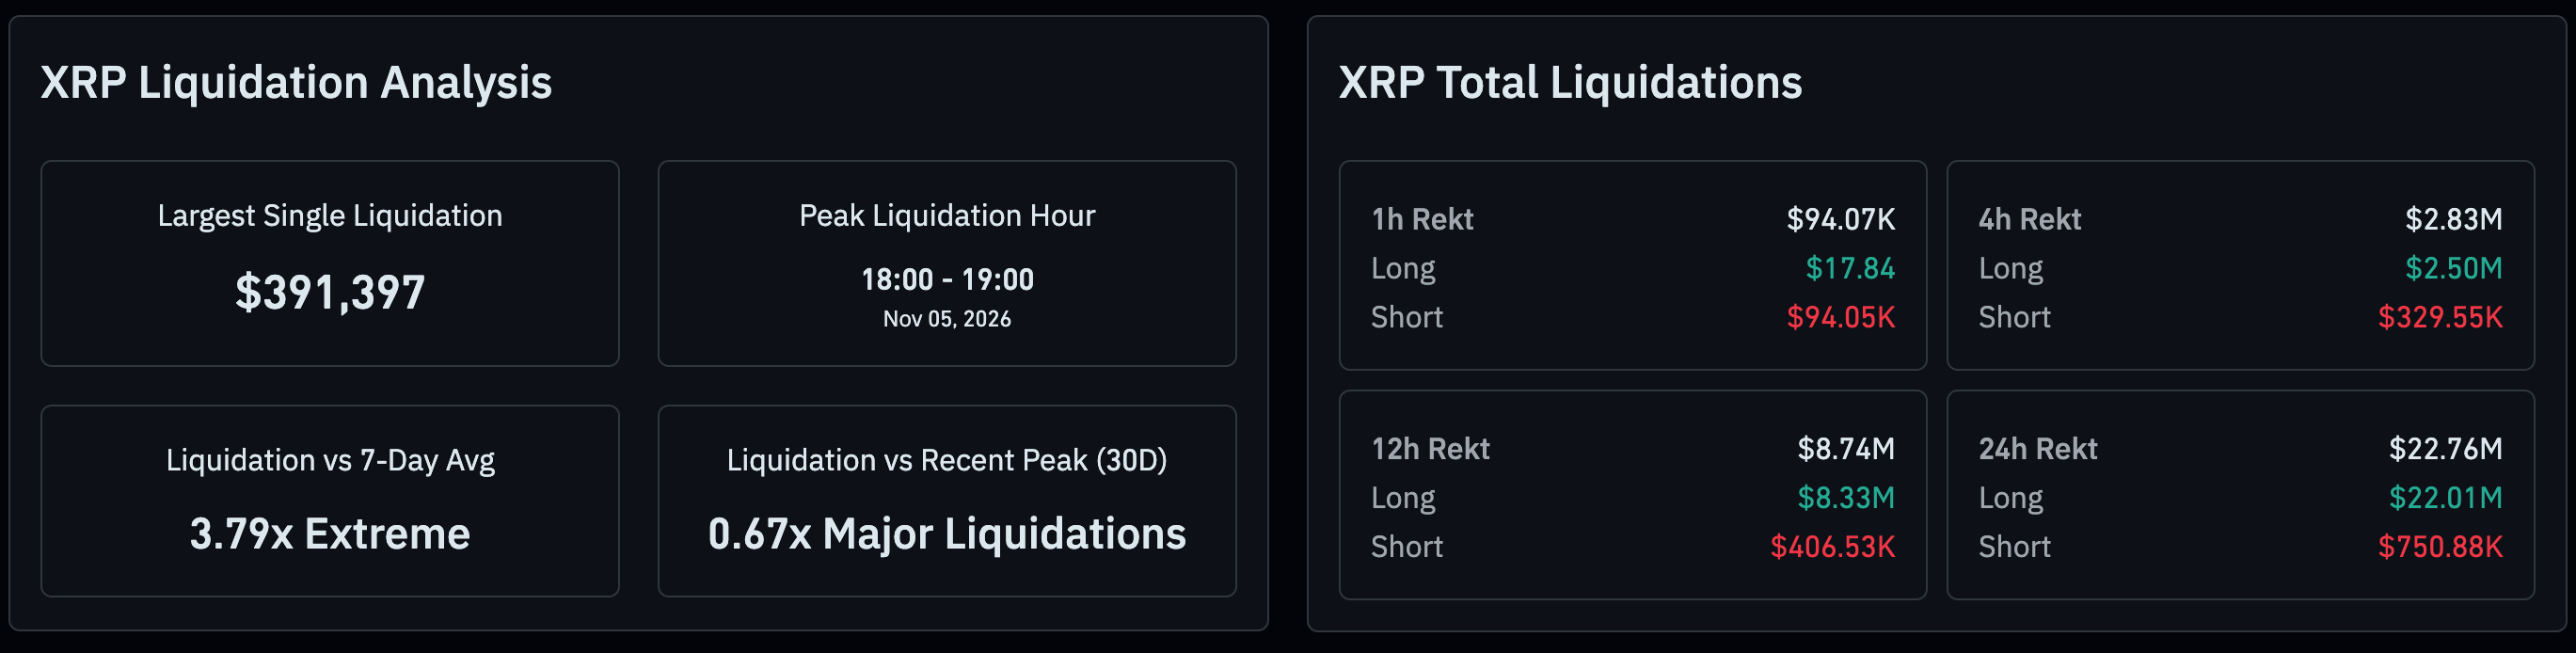
Traders have suffered losses across the cryptocurrency market during the wider sell-off, with derivatives traders particularly affected. As of Friday, XRP derivatives liquidations total $22 million over the past 24 hours. Long positions account for the bulk of the damage, with roughly $21 million liquidated, compared with nearly $1 million in short positions. Should long liquidations persist, forced selling and self-reinforcing price declines could deepen the correction.
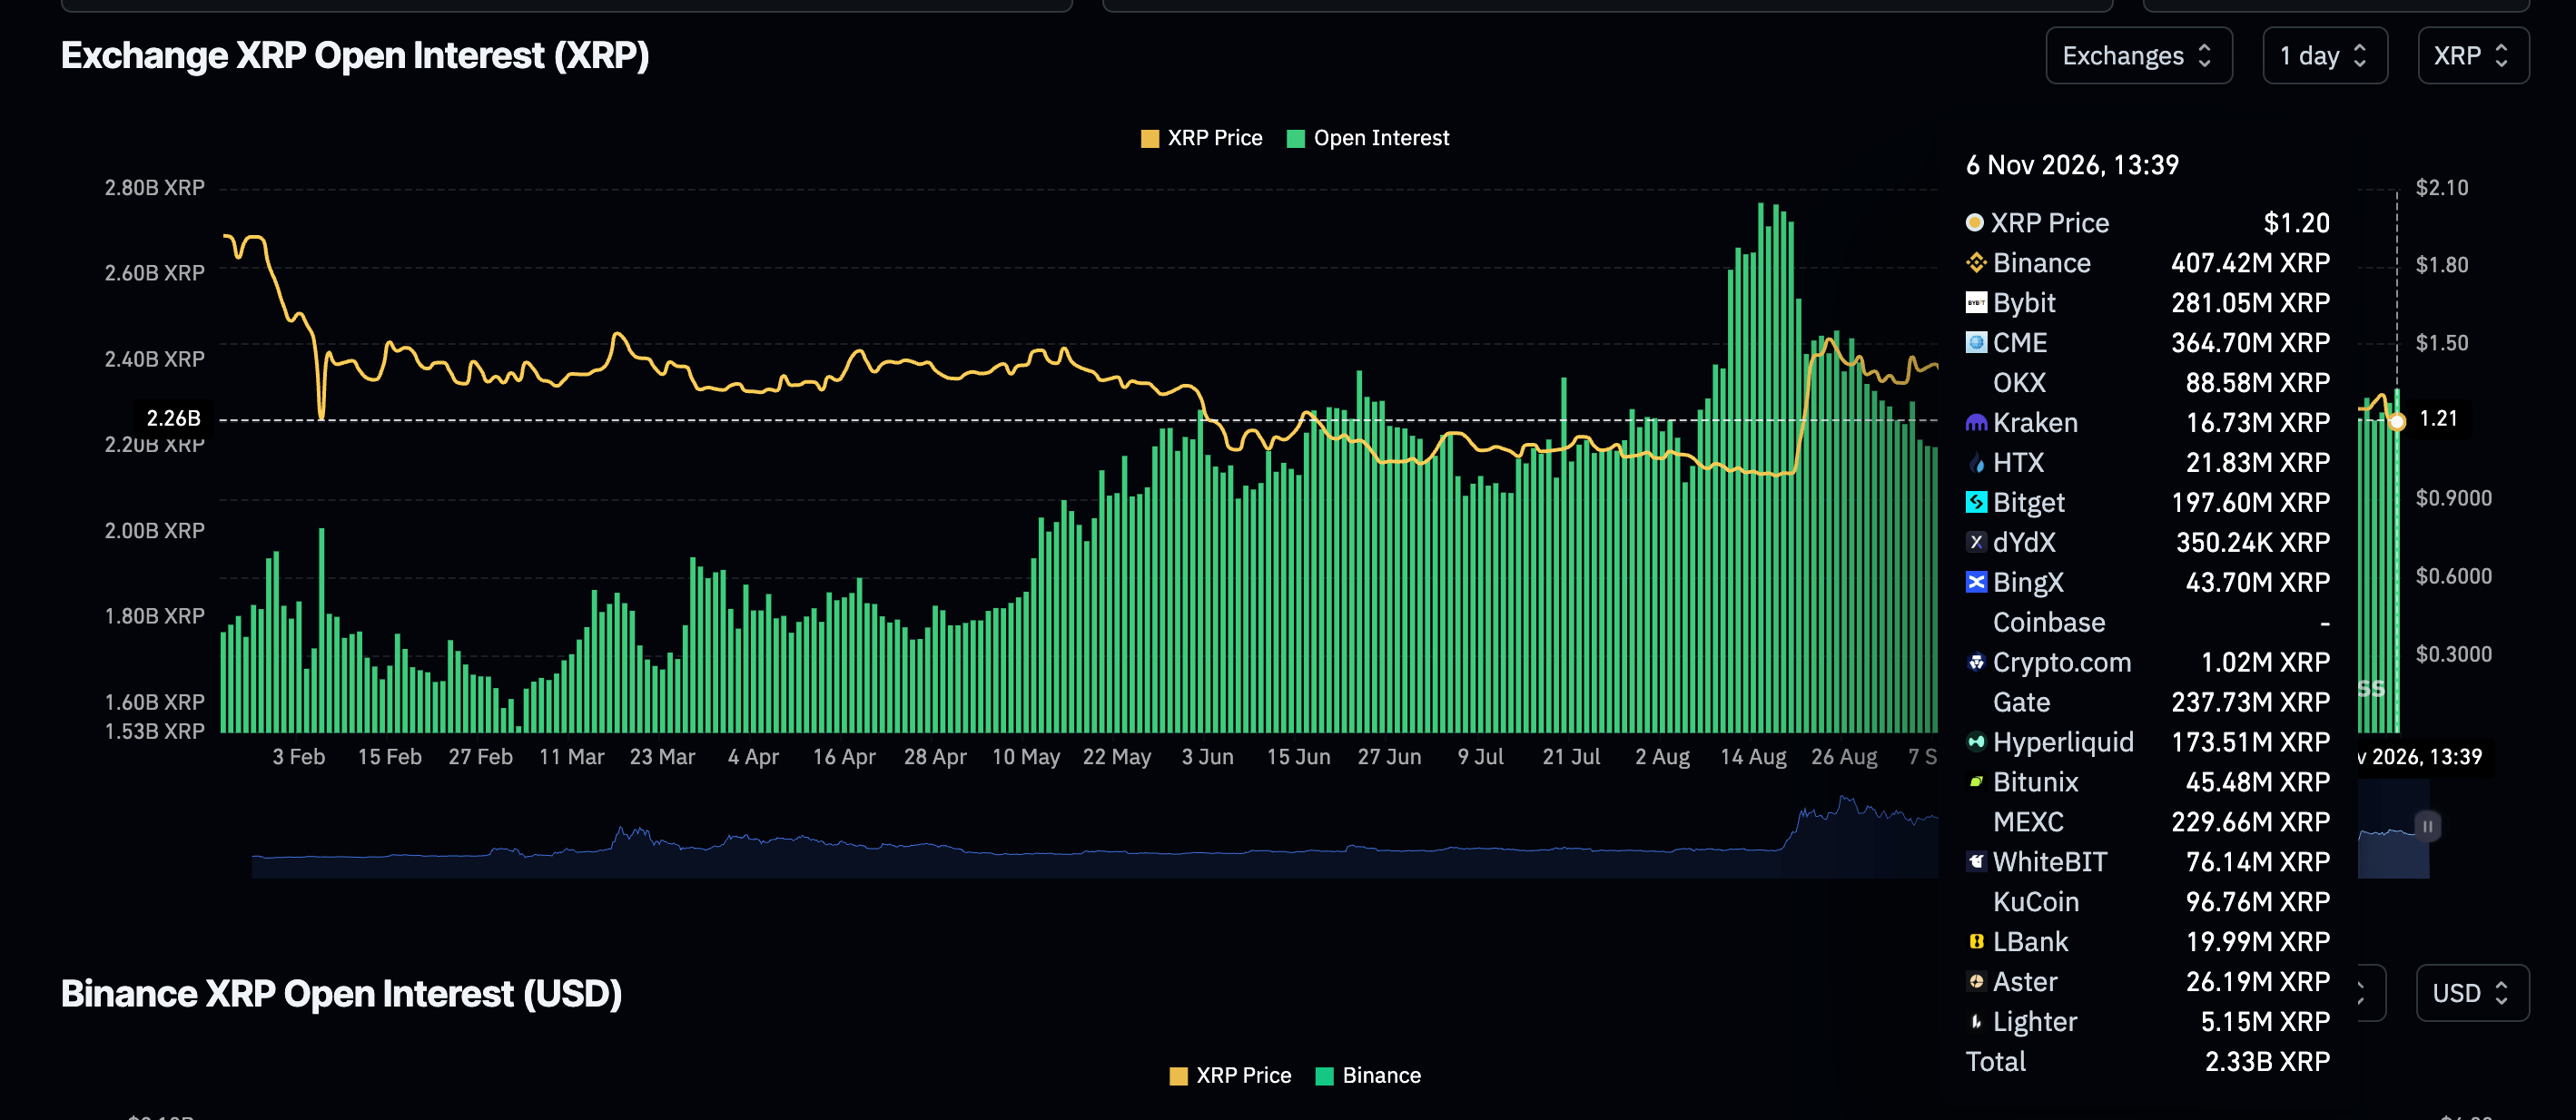
Once excess leverage has been removed and speculation subsides, however, XRP could stabilise or rebound sharply, giving bears reason to moderate their expectations. Retail traders nevertheless appear to be taking advantage of the decline: perpetual futures Open Interest (OI) has increased from 2.28 billion XRP the previous day to 2.33 billion XRP on Friday. A continued improvement in risk appetite could provide greater support for a short-term XRP recovery towards resistance at $1.30.
With XRP trading at $1.20, the bearish bias persists as the price stays firmly below all key Exponential Moving Averages (EMAs) and the midpoint of the Bollinger Bands. Above the market, the 50-day Exponential Moving Average (EMA) stands at $1.33, the 100-day EMA at $1.32 and the 200-day EMA at $1.36, collectively reinforcing the downside bias. The Moving Average Convergence Divergence (MACD) indicator also remains below zero. Meanwhile, a Relative Strength Index (RSI) reading close to 35 suggests that selling pressure is sustained, though not yet extreme.
Just above the spot price, the lower Bollinger band around $1.20 provides the nearest resistance, with the bands’ midline near $1.29 next in view. Beyond that, the 100-day EMA at $1.32 and the 50-day EMA at $1.33 form a concentrated technical obstacle. Further resistance lies at the 200-day EMA of $1.36 and the upper Bollinger band near $1.37.
Until the pair recaptures the $1.29-$1.33 resistance zone, it is likely to remain exposed to further losses, as the daily chart shows no clear structural support below the current price.
(The technical analysis of this story was written with the help of an AI tool. Know more.)
An increase in Open Interest is linked to greater liquidity and fresh capital entering the market. This is viewed as an improvement in market efficiency, with the prevailing trend continuing. A fall in Open Interest, by contrast, is interpreted as evidence of liquidation: investors are withdrawing and overall demand for the asset is weakening, encouraging bearish sentiment.
By raising the liquidation risks traders face, funding fees narrow the gap between an asset’s spot price and its futures contract prices. A funding rate that remains high and positive signals bullish sentiment among market participants and expectations of a price rise. Conversely, a persistently negative funding rate signals bearish sentiment towards an asset. It suggests that traders anticipate a decline in the cryptocurrency’s price and that a bearish trend reversal is likely.







Phone: +61 2 8036 8388
Fax: +61 2 8036 8388
Email: support@tmgm.com



The information provided on this website is of a general nature only and does not constitute personal financial advice. Before acting on any information on this website, you should consider the suitability of the information in relation to your objectives, financial situation and needs. Investing in CFDs and FX Margin Contracts carries significant risks and is not suitable for all investors. You may lose more than your initial deposit. You do not own, or have, any interest in the underlying asset. We recommend that you seek independent advice and ensure you fully understand the risks involved before trading. It is important that you read and consider the disclosure document before you acquire any product listed on the website. The information and advertisements offered on this website are not intended for use by any person in any country or jurisdiction where such use would be contrary to local laws and regulations. The Products and Services offered on this website are not intended for residents of the United States, Malaysia and Thailand.
TMGM is authorized and regulated in various jurisdictions.
Trademax Australia Limited, trading as TMGM, is regulated by the Australian Securities and Investments Commission (ASIC), AFSL no. 436416 and is located at Level 28, One International Tower, 100 Barangaroo Avenue, 2000 Sydney, NSW Australia.
Email: support@tmgm.com.au
Trademax Global Limited, trading as TMGM, is authorized and regulated by the Vanuatu Financial Services Commission (VFSC), registration number 40356 and registered at 1276, Kumul Highway, Port Vila, Vanuatu, Republic of Vanuatu.
Email: support@tmgm.com
Trademax Global Markets (SE) Limited, trading as TMGM, is authorized and regulated by the Financial Services Authority (FSA) of Seychelles, with license number SD224. The company is registered at Office No 13, Providence Estate ABIS Centre, Mahe, Seychelles.
Email: support@tmgm.com
Trademax Global Markets (International) Pty Ltd, trading as TMGM, is authorized and regulated by the Financial Services Commission, Mauritius (FSC) with license no. GB22201012, and registered at 33, Edith Cavell Street C/o IQ EQ Fund Services (Mauritius) Ltd Port Louis, 11324 Mauritius.
Email: support@tmgm.com
Copyright © TMGM. All rights reserved


