
News & AnalysisCareer

Oil prices have dropped more than 5% following encouraging diplomatic signals from the US and Iran, helping Silver (XAG/USD) attempt a recovery on Monday. The metal had fallen to a new yearly low of $48.47 on Friday. XAG/USD is trading at around $51 at the time of writing, a gain of 3.80% for the day.

According to ISNA, Iranian President Masoud Pezeshkian said the Supreme Leader had given the government certain powers over negotiations. That followed an earlier Axios report that US President Donald Trump favours allowing more time for diplomacy with Iran.
With cheaper Oil easing inflation worries, US Treasury yields are extending the recent decline that followed the sell-off in technology shares. This is putting further pressure on the US Dollar (USD), with the combined moves underpinning Silver’s rebound.
Further substantial falls in Oil prices are by no means certain, however. The prospects for diplomacy remain unclear, and both Washington and Tehran continue to leave military options open. Whether diplomatic efforts bring about a sustained drop in Oil prices will therefore determine Silver’s scope for further gains.
Without that outcome, high energy costs could sustain concerns over inflation and keep the Federal Reserve (Fed) on a hawkish course. As Silver generates no yield, higher interest rates raise the opportunity cost of holding it.
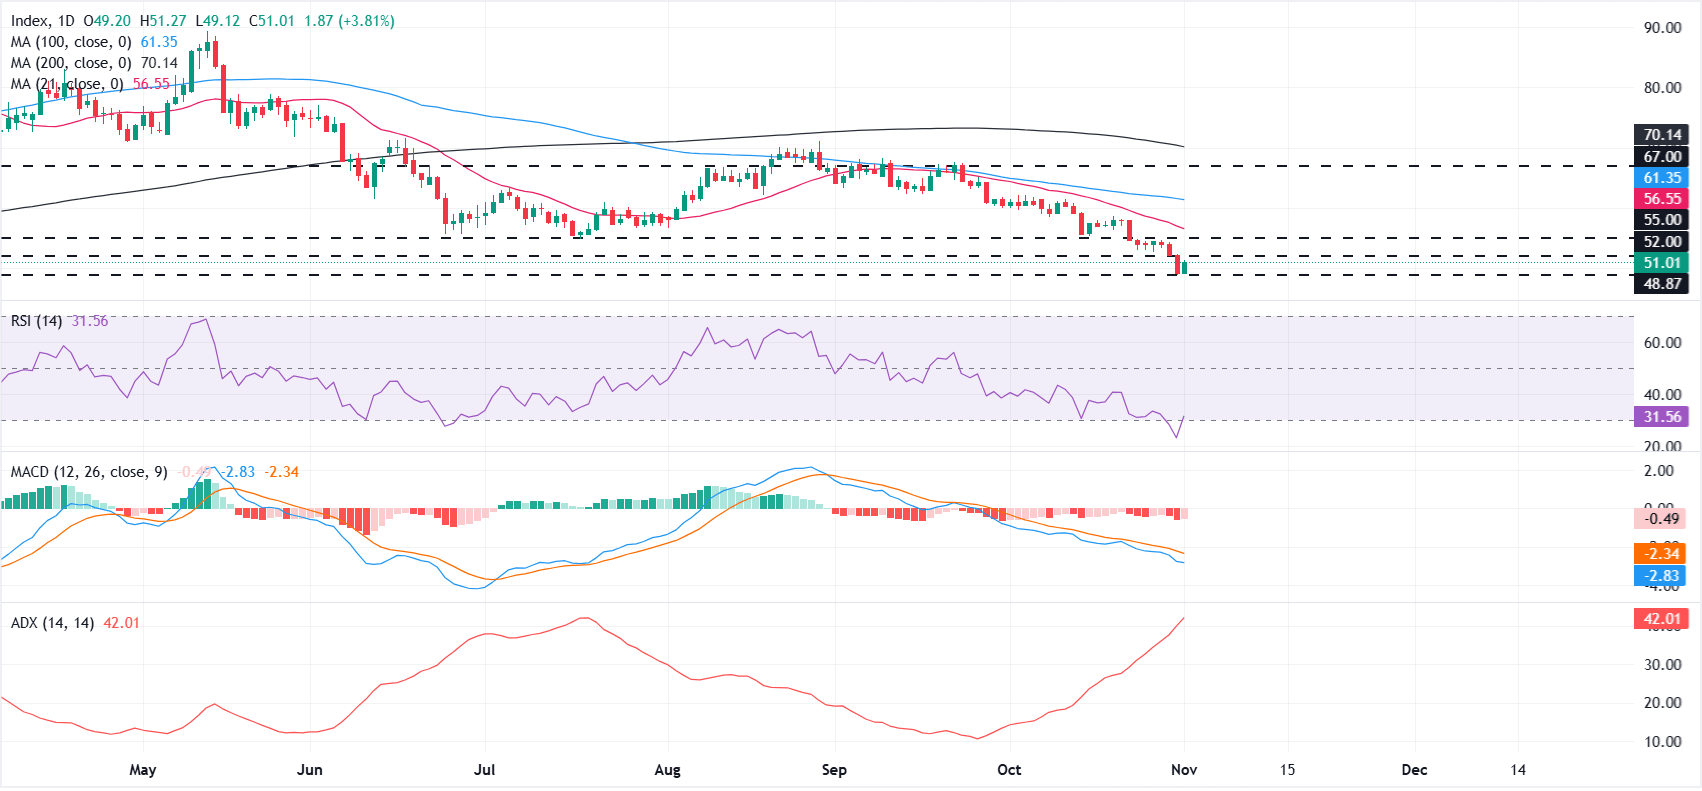
Trading below the 21-day Simple Moving Average (SMA) at $56, the 100-day SMA at $61 and the 200-day SMA at $70, XAG/USD continues to show a bearish bias on the daily chart. Its position beneath all the main trend indicators points to a broader corrective phase. Meanwhile, the Relative Strength Index (RSI) is near 31, having briefly entered oversold territory.
A weak Moving Average Convergence Divergence (MACD) line remains below zero. At the same time, the Average Directional Index (ADX) is rising near 42, indicating that the established downtrend remains strong even with momentum close to oversold levels.
Initial upside resistance lies at $52, followed by a more significant obstacle at $55. The 21-day SMA at $56 adds weight to this supply zone. Beyond it, the 100-day SMA at $61 stands in the way of a more extended recovery, ahead of the previous horizontal ceiling at $67 and the longer-term 200-day SMA at $70.
Friday’s low near $48.87 provides the nearest downside support; a break below it would open the way to further losses. However, with the RSI increasingly oversold and the ADX signalling a strong trend, a decline towards this floor could begin to draw short-covering rather than renewed aggressive selling.
(An AI tool assisted in preparing the technical analysis in this article. Find out more.)
Widely traded by investors, Silver is a precious metal with a long history as both a store of value and a means of exchange. It is less popular than Gold, but traders may choose it to diversify their portfolios, gain exposure to its intrinsic value or potentially hedge against periods of high inflation. Exposure can take the form of physical Silver coins or bars, or instruments such as Exchange Traded Funds that follow its price in international markets.
A broad range of influences can drive Silver prices. Its safe-haven status means geopolitical turmoil or concerns about a severe recession can push prices higher, though generally less so than for Gold. Lower interest rates tend to favour Silver because it produces no yield. Pricing in US dollars (XAG/USD) also leaves it sensitive to movements in the US Dollar (USD): a stronger Dollar typically restrains Silver prices, while a weaker one is likely to lift them. Investment demand, recycling rates and mine supply also play a part, with Silver much more abundant than Gold.
Among metals, Silver has one of the highest levels of electrical conductivity, exceeding both Copper and Gold. This makes it widely used in industry, notably in electronics and solar energy. Rising demand can lift prices, whereas weaker demand tends to depress them. Economic developments in the US, China and India can also cause price fluctuations. Large industrial sectors in the US and, especially, China use Silver in a variety of processes, while Indian consumer demand for Silver jewellery is another important influence on prices.
Given their similar status as safe-haven assets, Silver generally moves in line with Gold and typically rises when Gold prices advance. Investors may use the Gold/Silver ratio to assess the two metals’ relative valuations. The ratio measures how many ounces of Silver equal the value of one ounce of Gold. A high reading may be interpreted by some investors as a sign that Silver is undervalued or Gold overvalued; conversely, a low reading might indicate that Gold is undervalued compared with Silver.







Phone: +61 2 8036 8388
Fax: +61 2 8036 8388
Email: support@tmgm.com



The information provided on this website is of a general nature only and does not constitute personal financial advice. Before acting on any information on this website, you should consider the suitability of the information in relation to your objectives, financial situation and needs. Investing in CFDs and FX Margin Contracts carries significant risks and is not suitable for all investors. You may lose more than your initial deposit. You do not own, or have, any interest in the underlying asset. We recommend that you seek independent advice and ensure you fully understand the risks involved before trading. It is important that you read and consider the disclosure document before you acquire any product listed on the website. The information and advertisements offered on this website are not intended for use by any person in any country or jurisdiction where such use would be contrary to local laws and regulations. The Products and Services offered on this website are not intended for residents of the United States, Malaysia and Thailand.
TMGM is authorized and regulated in various jurisdictions.
Trademax Australia Limited, trading as TMGM, is regulated by the Australian Securities and Investments Commission (ASIC), AFSL no. 436416 and is located at Level 28, One International Tower, 100 Barangaroo Avenue, 2000 Sydney, NSW Australia.
Email: support@tmgm.com.au
Trademax Global Limited, trading as TMGM, is authorized and regulated by the Vanuatu Financial Services Commission (VFSC), registration number 40356 and registered at 1276, Kumul Highway, Port Vila, Vanuatu, Republic of Vanuatu.
Email: support@tmgm.com
Trademax Global Markets (SE) Limited, trading as TMGM, is authorized and regulated by the Financial Services Authority (FSA) of Seychelles, with license number SD224. The company is registered at Office No 13, Providence Estate ABIS Centre, Mahe, Seychelles.
Email: support@tmgm.com
Trademax Global Markets (International) Pty Ltd, trading as TMGM, is authorized and regulated by the Financial Services Commission, Mauritius (FSC) with license no. GB22201012, and registered at 33, Edith Cavell Street C/o IQ EQ Fund Services (Mauritius) Ltd Port Louis, 11324 Mauritius.
Email: support@tmgm.com
Copyright © TMGM. All rights reserved


