
News & AnalysisCareer

October’s Consumer Price Index (CPI) figures are due on Tuesday from the US Bureau of Labor Statistics (BLS). As investors reconsider the Federal Reserve’s (Fed) interest-rate outlook, the release could affect the valuation of the US Dollar (USD).

For most CPI series, the release will omit 12-month percentage changes. October 2025 monthly data are unavailable because collection did not take place during the government shutdown, which ran from 1 October 2025 to 12 November 2025.
Explaining the omission in a press release, the BLS stated: “For most CPI series, BLS could not publish October 2025 indexes. As a result, BLS will not publish 12-month percent changes for October 2026 for indexes where October 2025 data are not available,”
Forecasts point to a 0.3% monthly increase in headline CPI, slowing from September’s 0.6% rise. Core CPI, meanwhile, is expected to advance 0.2%, against 0.3% in the preceding month.
A marked easing in the forthcoming US inflation figures is expected by economists at Deutsche Bank. Their forecast is for “headline CPI [is] to rise by 0.20% month-on-month, down from 0.65% previously, with core CPI also up 0.20% after 0.33% last time.” Even with those softer readings anticipated, the bank’s economists “continue[s] to expect 25bp rate increases at the December and March FOMC meetings, absent a further material tightening in financial conditions.”
To gauge inflationary or deflationary trends, the prices of a representative basket of goods and services are totalled periodically and reported as the Consumer Price Index (CPI). Compiled each month, the CPI figures are published by the US Department of Labor Statistics. The MoM reading compares goods prices in the reference month with those in the preceding month. As a key gauge of inflation, CPI also measures shifts in purchasing trends. A high reading is generally regarded as positive for the US Dollar (USD), whereas a low reading is viewed as negative.
Continue reading.Next publication: Tue 10 Nov 2026 13:30
Publication frequency: Monthly
Market consensus: 0.3%
Previous reading: 0.6%
Data source: US Bureau of Labor Statistics
Inflation should run at around 2% YoY under the US Federal Reserve’s (Fed) dual mandate to maintain price stability and maximum employment. Since the pandemic, however, price stability has remained the weakest pillar of that mandate. Supply-chain disruptions and bottlenecks continue to fuel price pressures, leaving the Consumer Price Index (CPI) at multi-decade highs. Having already acted to curb inflation, the Fed is expected to retain an aggressive policy stance for the foreseeable future.
An additional 25 basis points (bps) increase in the Federal Reserve’s (Fed) policy rate at its final meeting of the year currently carries a probability of about 80% in market pricing, according to the CME FedWatch Tool.
October’s employment report underscored the resilience of the labour market: Nonfarm Payrolls (NFP) increased by 165K, while the Unemployment Rate fell to 4.1% even as the Labor Force Participation Rate edged higher. At the press conference following the Fed’s October decision to hold interest rates in the 3.75%-4.00% range, Fed Chair Kevin Warsh characterised labour market conditions as “positive,” adding that policymakers’ discussions centred primarily on the price stability mandate.
Last week’s sharp decline in crude oil prices came as markets became more hopeful of a diplomatic solution to the Middle East conflict following the Republicans’ midterm election defeat. The latest price drop will not appear in October’s inflation data. Nevertheless, a sizeable downside surprise in monthly CPI, with a reading of 0.1% or lower, alongside further falls in energy prices could prompt market participants to stop pricing in a December rate rise. Such an outcome could trigger abrupt selling of the US Dollar (USD), allowing EUR/USD to build bullish momentum in the near term.
By contrast, inflation matching or exceeding market expectations, together with stalled ceasefire talks with Iran, could strengthen the case for an interest rate increase next month. Market positioning nevertheless suggests that the USD might have only limited scope to advance in these circumstances, leaving any bearish response in EUR/USD short-lived.
Equity market movements could also shape the USD’s valuation and EUR/USD’s performance. Should the sell-off in technology shares continue, it could underpin the USD and restrain EUR/USD gains, even if softer inflation figures strengthen the case for a cautious pace of Fed policy tightening.
The persistence of recent US Dollar strength depends heavily on risk sentiment, according to ING strategists, who observe that “we think the dollar rally requires the risk-off mood to persist this week.” In their view, “Friday’s move looked a bit too stretched relative to short-term market drivers,” creating “some moderate correction risk” should market anxiety subside. Nevertheless, ING still regards the wider environment as supportive of the Dollar, citing the “macro story”
Setting out their forecast, they add: “We expect tomorrow’s October US CPI to come in at 0.3% month-on-month for both headline (consensus 0.3%) and core (0.3%),” and say that this result “should help cement expectations for a December Fed hike (19bp priced in), making the swap curve more protected from other equity market shocks.”
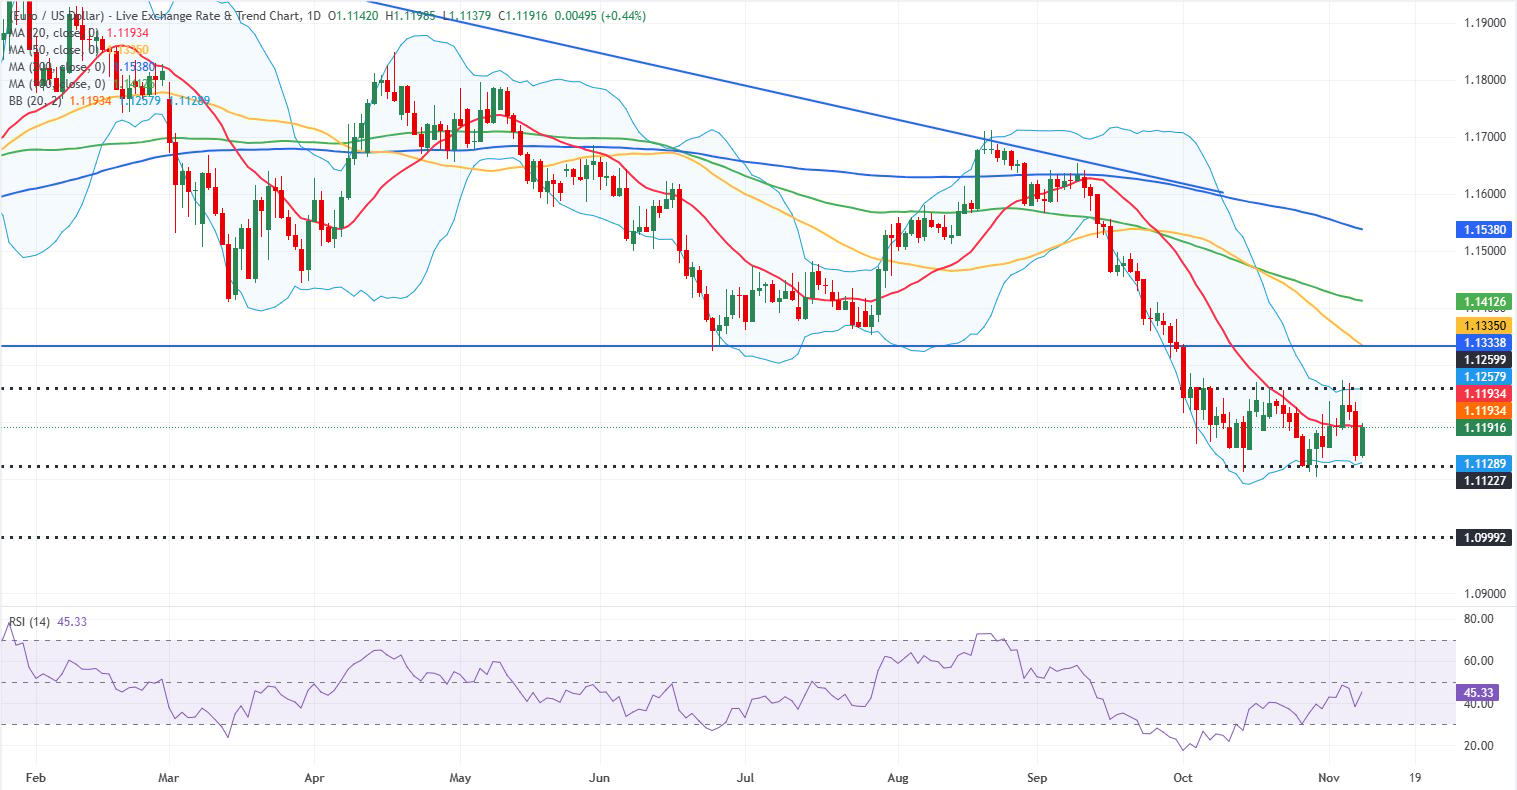
A concise technical assessment of EUR/USD comes from Eren Sengezer, European Session Lead Analyst:
“The EUR/USD pair has been moving in a relatively narrow channel since the beginning of October. During last week’s post-midterm elections rally, the Relative Strength Index (RSI) indicator on the daily chart recovered toward 50 but failed to clear this level, highlighting buyers’ hesitancy.”
“On the upside, 1.1260 (upper arm of the Bollinger Bands, static level) aligns as the first resistance level ahead of 1.1335 (50-day Simple Moving Average (SMA), static level) and 1.1410 (100-day SMA). Looking south, the first support level could be spotted at 1.1130 (lower arm of the Bollinger Bands, static level). If this support fails and gets confirmed as resistance, technical sellers could take action and open the door for an extended drop toward 1.1000 (static level, round level).”
The increase in the cost of a representative basket of goods and services is measured by inflation. Headline readings are generally reported as percentage changes both month-on-month (MoM) and year-on-year (YoY). By stripping out more volatile components, including food and fuel, core inflation excludes prices that can be affected by geopolitical developments and seasonal influences. Economists concentrate on the core measure, which is also targeted by central banks under their mandate to keep inflation at a manageable rate, typically around 2%.
Changes in the prices of a basket of goods and services over a given period are tracked by the Consumer Price Index (CPI). The figures are generally presented as percentage movements month-on-month (MoM) and year-on-year (YoY). Central banks target core CPI, which removes volatile food and fuel components. A core CPI reading above 2% generally leads to higher interest rates, whereas a reading below 2% tends to produce the reverse response. As higher interest rates support a currency, rising inflation usually strengthens it; falling inflation generally has the opposite effect.
A country’s currency tends to appreciate when inflation is high and weaken when inflation is low, however counter-intuitive that may appear. To tackle higher inflation, the central bank will usually increase interest rates. Those higher rates draw in more capital from global investors seeking an attractive return on their money.
Historically, investors sought out Gold during periods of high inflation because it retained its value. Although its safe-haven qualities still often attract buyers during extreme market turbulence, that pattern does not hold in most circumstances. High inflation typically prompts central banks to raise interest rates to bring it under control. For Gold, higher interest rates are a headwind: they raise the opportunity cost of owning the metal rather than an interest-bearing asset or holding money in a cash deposit account. Conversely, lower inflation generally supports Gold by bringing interest rates down and making the precious metal a more attractive investment alternative.







Phone: +61 2 8036 8388
Fax: +61 2 8036 8388
Email: support@tmgm.com



The information provided on this website is of a general nature only and does not constitute personal financial advice. Before acting on any information on this website, you should consider the suitability of the information in relation to your objectives, financial situation and needs. Investing in CFDs and FX Margin Contracts carries significant risks and is not suitable for all investors. You may lose more than your initial deposit. You do not own, or have, any interest in the underlying asset. We recommend that you seek independent advice and ensure you fully understand the risks involved before trading. It is important that you read and consider the disclosure document before you acquire any product listed on the website. The information and advertisements offered on this website are not intended for use by any person in any country or jurisdiction where such use would be contrary to local laws and regulations. The Products and Services offered on this website are not intended for residents of the United States, Malaysia and Thailand.
TMGM is authorized and regulated in various jurisdictions.
Trademax Australia Limited, trading as TMGM, is regulated by the Australian Securities and Investments Commission (ASIC), AFSL no. 436416 and is located at Level 28, One International Tower, 100 Barangaroo Avenue, 2000 Sydney, NSW Australia.
Email: support@tmgm.com.au
Trademax Global Limited, trading as TMGM, is authorized and regulated by the Vanuatu Financial Services Commission (VFSC), registration number 40356 and registered at 1276, Kumul Highway, Port Vila, Vanuatu, Republic of Vanuatu.
Email: support@tmgm.com
Trademax Global Markets (SE) Limited, trading as TMGM, is authorized and regulated by the Financial Services Authority (FSA) of Seychelles, with license number SD224. The company is registered at Office No 13, Providence Estate ABIS Centre, Mahe, Seychelles.
Email: support@tmgm.com
Trademax Global Markets (International) Pty Ltd, trading as TMGM, is authorized and regulated by the Financial Services Commission, Mauritius (FSC) with license no. GB22201012, and registered at 33, Edith Cavell Street C/o IQ EQ Fund Services (Mauritius) Ltd Port Louis, 11324 Mauritius.
Email: support@tmgm.com
Copyright © TMGM. All rights reserved


