


Introduction
A bullish or bearish pennant flag chart pattern is a continuation chart pattern used in technical analysis that forms after a sharp directional move, pauses in a small triangular consolidation, and then traders anticipate a breakout in the direction of the original trend.
What Is a Pennant Flag Pattern?
A pennant flag pattern is a short continuation formation that appears after a strong price impulse. Price pauses inside converging trendlines, then often breakout in the original direction.
The preceding move (flagpole) establishes directional bias, while the consolidation provides a measurable structure for entry and profit targets.
Anatomy: What Does a Pennant Pattern Look Like?
A valid pennant has five core features:
A sharp flagpole before consolidation
Converging trendlines forming a small symmetrical triangle
Tighter price swings as the pattern develops
Volume often fades during consolidation because both sides are exhausting momentum causing price compress. The breakout matters more when activity expands again as price leaves the pattern.
The breakout occurs when price closes beyond either trendline with increased volume, signaling that the tug of war is over.
What Is the Difference Between a Bullish and Bearish Pennant? Bullish vs Bearish Pennant Patterns
A bullish pennant forms after a strong upward move. Price compresses, then breaks above the upper boundary if buyers stay in control.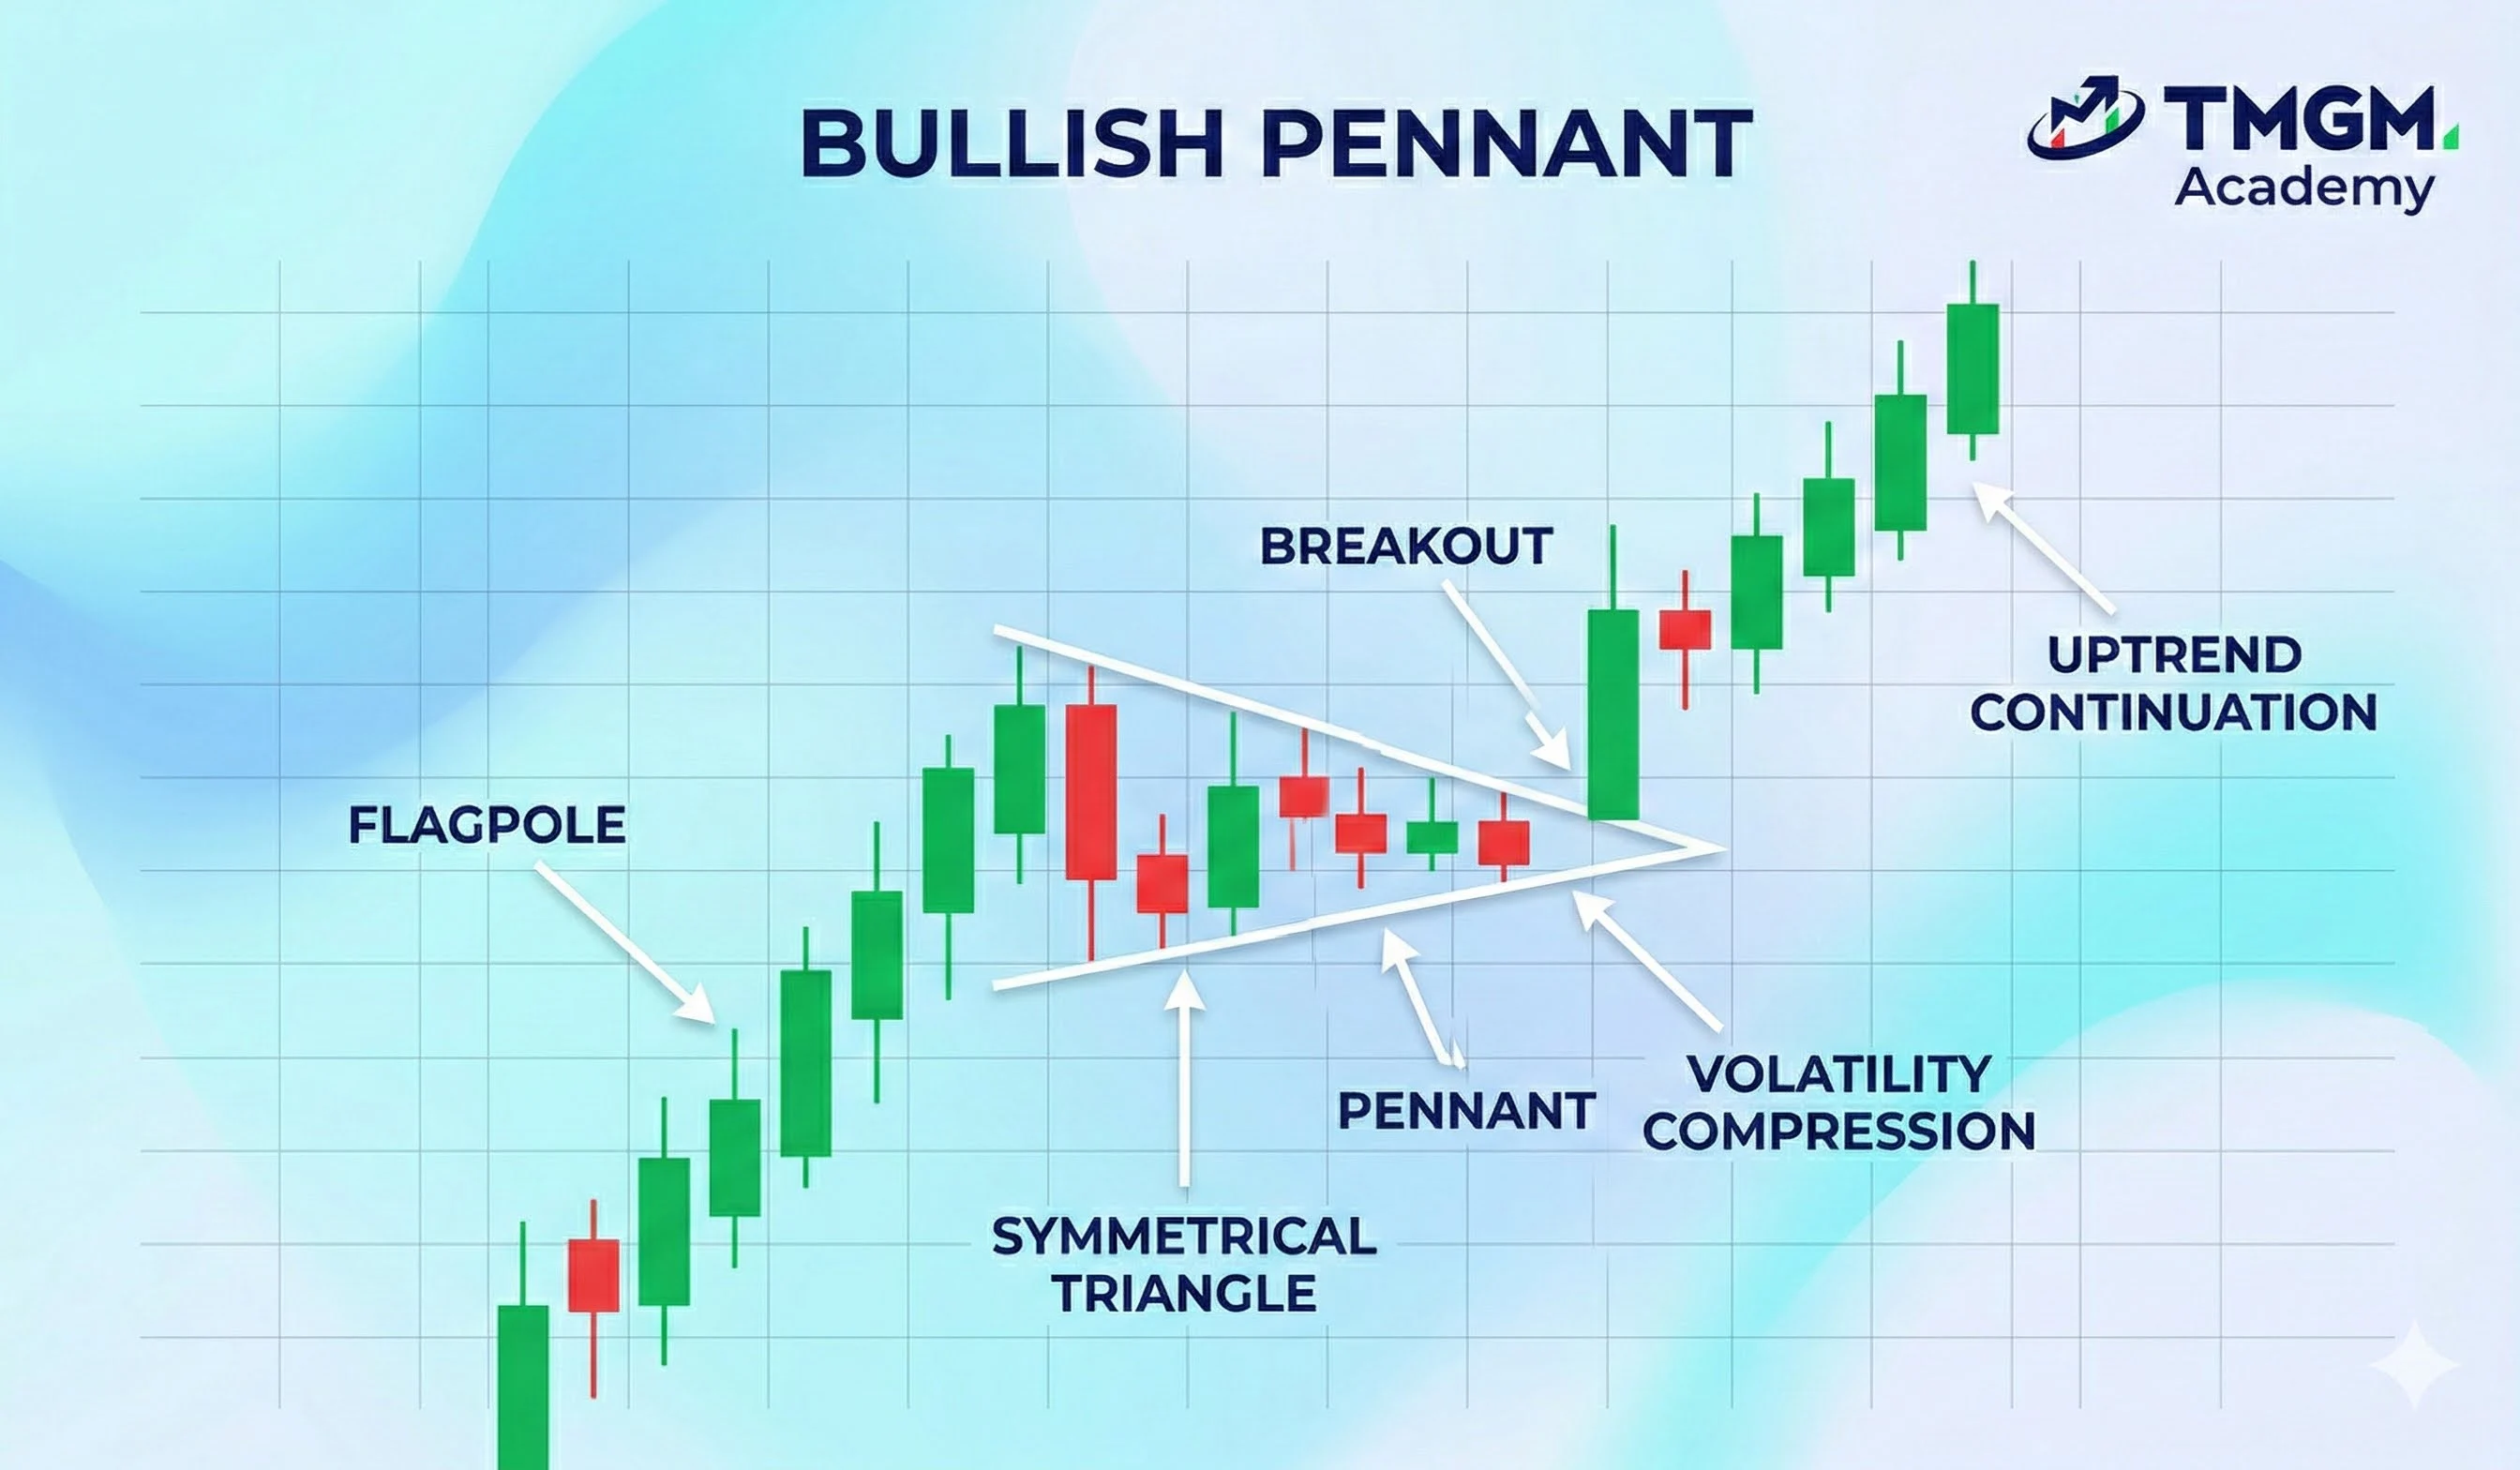
A bearish pennant forms after a sharp decline. Price compresses, then breaks below the lower boundary if sellers keep control.
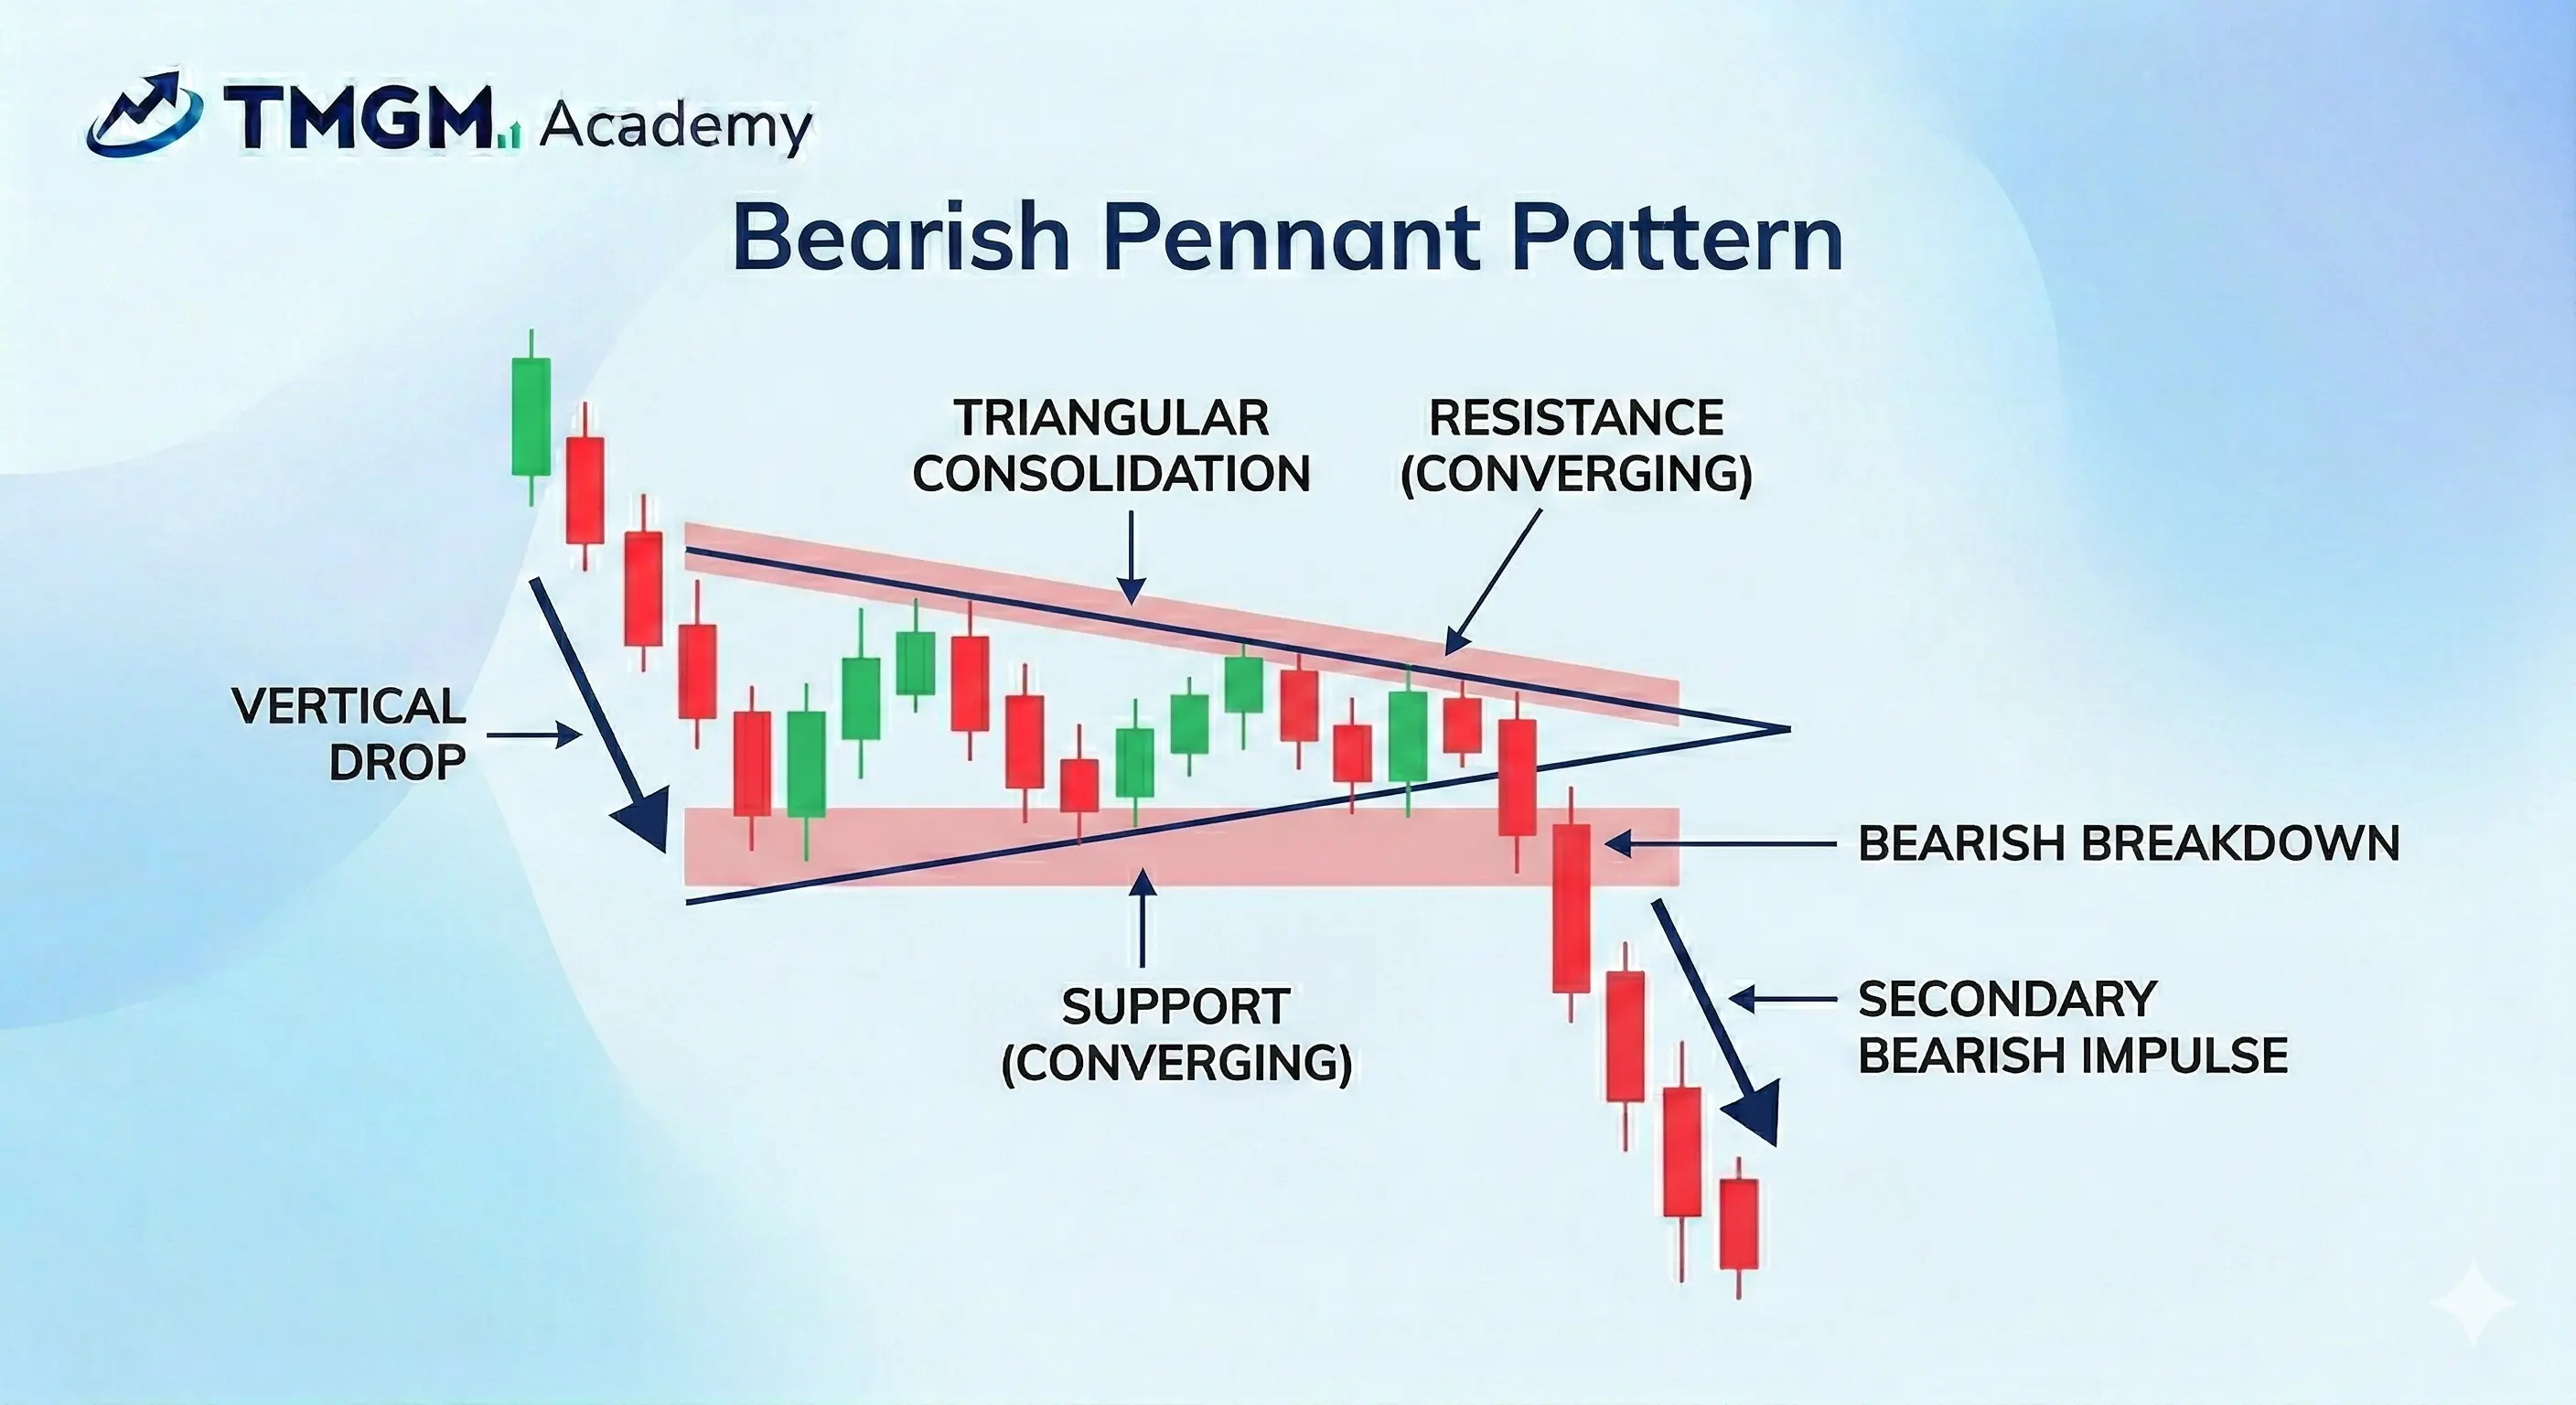
The triangle can look similar in both cases. The key distinction lies in flagpole direction and breakout bias. Both patterns share identical consolidation structures—symmetrical triangles with converging trendlines—but opposite expectation of outcomes.
What Is the Difference Between a Flag and a Pennant Pattern?
A flag pattern consolidates inside roughly parallel boundaries. A pennant pattern consolidates inside converging trendlines.
Flags usually drift in a channel against the prior move. Pennants compress toward an apex, so they often resolve faster and with tighter structure.
How to Trade Pennant Flag Patterns
Identification criteria require five elements:
Sharp flagpole move
Symmetrical triangle consolidation
Converging trendlines at similar angles
Declining volume during consolidation
Completion within three weeks
Entry strategies include breakout entries and retest entries. Breakout entries trigger when price closes beyond the boundaries of the pennant flag, while retest entries trigger when price retest broken out resistance level as the new support level.
Stop-loss placement should be done primarily using the price level that invalidates the pattern. Say, if the pennant anticipates a bullish breakout, and the breakout is confirmed to be bearish, then it broke the pattern, and it should trigger the stop loss.
Profit targets should be decided using the most recent minor or major support/resistance line, or if no such level exists, then you can use the measured move method: measure the flagpole length or the base of the pennant triangle from base to peak, then project that distance from the breakout point.
Pennant Flag Pattern Example With Real Price Data
An Ethereum (ETH/USD) trade gave a practical bullish pennant example on the daily chart in late 2020. The flagpole ran from $381 to $473 between November 4 and November 20, then price consolidated inside the pennant from November 20 to December 15 between $511 and $611. When ETH broke out on December 16, the pattern confirmed continuation rather than reversal.
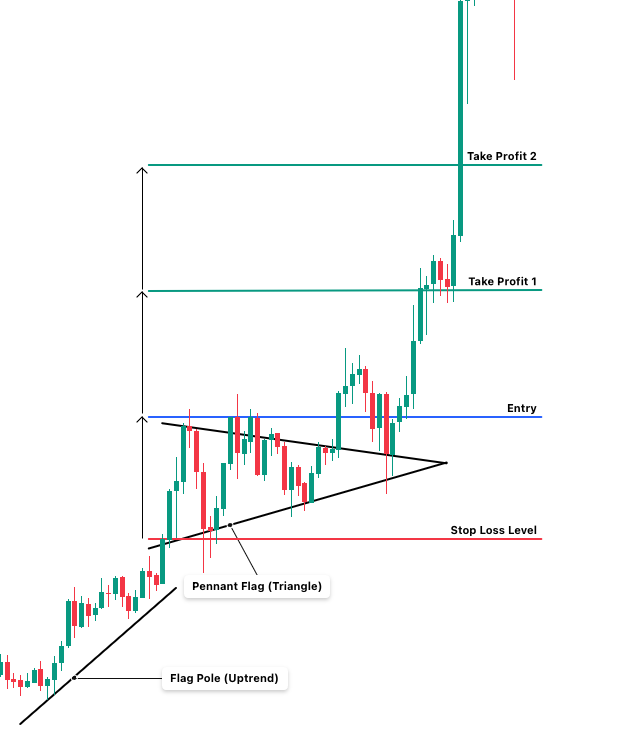
The trade plan was built around the pennant structure. Entry was set at $617, based on the upper swing resistance inside the pattern, while the stop loss was placed near $512 below pennant support in case another upper boundary fakeout occurred. Price then retested the upper boundary on December 23 and December 24 before rebounding higher and moving through the entry, Take Profit 1, and Take Profit 2 levels.
Notice the arrows on the chart. They mark the measured move method used for Take Profit 1 and Take Profit 2. Because ETH was in price discovery, there was no prior major resistance overhead, so measured move targets were more useful than historical resistance.
Common Mistakes and False Breakouts
Premature entries inside consolidation violate pattern structure. Entering before breakout confirmation exposes traders to whipsaws as price oscillates between trendlines. Wait for a decisive close beyond the boundary with volume.
Extended consolidation beyond three weeks invalidates pennants. The pattern loses continuation bias as the original trend momentum dissipates.
Low-volume breakouts signal lack of conviction, therefore reducing the reliability of the setup.
Invalidation signals include:
Breakout fails by breaking the triangle in the wrong direction with more than 2 candlesticks.
Consolidation widens instead of tightening
You should consider exiting positions when patterns show these characteristics.
Quality Assessment: What Makes a Pennant Pattern more Reliable?
High quality pennants form after a strong impulse move and stay small relative to that move. The consolidation should look orderly, not noisy or overlapping.
The best setups usually break before the pattern becomes stale. They also have enough room to run before hitting a major support or resistance zone.
Timeframe matters as well. Daily and 4 hour charts often produce cleaner pennants than very low timeframes, where noise, spread, and execution friction distort the structure.
Bullish and Bearish Pennant Flag Chart Patterns FAQ
How long does a pennant pattern take to form?
A pennant pattern usually forms over a short consolidation after the flagpole. When the pattern drifts too long, it often loses its continuation character.
Can pennant patterns fail even with volume confirmation? Yes. A pennant can fail after breakout if the move lacks follow through, runs into a major barrier, or forms after an already exhausted trend.
Is a pennant the same as a symmetrical triangle?
No. A pennant is a small continuation structure that appears after a sharp flagpole, while a symmetrical triangle can form without that prior impulse and does not always imply continuation.


