

Trading
Explore a wide range of markets with competitive pricing, deep liquidity, and advanced trading tools.
Learn More 
Platform
Trade seamlessly with TMGM's powerful platform, built for speed, precision, and a superior trading experience.
Learn More Trading Platform
Academy
Learn the fundamentals of trading with beginner-friendly resources, including guides, webinars, and market insights.
Learn More News & Analysis
Get real-time market updates and expert analysis to stay ahead of trading opportunities
Learn More News & Analysis
About
Learn what sets TMGM apart — our global presence, regulatory strength, and commitment to innovation in trading.
Learn More Why Choose TMGM
Sponsorship
Can Australian Dollar sustain support near 0.6710 against US Dollar as outlook worsens?
- Buying interest emerges in the Australian Dollar near 0.6710 against the US Dollar.
- Further interest rate hikes appear to face RBA reluctance as economic risks mount.
- Support for the US Dollar has come from concerns over successive Fed interest rate hikes.
Recovering much of its earlier losses, the Australian Dollar (AUD) rebounds towards 0.6735 against the US Dollar (USD) during Wednesday’s European session, after finding temporary support near 0.6710. Despite the Aussie pair’s recovery, uncertainty clouds the outlook amid hopes that the Reserve Bank of Australia’s (RBA) monetary policy cycle has ended.

With downside risks to the economy in focus, RBA comments suggest a very high threshold for another interest rate increase following five hikes so far this year.
Will downside risks keep the RBA cautious after its move above neutral?
Following the RBA’s recent increase in its policy rate to 4.85%, Commerzbank analysts say the latest minutes “underscore once again that the threshold for another rate hike is likely to be rather high,” with the rate now at “its highest level since the global financial crisis in 2008.” In their assessment, the fact that policy is “already well above the RBA’s estimate of the neutral rate of around 3-4%,” strengthens the impression of reluctance among policymakers to tighten further. Drawing attention to dissent within the central bank, Commerzbank notes that “the three members who voted against the latest rate hike warned that the economy could already be close to a sharper downturn,” which, in the analysts’ view, “suggests that the RBA is likely to be cautious about further rate hikes for now.”
Thursday’s October labour market release will be the next key catalyst for the Australian Dollar. Employment is forecast to increase by 25.2K, following a reduction of 39.3K in September, while the unemployment rate is expected to have held at 4.7%.
Expectations that the Federal Reserve (Fed) has embarked on an extended monetary tightening cycle are, meanwhile, helping the US Dollar outperform.
A fresh 19-month high of around 103.86 is reached during the European session by the US Dollar Index (DXY), which tracks the Greenback against six major currencies.
How Is the US Dollar Performing Today?
The US Dollar recorded its strongest performance against the Euro today. Its percentage moves against the major currencies listed are set out in the table below.
| USD | EUR | GBP | JPY | CAD | AUD | NZD | CHF | |
|---|---|---|---|---|---|---|---|---|
| USD | 0.34% | 0.33% | -0.03% | 0.12% | 0.08% | -0.05% | 0.24% | |
| EUR | -0.34% | -0.02% | -0.35% | -0.23% | -0.26% | -0.40% | -0.10% | |
| GBP | -0.33% | 0.02% | -0.34% | -0.22% | -0.25% | -0.38% | -0.08% | |
| JPY | 0.03% | 0.35% | 0.34% | 0.13% | 0.09% | -0.04% | 0.26% | |
| CAD | -0.12% | 0.23% | 0.22% | -0.13% | -0.04% | -0.17% | 0.13% | |
| AUD | -0.08% | 0.26% | 0.25% | -0.09% | 0.04% | -0.13% | 0.16% | |
| NZD | 0.05% | 0.40% | 0.38% | 0.04% | 0.17% | 0.13% | 0.31% | |
| CHF | -0.24% | 0.10% | 0.08% | -0.26% | -0.13% | -0.16% | -0.31% |
Percentage movements between the major currencies are displayed in the heat map. Select the base currency in the left-hand column and the quote currency in the top row. Selecting the US Dollar on the left and following its row across to the Japanese Yen, for instance, gives the percentage change for USD (base)/JPY (quote) in the corresponding cell.
Despite a “large drop in crude oil prices and some diminished enthusiasm for all things AI-related.” MUFG analysts note that the US Dollar “hit a new high as market participants continue to position for a series of Fed rate hikes”
Turning to the policy outlook, ING offered the following assessment: “the minutes of the FOMC meeting in October will be released this evening and will likely reflect the growing consensus amongst FOMC members that there is more work to do, signalling further rate hikes in Q1 next year.”
AUD/USD Technical Analysis: Can Selling Pressure Ease?
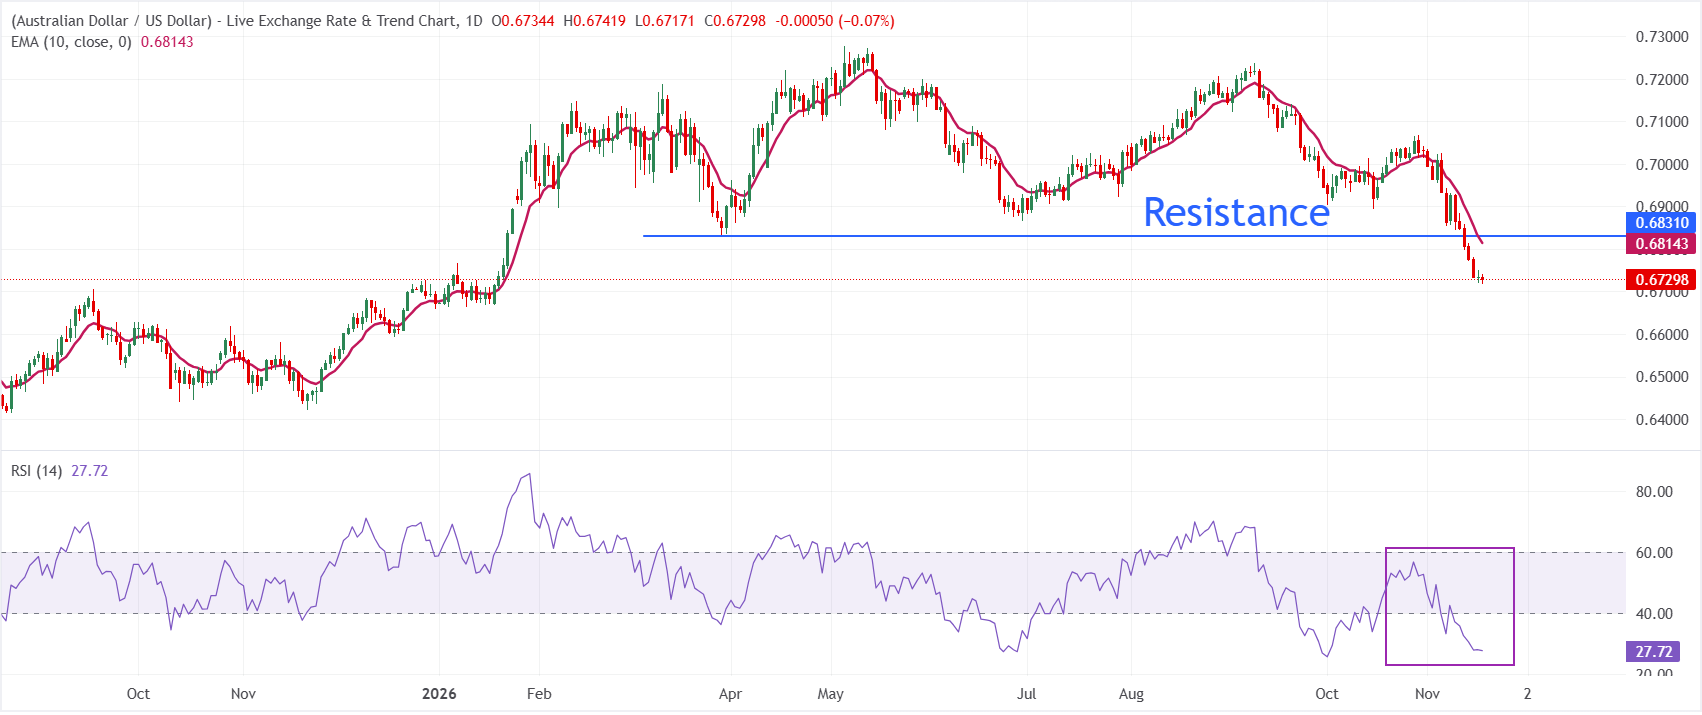
A bearish near-term outlook remains in place for AUD/USD on the daily chart, with the pair trading at 0.6730 below its 10-day exponential moving average (EMA) of 0.6814. Having fallen further from recent highs, it now stands well beneath this short-term trend indicator, suggesting that sellers retain control. At 27.7, the Relative Strength Index (RSI) is in oversold territory, indicating that downward momentum may be stretched without yet signalling a reversal.
For immediate selling pressure to ease and a more substantial corrective recovery to become possible, AUD/USD would need a daily close above initial resistance at the 10-day EMA, around 0.6814. Failure to regain that level is likely to leave the pair susceptible to additional losses. With no nearby structural support visible on the chart, renewed bearish pressure would leave it exposed to fresh lows.
(The technical analysis of this story was written with the help of an AI tool. Know more.)
Economic Data in Focus
Seasonally Adjusted Employment Change
Published by the Australian Bureau of Statistics, Employment Change tracks changes in the number of people employed in Australia, with seasonal effects removed from the data. An increase generally supports consumer spending and economic growth, making it positive for the Australian Dollar (AUD). Conversely, a weak reading is viewed as bearish for the currency.
View further details.Upcoming release: Thu 19 Nov 2026 00:30
Release frequency: Every month
Consensus estimate: 25.2K
Prior reading: -39.3K
Data source: Australian Bureau of Statistics
POPULAR ARTICLES
1Singapore Dollar: What do US yields mean for SGD recovery prospects? - OCBC2Chinese Yuan: Is a gradual rise towards 6.6520 against the US Dollar likely? – UOB3Silver Price Forecast: What does an oversold RSI signal as the downtrend intensifies?4United Kingdom: Societe Generale forecasts inflation peak of 4.5% in Q1 20275US Dollar: Is Upside Pressure Building on Fed Tightening Expectations? – ING6Why has the New Zealand Dollar hit pandemic-era lows as Fed and RBNZ policies diverge?7Are lingering intervention risks supporting the Japanese Yen near 160.00?8Why is the pound hitting a five-week low amid a UK CPI miss and Fed hike expectations?9British Pound: Does the BoE path reinforce downside risks? – BBH


Get Started!
Sign up and access the Global Markets in less than 3 minutes

Connect With Us









Contacts
Phone: +61 2 8036 8388
Fax: +61 2 8036 8388
Email: support@tmgm.com



The information provided on this website is of a general nature only and does not constitute personal financial advice. Before acting on any information on this website, you should consider the suitability of the information in relation to your objectives, financial situation and needs. Investing in CFDs and FX Margin Contracts carries significant risks and is not suitable for all investors. You may lose more than your initial deposit. You do not own, or have, any interest in the underlying asset. We recommend that you seek independent advice and ensure you fully understand the risks involved before trading. It is important that you read and consider the disclosure document before you acquire any product listed on the website. The information and advertisements offered on this website are not intended for use by any person in any country or jurisdiction where such use would be contrary to local laws and regulations. The Products and Services offered on this website are not intended for residents of the United States, Malaysia and Thailand.
TMGM is authorized and regulated in various jurisdictions.
Trademax Australia Limited, trading as TMGM, is regulated by the Australian Securities and Investments Commission (ASIC), AFSL no. 436416 and is located at Level 28, One International Tower, 100 Barangaroo Avenue, 2000 Sydney, NSW Australia.
Email: support@tmgm.com.au
Trademax Global Limited, trading as TMGM, is authorized and regulated by the Vanuatu Financial Services Commission (VFSC), registration number 40356 and registered at 1276, Kumul Highway, Port Vila, Vanuatu, Republic of Vanuatu.
Email: support@tmgm.com
Trademax Global Markets (SE) Limited, trading as TMGM, is authorized and regulated by the Financial Services Authority (FSA) of Seychelles, with license number SD224. The company is registered at Office No 13, Providence Estate ABIS Centre, Mahe, Seychelles.
Email: support@tmgm.com
Trademax Global Markets (International) Pty Ltd, trading as TMGM, is authorized and regulated by the Financial Services Commission, Mauritius (FSC) with license no. GB22201012, and registered at 33, Edith Cavell Street C/o IQ EQ Fund Services (Mauritius) Ltd Port Louis, 11324 Mauritius.
Email: support@tmgm.com
Copyright © TMGM. All rights reserved