

Trading
Explore a wide range of markets with competitive pricing, deep liquidity, and advanced trading tools.
Learn More 
Platform
Trade seamlessly with TMGM's powerful platform, built for speed, precision, and a superior trading experience.
Learn More Trading Platform
Academy
Learn the fundamentals of trading with beginner-friendly resources, including guides, webinars, and market insights.
Learn More News & Analysis
Get real-time market updates and expert analysis to stay ahead of trading opportunities
Learn More News & Analysis
About
Learn what sets TMGM apart — our global presence, regulatory strength, and commitment to innovation in trading.
Learn More Why Choose TMGM
Sponsorship
Crypto Today: Why are Bitcoin, Ethereum, XRP falling as a hawkish Fed tone dampens sentiment?
- Bitcoin retreats to $80,000 on Thursday, weighed down by the Fed’s hawkish stance despite its decision to leave rates unchanged.
- Ethereum’s correction brings it close to the crucial 200-day EMA at $2,316; a close below this level could deepen the decline.
- XRP remains vulnerable to additional losses as it trades below the crucial $1.300 support, should that level fail to hold.
Cryptocurrency sentiment comes under pressure on Thursday, with Bitcoin (BTC), Ethereum (ETH) and Ripple (XRP) retreating after the Federal Reserve (Fed) left interest rates unchanged but maintained a hawkish tone. Further losses threaten all three: BTC eases towards $80,000, ETH nears its 200-day Exponential Moving Average (EMA) at $2,316, and XRP remains below support at $1.300.

Why are BTC, ETH and XRP under pressure after the Fed’s hawkish rate hold?
Following its two-day October policy meeting, the Fed kept its policy rate at 3.75%-4.00% on Wednesday, though the decision was not unanimous. Lisa Cook and Beth Hammack were the two officials seeking a 25-basis-point increase. Chair Kevin Warsh, meanwhile, said incoming information would guide the Fed’s assessment of whether additional action was necessary.
At his press conference, Warsh said officials have “made clear our readiness to act as circumstances require, and we have shown our willingness to act.”
Highlighting the inflation mandate, Warsh said: “It’s our responsibility to get inflation down,” and added: “That’s the reason the FOMC’s discussion over the last couple of days focused mainly on the price stability side of our remit,”
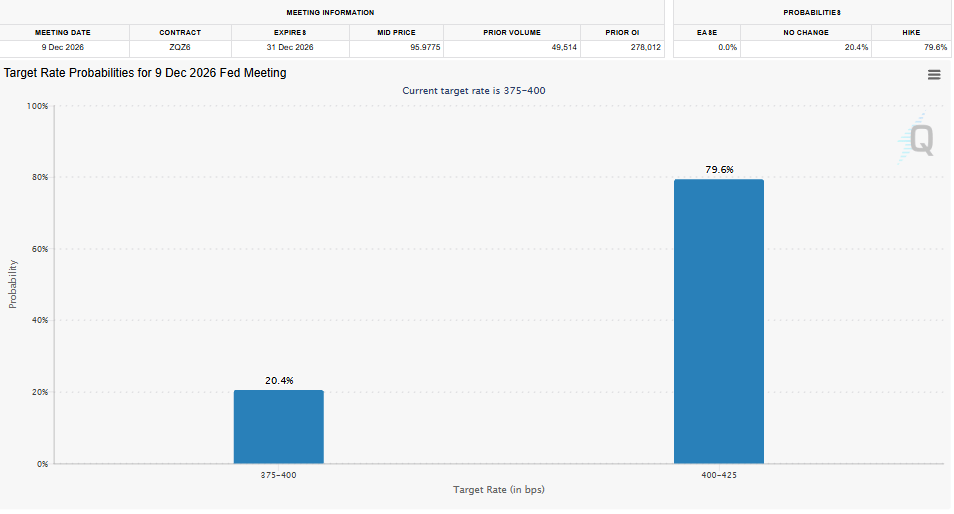
Although unchanged rates were already priced in, the hawkish tone and inflation concerns in the Fed’s forward guidance reinforce caution across markets, putting pressure on risk assets such as cryptocurrencies. The CME FedWatch Tool put the probability of tightening at the 9 December meeting at 79.6% on Thursday, a slight increase from Tuesday’s 78.33%. This tilt towards tighter monetary policy provides mild support to safe-haven assets: the 10-year Treasury yield remains above 5%, while the US Dollar Index (DXY) holds above $102. By contrast, risk assets BTC, ETH and XRP fell to $80,000, $2,300 and $1.300, respectively, on Thursday.
Adding to the pressure on the wider crypto market, Thursday’s stronger-than-anticipated growth figures and persistent inflation readings lend further support to the USD.
September’s annual US Personal Consumption Expenditures (PCE) inflation reading rose to 3.6% YoY from 3.4% in August, in line with market forecasts. On a monthly basis, PCE increased by 0.5%, compared with the previous 0.3%. Excluding volatile food and energy prices, core PCE advanced 3.1% year-on-year and 0.3% month-on-month. The first estimate from the US Bureau of Economic Analysis (BEA), also released on Thursday, showed US Gross Domestic Product (GDP) expanding at an annual rate of 3.4% in the third quarter. That exceeded the market forecast of 3.2% and followed growth of 2.2% in the second quarter.
What do Bitcoin ETF inflows, Ethereum outflows and muted XRP demand signal?
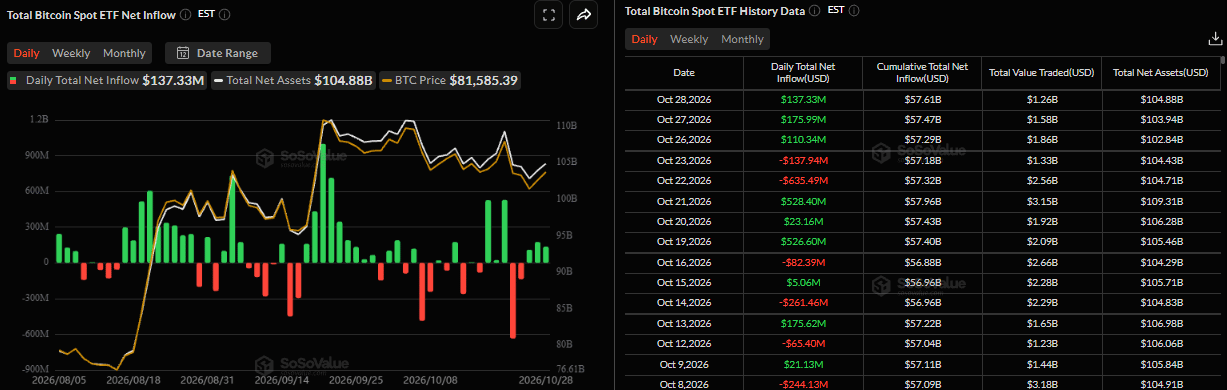
Demand for digital asset investment products has been uneven this week so far. On Wednesday, spot Bitcoin ETFs attracted $137.33 million, according to SoSoValue, marking the third consecutive week of inflows. The daily inflows recorded thus far point to modest institutional buying, although their smaller size compared with last week suggests investors remain cautious.
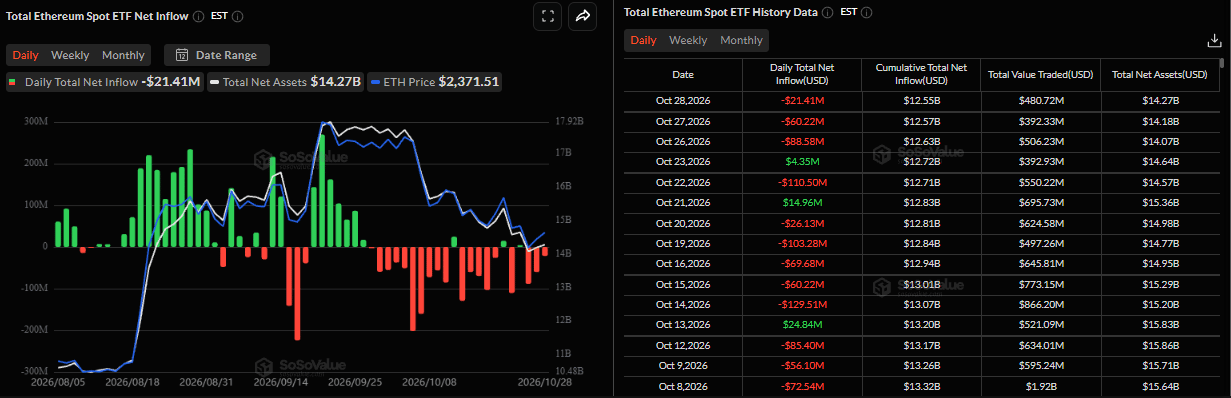
Institutional appetite for ETH, by comparison, appeared to weaken. Wednesday brought modest outflows of $21.41 million from spot Ethereum ETFs, SoSoValue figures showed, extending withdrawals to a third consecutive day.
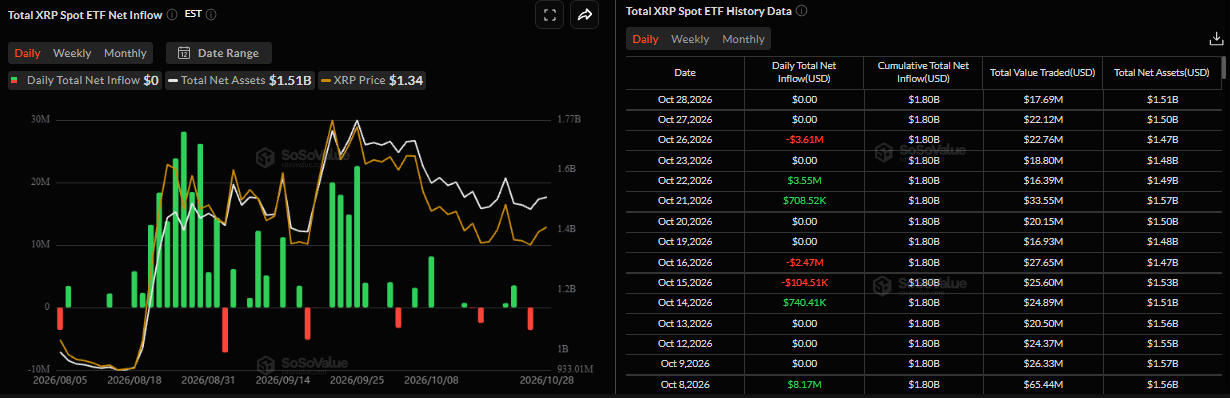
For XRP, institutional activity was subdued on both Wednesday and Tuesday. This followed a modest $3.61 million outflow on Monday, pointing to waning demand and interest among traders.
Technical analysis: Can Bitcoin find support as momentum weakens?
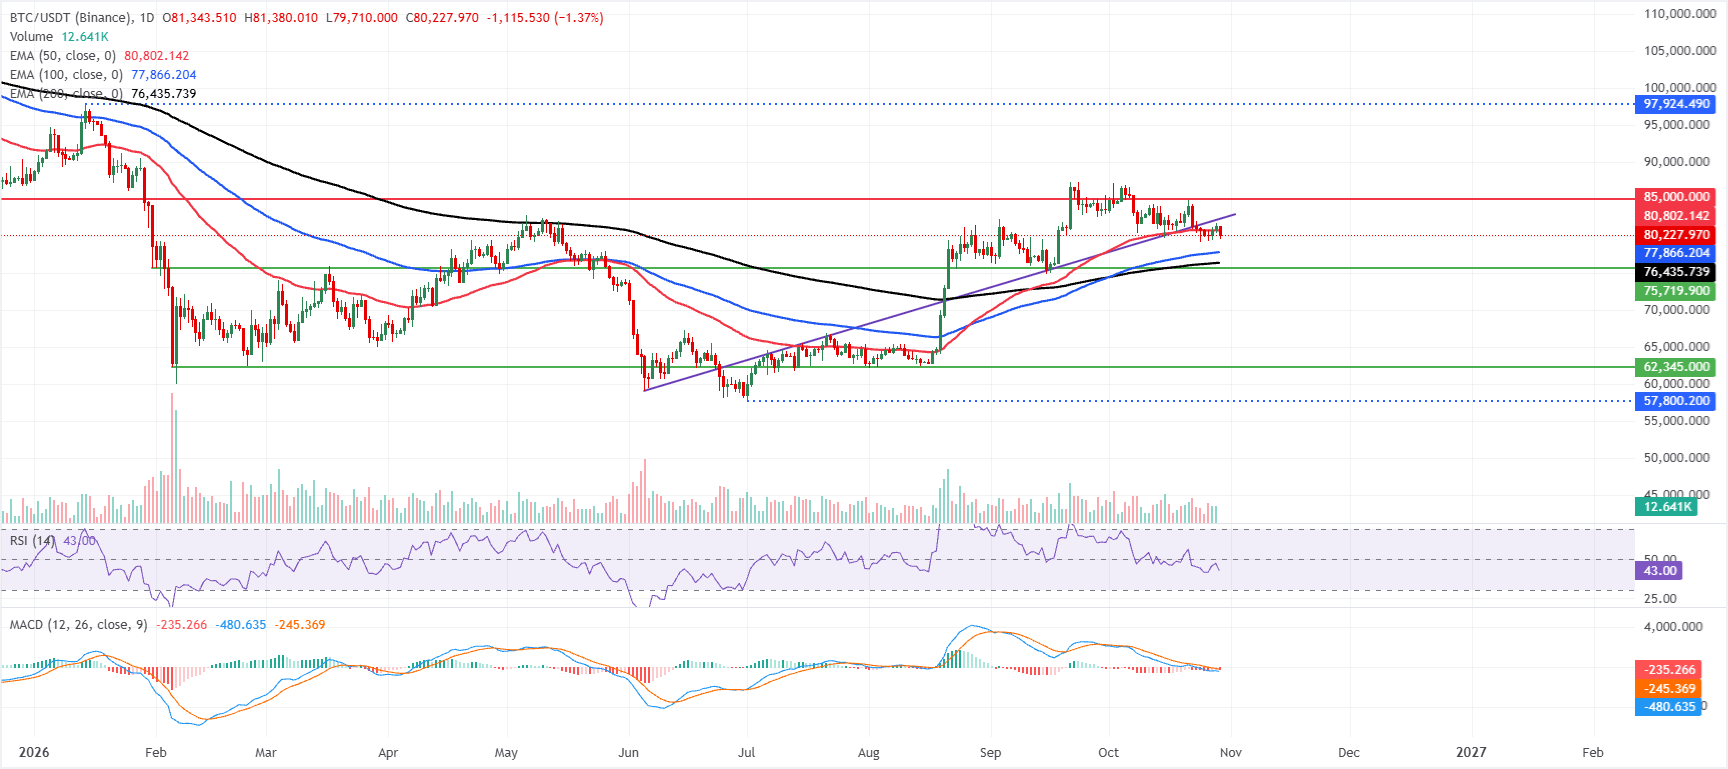
At $80,227 on Thursday, Bitcoin remains above its 100-day and 200-day Exponential Moving Averages (EMAs), positioned at $77,866 and $76,435, respectively. Its 50-day EMA at $80,802, however, continues to limit gains.
The near-term outlook therefore ranges from neutral to bearish. A decline in the Relative Strength Index (RSI) to 43 points to weakening upward momentum, while the Moving Average Convergence Divergence (MACD) stays negative, below the zero line. Together, these signals indicate diminishing bullish pressure, even though the broader uptrend retains its foundation above the longer-term EMAs.
Any recovery would first encounter resistance at the 50-day EMA around $80,802. Beyond that lies the horizontal $85,000 barrier, where selling seen previously could return.
Should prices decline, the 100-day EMA near $77,866 offers the first significant support, followed by the stronger structural floor at the 200-day EMA around $76,435. A daily close beneath these levels would strengthen the bearish outlook and leave scope for a sharper correction.
Technical analysis: Can Ethereum hold its floor as XRP loses support?
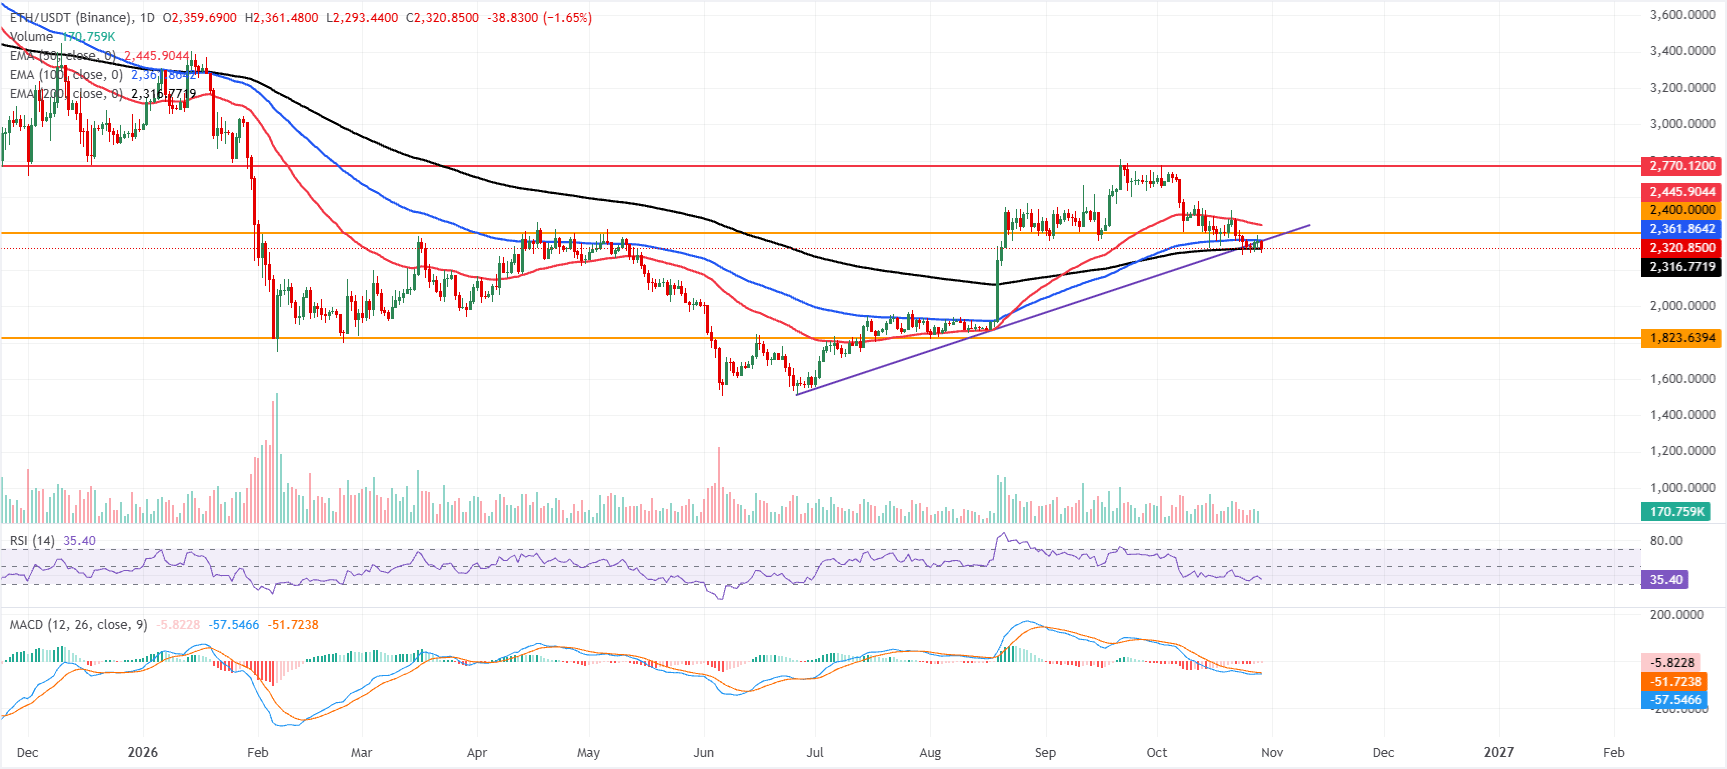
Trading at $2,320, Ethereum continues to show a bearish near-term bias. It is barely holding support at the 200-day EMA of $2,316 after slipping just below the 100-day EMA at $2,361 and the 50-day EMA at $2,445. ETH has also retreated below the previously broken ascending trendline reference around $2,360, with the horizontal $2,400 barrier still restricting gains. Meanwhile, an RSI near 35 remains subdued. Alongside a negative but improving MACD line, it points to weak downside momentum that is stabilising, rather than a convincing shift towards a bullish trend.
Immediate downside support lies broadly around the current trading area, underpinned by the 200-day EMA at $2,316. Further below, the horizontal level near $1,823 provides a deeper structural floor.
A recovery would initially face the former trendline and short-term pivot around $2,360, before reaching the horizontal barrier at $2,400. Holding a break above both would bring the 50-day EMA at $2,445 into view, with the higher resistance region near $2,770 beyond it.
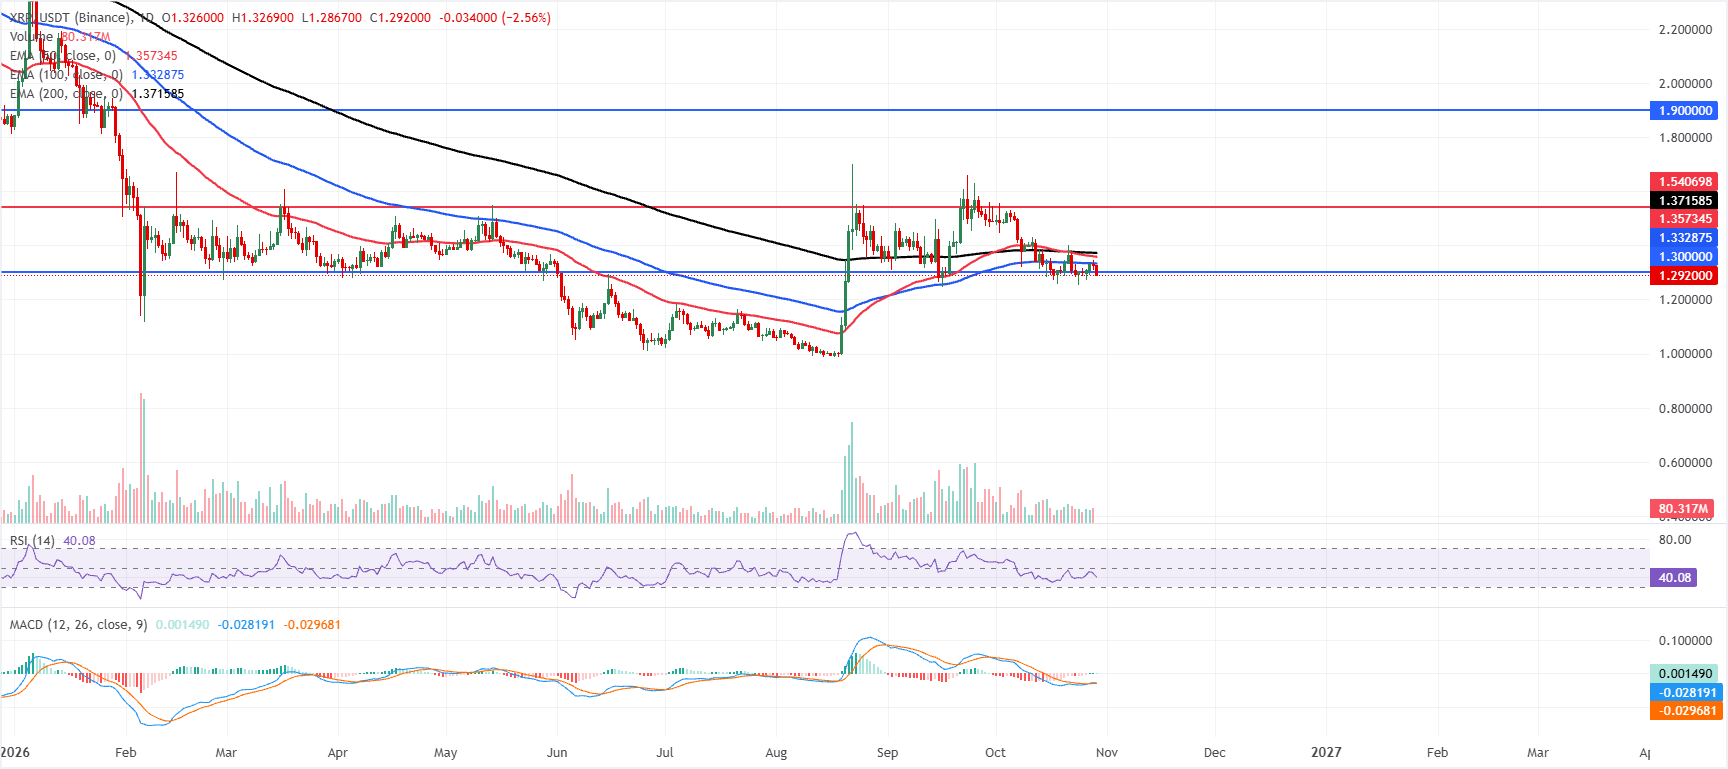
At $1.292, XRP retains a bearish near-term outlook, with the spot price below every key Exponential Moving Average (EMA). Overhead resistance is layered across the 100-day EMA at $1.332, the 50-day EMA at $1.357 and the 200-day EMA at $1.371. Recoveries remain vulnerable while XRP trades beneath this cluster.
Momentum indicators offer a mixed picture. An RSI reading of 40 remains weak and below neutral, whereas the MACD has only just edged into positive territory. This suggests tentative stabilisation efforts, not a confirmed bullish reversal.
For any upward move, the nearby horizontal $1.300 level presents the first resistance, followed by the 100-day EMA near $1.332 and the 50-day EMA at $1.357. The 200-day EMA at $1.371 adds a broader ceiling to the corrective move, before higher resistance at $1.540 and $1.900. The current dataset identifies no significant support below the prevailing price. Consequently, an extended decline would leave XRP vulnerable to renewed selling until fresh demand zones take shape on the chart.
(The technical analysis of this story was written with the help of an AI tool. Know more.)
FAQs on cryptocurrency prices
Demand and adoption among market participants are influenced by token launches. When an asset is listed on a crypto exchange, its liquidity increases and new participants join its network. These developments are generally positive for the digital asset’s price.
During a hack, an attacker uses exploits, bugs or other methods to seize a substantial quantity of an asset from a DeFi bridge, an exchange’s hot wallet or another crypto platform. The stolen tokens are then moved off exchange platforms, ultimately to be sold or exchanged for other cryptocurrencies or stablecoins. Such incidents frequently spark widespread panic, prompting a sell-off in the affected assets.
The US Dollar is the main channel through which macroeconomic developments, including US Federal Reserve interest-rate decisions, affect crypto assets. Higher interest rates generally put pressure on Bitcoin and altcoin prices, while lower rates tend to have the opposite effect. A decline in the US Dollar index makes risk assets and the leverage used to trade them cheaper, thereby lifting cryptocurrency prices.
By cutting miners’ block rewards in half, halvings constrain the asset’s supply and are therefore usually viewed as bullish events. With demand unchanged, a reduction in supply pushes the asset’s price higher.
POPULAR ARTICLES
1Euro stays on the back foot against British Pound as ECB leaves rates unchanged2Indonesia: How is MSCI spillover weighing on IndoGBs? – DBS3Hungary: What next for fiscal consolidation and the euro plan? – Societe Generale4Lagarde speech: Rate trajectory is quite clear5Lagarde speech: Governing Council weighed whether a rate hike was warranted6Why has the euro hit a 17-month low as ECB keeps rates unchanged and US PCE inflation quickens?7Lagarde speech: Could confidence suffer from fiscal uncertainty?8Why is the Canadian Dollar weakening as US PCE inflation and GDP reinforce hawkish Fed bets?9Bank of Canada: Rabobank Flags Risk of Further Tightening


Get Started!
Sign up and access the Global Markets in less than 3 minutes

Connect With Us









Contacts
Phone: +61 2 8036 8388
Fax: +61 2 8036 8388
Email: support@tmgm.com



The information provided on this website is of a general nature only and does not constitute personal financial advice. Before acting on any information on this website, you should consider the suitability of the information in relation to your objectives, financial situation and needs. Investing in CFDs and FX Margin Contracts carries significant risks and is not suitable for all investors. You may lose more than your initial deposit. You do not own, or have, any interest in the underlying asset. We recommend that you seek independent advice and ensure you fully understand the risks involved before trading. It is important that you read and consider the disclosure document before you acquire any product listed on the website. The information and advertisements offered on this website are not intended for use by any person in any country or jurisdiction where such use would be contrary to local laws and regulations. The Products and Services offered on this website are not intended for residents of the United States, Malaysia and Thailand.
TMGM is authorized and regulated in various jurisdictions.
Trademax Australia Limited, trading as TMGM, is regulated by the Australian Securities and Investments Commission (ASIC), AFSL no. 436416 and is located at Level 28, One International Tower, 100 Barangaroo Avenue, 2000 Sydney, NSW Australia.
Email: support@tmgm.com.au
Trademax Global Limited, trading as TMGM, is authorized and regulated by the Vanuatu Financial Services Commission (VFSC), registration number 40356 and registered at 1276, Kumul Highway, Port Vila, Vanuatu, Republic of Vanuatu.
Email: support@tmgm.com
Trademax Global Markets (SE) Limited, trading as TMGM, is authorized and regulated by the Financial Services Authority (FSA) of Seychelles, with license number SD224. The company is registered at Office No 13, Providence Estate ABIS Centre, Mahe, Seychelles.
Email: support@tmgm.com
Trademax Global Markets (International) Pty Ltd, trading as TMGM, is authorized and regulated by the Financial Services Commission, Mauritius (FSC) with license no. GB22201012, and registered at 33, Edith Cavell Street C/o IQ EQ Fund Services (Mauritius) Ltd Port Louis, 11324 Mauritius.
Email: support@tmgm.com
Copyright © TMGM. All rights reserved