

Trading
Explore a wide range of markets with competitive pricing, deep liquidity, and advanced trading tools.
Learn More 
Platform
Trade seamlessly with TMGM's powerful platform, built for speed, precision, and a superior trading experience.
Learn More Trading Platform
Academy
Learn the fundamentals of trading with beginner-friendly resources, including guides, webinars, and market insights.
Learn More News & Analysis
Get real-time market updates and expert analysis to stay ahead of trading opportunities
Learn More News & Analysis
About
Learn what sets TMGM apart — our global presence, regulatory strength, and commitment to innovation in trading.
Learn More Why Choose TMGM
Sponsorship
Are gold buyers staying cautious as the Fed weighs faster rate hikes?
- Gold finds stability following a steep sell-off, helped by the US Dollar’s pullback from a 19-month peak.
- The precious metal remains under pressure from expectations that the Fed will tighten policy more aggressively.
- With the RSI approaching oversold levels, technical signals continue to point to a bearish outlook.
Selling pressure on Gold (XAU/USD) has eased as the US Dollar (USD) pulls back following the metal’s 3.19% decline on Wednesday. Gold is trading flat on Thursday, having briefly fallen below $3,700 during early Asian trading to its lowest level since September 2025.

XAU/USD is hovering around $3,730 at the time of writing. Having earlier reached 103.96, a 19-month peak, the US Dollar Index (DXY) is trading near 103.60. The index measures the Greenback against a basket of six major currencies.
Growing expectations that the Federal Reserve (Fed) could accelerate interest rate increases to contain inflation are keeping buying interest in Gold muted. According to the CME FedWatch Tool, traders have fully factored in a December rate increase and anticipate additional hikes in the first quarter of 2027.
Released on Wednesday, the minutes of the Fed’s October meeting added weight to these expectations. If incoming inflation readings prove unfavourable, the Fed could consider raising rates by more than 25 basis points (bps) in December, a couple of officials said. A few participants noted that inflation might remain persistent for longer than anticipated, potentially requiring a move towards a more restrictive policy stance.
After increasing its policy rate by 25 basis points to 3.75%-4.00% in September, the Fed left it unchanged in October. Subsequent inflation readings have exceeded expectations. Together with hawkish comments from Fed officials over recent days, these data have reinforced expectations of additional tightening, prompting some traders to position for a bigger 50 bps increase in December.
With Treasury yields remaining elevated, this backdrop could restrict the US Dollar’s decline. Gold becomes costlier for holders of other currencies when the Dollar strengthens, while rising yields make the non-interest-bearing metal less attractive. For further indications of the policy outlook, traders are now watching US weekly jobless claims and comments from Fed officials.
Technical Analysis: Can Gold Find Support as Bearish Pressure Persists?
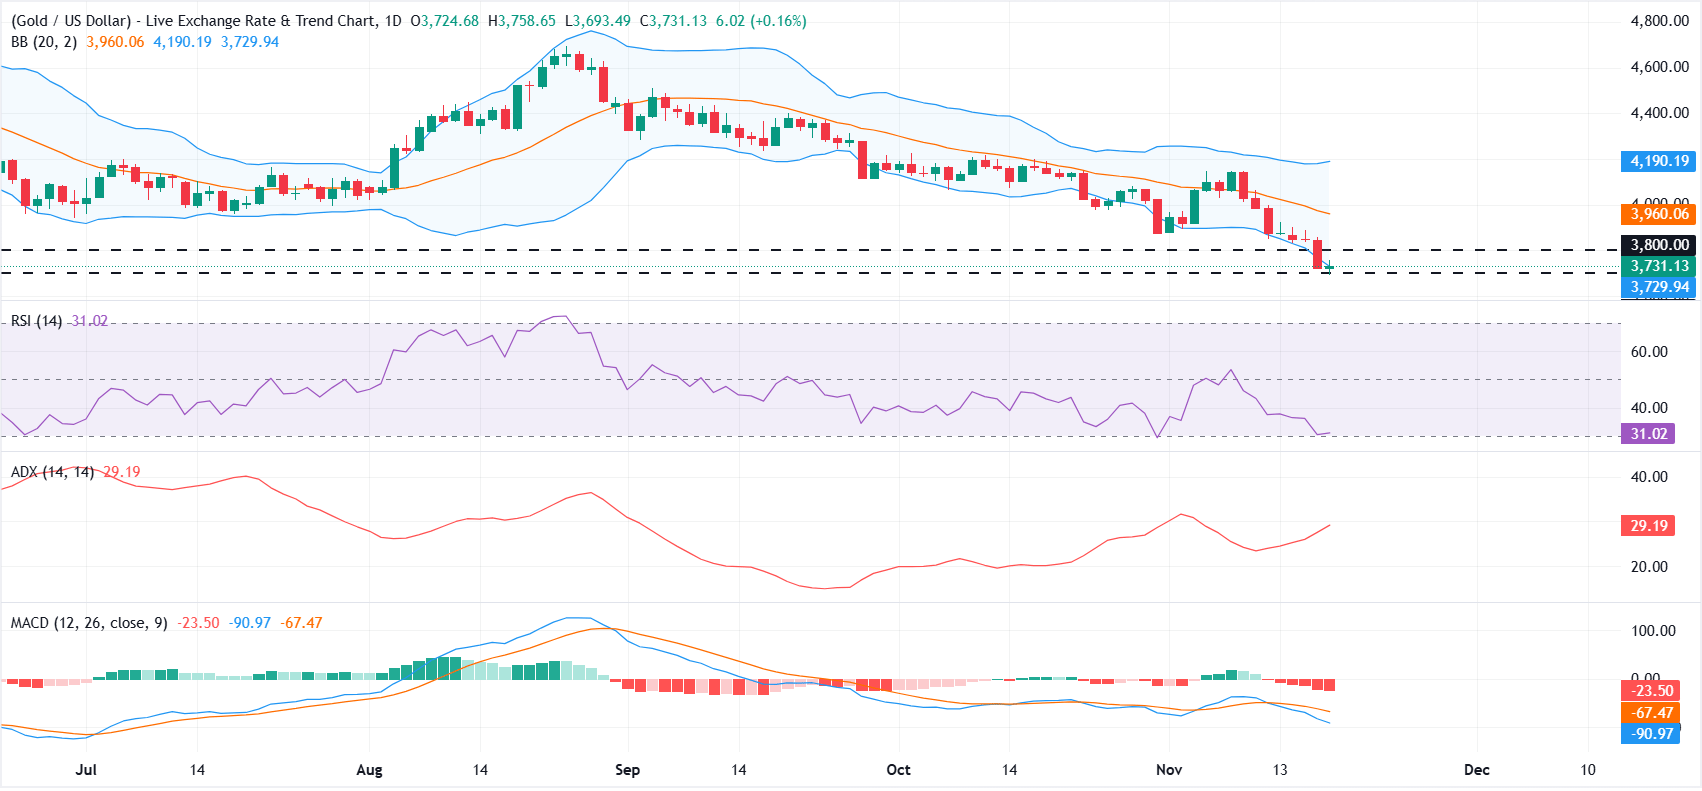
Holding below the Bollinger middle Simple Moving Average (SMA) at $3,960, XAU/USD continues to show a bearish near-term bias on the daily chart. Its proximity to the lower Bollinger band underscores the downward pressure. Meanwhile, the Relative Strength Index (RSI) reading of 31 is close to oversold territory, and the Average Directional Index (ADX) around 29 points to a strengthening trend. A firmly negative Moving Average Convergence Divergence (MACD) reading adds to the view that rallies are likely to attract selling as long as prices remain below the key volatility midline.
Any recovery would first face horizontal resistance at $3,800, followed by the Bollinger middle SMA at $3,960. Should a corrective rebound take shape, the upper band near $4,189 would provide a more distant ceiling. On a decline, the lower Bollinger band around $3,731 offers immediate support, with the horizontal floor at $3,700 next in focus. A decisive break below that level would pave the way for the prevailing bearish phase to extend.
(An AI tool helped prepare the technical analysis in this article. Learn more.)
How Is the US Dollar Performing Today?
The US Dollar recorded its strongest performance against the Japanese Yen today. The table below sets out the US Dollar’s (USD) percentage changes against the major currencies listed.
| USD | EUR | GBP | JPY | CAD | AUD | NZD | CHF | |
|---|---|---|---|---|---|---|---|---|
| USD | -0.28% | -0.16% | 0.38% | -0.15% | 0.05% | -0.66% | -0.14% | |
| EUR | 0.28% | 0.12% | 0.70% | 0.12% | 0.33% | -0.39% | 0.14% | |
| GBP | 0.16% | -0.12% | 0.57% | -0.00% | 0.21% | -0.50% | 0.01% | |
| JPY | -0.38% | -0.70% | -0.57% | -0.56% | -0.34% | -1.07% | -0.55% | |
| CAD | 0.15% | -0.12% | 0.00% | 0.56% | 0.21% | -0.51% | 0.02% | |
| AUD | -0.05% | -0.33% | -0.21% | 0.34% | -0.21% | -0.69% | -0.20% | |
| NZD | 0.66% | 0.39% | 0.50% | 1.07% | 0.51% | 0.69% | 0.55% | |
| CHF | 0.14% | -0.14% | -0.01% | 0.55% | -0.02% | 0.20% | -0.55% |
Percentage movements between the major currencies are displayed in the heat map. Select the base currency in the left-hand column and the quote currency in the top row. Selecting the US Dollar on the left and following that row across to the Japanese Yen, for instance, gives the percentage change for USD (base)/JPY (quote) in the corresponding cell.
POPULAR ARTICLES
1Are gold buyers staying cautious as the Fed weighs faster rate hikes?2AUD/USD Price Forecast: Buyers Step In Near Fresh YTD Low at 0.66103Crypto Market Pulse: Can Anthropic IPO optimism withstand ETF outflows and macro pressure?4Euro trims losses amid stronger risk appetite and still-low Oil prices5Gold: Below 3800 and under pressure – OCBC6Silver price today: FXStreet data show prices moving higher7Equities: Losing Streak Reaches Five Days as Selloff Continues – Deutsche Bank8Silver Price Forecast: Is XAG/USD stuck near $45.00 amid Fed rate hike bets?9US Dollar: Why does a hawkish regime support resilience? – TD Securities


Get Started!
Sign up and access the Global Markets in less than 3 minutes

Connect With Us









Contacts
Phone: +61 2 8036 8388
Fax: +61 2 8036 8388
Email: support@tmgm.com



The information provided on this website is of a general nature only and does not constitute personal financial advice. Before acting on any information on this website, you should consider the suitability of the information in relation to your objectives, financial situation and needs. Investing in CFDs and FX Margin Contracts carries significant risks and is not suitable for all investors. You may lose more than your initial deposit. You do not own, or have, any interest in the underlying asset. We recommend that you seek independent advice and ensure you fully understand the risks involved before trading. It is important that you read and consider the disclosure document before you acquire any product listed on the website. The information and advertisements offered on this website are not intended for use by any person in any country or jurisdiction where such use would be contrary to local laws and regulations. The Products and Services offered on this website are not intended for residents of the United States, Malaysia and Thailand.
TMGM is authorized and regulated in various jurisdictions.
Trademax Australia Limited, trading as TMGM, is regulated by the Australian Securities and Investments Commission (ASIC), AFSL no. 436416 and is located at Level 28, One International Tower, 100 Barangaroo Avenue, 2000 Sydney, NSW Australia.
Email: support@tmgm.com.au
Trademax Global Limited, trading as TMGM, is authorized and regulated by the Vanuatu Financial Services Commission (VFSC), registration number 40356 and registered at 1276, Kumul Highway, Port Vila, Vanuatu, Republic of Vanuatu.
Email: support@tmgm.com
Trademax Global Markets (SE) Limited, trading as TMGM, is authorized and regulated by the Financial Services Authority (FSA) of Seychelles, with license number SD224. The company is registered at Office No 13, Providence Estate ABIS Centre, Mahe, Seychelles.
Email: support@tmgm.com
Trademax Global Markets (International) Pty Ltd, trading as TMGM, is authorized and regulated by the Financial Services Commission, Mauritius (FSC) with license no. GB22201012, and registered at 33, Edith Cavell Street C/o IQ EQ Fund Services (Mauritius) Ltd Port Louis, 11324 Mauritius.
Email: support@tmgm.com
Copyright © TMGM. All rights reserved