

Trading
Explore a wide range of markets with competitive pricing, deep liquidity, and advanced trading tools.
Learn More 
Platform
Trade seamlessly with TMGM's powerful platform, built for speed, precision, and a superior trading experience.
Learn More Trading Platform
Academy
Learn the fundamentals of trading with beginner-friendly resources, including guides, webinars, and market insights.
Learn More News & Analysis
Get real-time market updates and expert analysis to stay ahead of trading opportunities
Learn More News & Analysis
About
Learn what sets TMGM apart — our global presence, regulatory strength, and commitment to innovation in trading.
Learn More Why Choose TMGM
Sponsorship
Is gold heading for its steepest weekly fall since March as Fed rate-hike bets and forced selling weigh?
- Volatility triggered by a global equity sell-off draws some buying interest in Gold at lower levels.
- Gold heads for its weakest week in eight months as expectations for Fed policy turn increasingly hawkish.
- The technical outlook stays bearish: RSI is oversold, while MACD points to persistent selling pressure.
Volatility ripples through financial markets on Friday as global equities sell off, with Anthropic’s record IPO offering little relief from concerns over stretched AI valuations. Against this backdrop, Gold (XAU/USD) finds some buyers at lower levels after touching its lowest point since September 2025 during Asian trading. At the time of writing, XAU/USD is trading near $3,586, having recovered from an intraday trough of $3,514.

Pressure on equities appears to be prompting some investors to liquidate bullion holdings to generate cash and offset losses elsewhere. At the same time, the stock-market rout is encouraging flows into government bonds, pulling yields down. Having fallen 13 basis points this week, the benchmark 10-year US Treasury yield has moved below 5%. Together with a modest retreat in the US Dollar (USD), lower yields appear to be allowing Gold some scope to rebound.
The recovery has not changed Gold’s weekly trajectory: it is still heading for its worst week in eight months, with traders preparing for a more aggressive Federal Reserve (Fed) tightening cycle. According to the CME FedWatch Tool, markets have almost fully priced in a 25-bps rate increase in December. They also anticipate further rate rises into 2027 as a growing number of Fed officials express concerns over persistent inflation.
With inflation still too high, the central bank will have to raise rates again, Philadelphia Fed President Anna Paulson said on Thursday. Separately, Chicago Fed President Austan Goolsbee said there was little evidence of inflation returning to 2% without intervention.
Higher prospective interest rates reduce the appeal of holding Gold, which offers no interest income. Expectations of a hawkish Fed also provide broad support to the US Dollar. The US Dollar Index (DXY) is trading near 103.87, not far from a 19-month high. For buyers paying in other currencies, a stronger Greenback raises the cost of bullion.
For further indications of the rate outlook later in the day, traders will turn to Fed Governor Lisa Cook’s remarks and the final University of Michigan consumer sentiment report, including its measures of inflation expectations.
Technical Analysis: Where Are Gold’s Key Support and Resistance Levels?
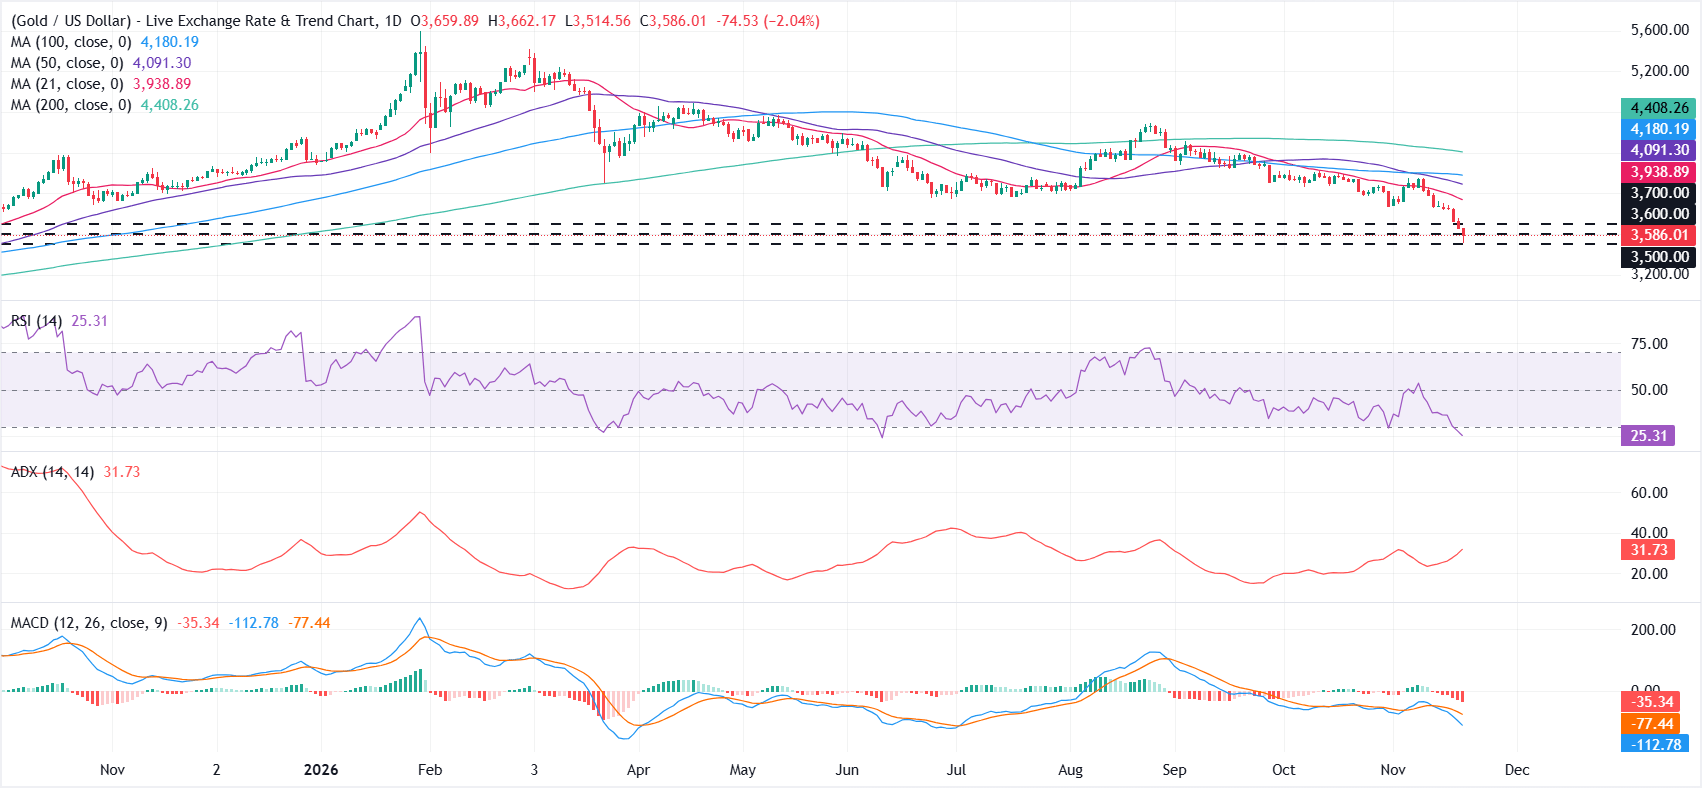
The daily chart shows XAU/USD at $3,586.84, with the bearish phase continuing as spot gold holds well beneath its 21-, 50-, 100-, and 200-day simple moving averages (SMAs). These averages form successive overhead barriers, pointing to a persistent downside bias. Momentum indicators support that weak setup: the Relative Strength Index (RSI) has dropped into oversold territory near 25, and the Moving Average Convergence Divergence (MACD) remains deeply negative. Meanwhile, the Average Directional Index (ADX) is rising above 30, suggesting that the existing downtrend is strengthening rather than merely undergoing a correction.
Any recovery first faces resistance at $3,600 and then $3,700, with a more significant supply zone starting near the 21-day SMA at around $3,938. Further up, the 50-day SMA at $4,091, followed by the longer-term 100-day and 200-day SMAs at $4,180 and $4,408, respectively, creates a cluster of barriers to a rebound. The next important downside support is the horizontal $3,500 level. Sellers are nevertheless likely to retain control for as long as the price remains below the multiple moving-average resistance levels overhead.
(The technical analysis of this story was written with the help of an AI tool. Know more.)
POPULAR ARTICLES
1Is gold heading for its steepest weekly fall since March as Fed rate-hike bets and forced selling weigh?2Swiss Franc: Could Further Weakness Against US Dollar Extend Towards 0.8485? - UOB3South African Rand: Why are politics and metals overshadowing a hawkish SARB? – Commerzbank4Ripple Price Forecast: Why Has XRP Failed to Reclaim $1.00 Despite a Supply Shortage on Binance?5Mexican Peso: How is Fed hawkishness driving weakness against US Dollar? – Societe Generale6Could energy inflation spread across the economy? ECB's Santos Pereira highlights the risk7AI sell-off weighs on US Dollar strength as Swiss Franc trims losses8Crypto Today: Could Bitcoin fall below $61K as Ethereum retreats and XRP remains range-bound?9British Pound: Will EU deals bring only limited gains against Euro? - ING

Get Started!
Sign up and access the Global Markets in less than 3 minutes

Connect With Us









Contacts
Phone: +61 2 8036 8388
Fax: +61 2 8036 8388
Email: support@tmgm.com



The information provided on this website is of a general nature only and does not constitute personal financial advice. Before acting on any information on this website, you should consider the suitability of the information in relation to your objectives, financial situation and needs. Investing in CFDs and FX Margin Contracts carries significant risks and is not suitable for all investors. You may lose more than your initial deposit. You do not own, or have, any interest in the underlying asset. We recommend that you seek independent advice and ensure you fully understand the risks involved before trading. It is important that you read and consider the disclosure document before you acquire any product listed on the website. The information and advertisements offered on this website are not intended for use by any person in any country or jurisdiction where such use would be contrary to local laws and regulations. The Products and Services offered on this website are not intended for residents of the United States, Malaysia and Thailand.
TMGM is authorized and regulated in various jurisdictions.
Trademax Australia Limited, trading as TMGM, is regulated by the Australian Securities and Investments Commission (ASIC), AFSL no. 436416 and is located at Level 28, One International Tower, 100 Barangaroo Avenue, 2000 Sydney, NSW Australia.
Email: support@tmgm.com.au
Trademax Global Limited, trading as TMGM, is authorized and regulated by the Vanuatu Financial Services Commission (VFSC), registration number 40356 and registered at 1276, Kumul Highway, Port Vila, Vanuatu, Republic of Vanuatu.
Email: support@tmgm.com
Trademax Global Markets (SE) Limited, trading as TMGM, is authorized and regulated by the Financial Services Authority (FSA) of Seychelles, with license number SD224. The company is registered at Office No 13, Providence Estate ABIS Centre, Mahe, Seychelles.
Email: support@tmgm.com
Trademax Global Markets (International) Pty Ltd, trading as TMGM, is authorized and regulated by the Financial Services Commission, Mauritius (FSC) with license no. GB22201012, and registered at 33, Edith Cavell Street C/o IQ EQ Fund Services (Mauritius) Ltd Port Louis, 11324 Mauritius.
Email: support@tmgm.com
Copyright © TMGM. All rights reserved