

Trading
Explore a wide range of markets with competitive pricing, deep liquidity, and advanced trading tools.
Learn More 
Platform
Trade seamlessly with TMGM's powerful platform, built for speed, precision, and a superior trading experience.
Learn More Trading Platform
Academy
Learn the fundamentals of trading with beginner-friendly resources, including guides, webinars, and market insights.
Learn More News & Analysis
Get real-time market updates and expert analysis to stay ahead of trading opportunities
Learn More News & Analysis
About
Learn what sets TMGM apart — our global presence, regulatory strength, and commitment to innovation in trading.
Learn More Why Choose TMGM
Sponsorship
Top 3 Price Predictions: Can Bitcoin, Ethereum, Ripple withstand renewed selling as key technical barriers and regulatory fears weigh on sentiment?
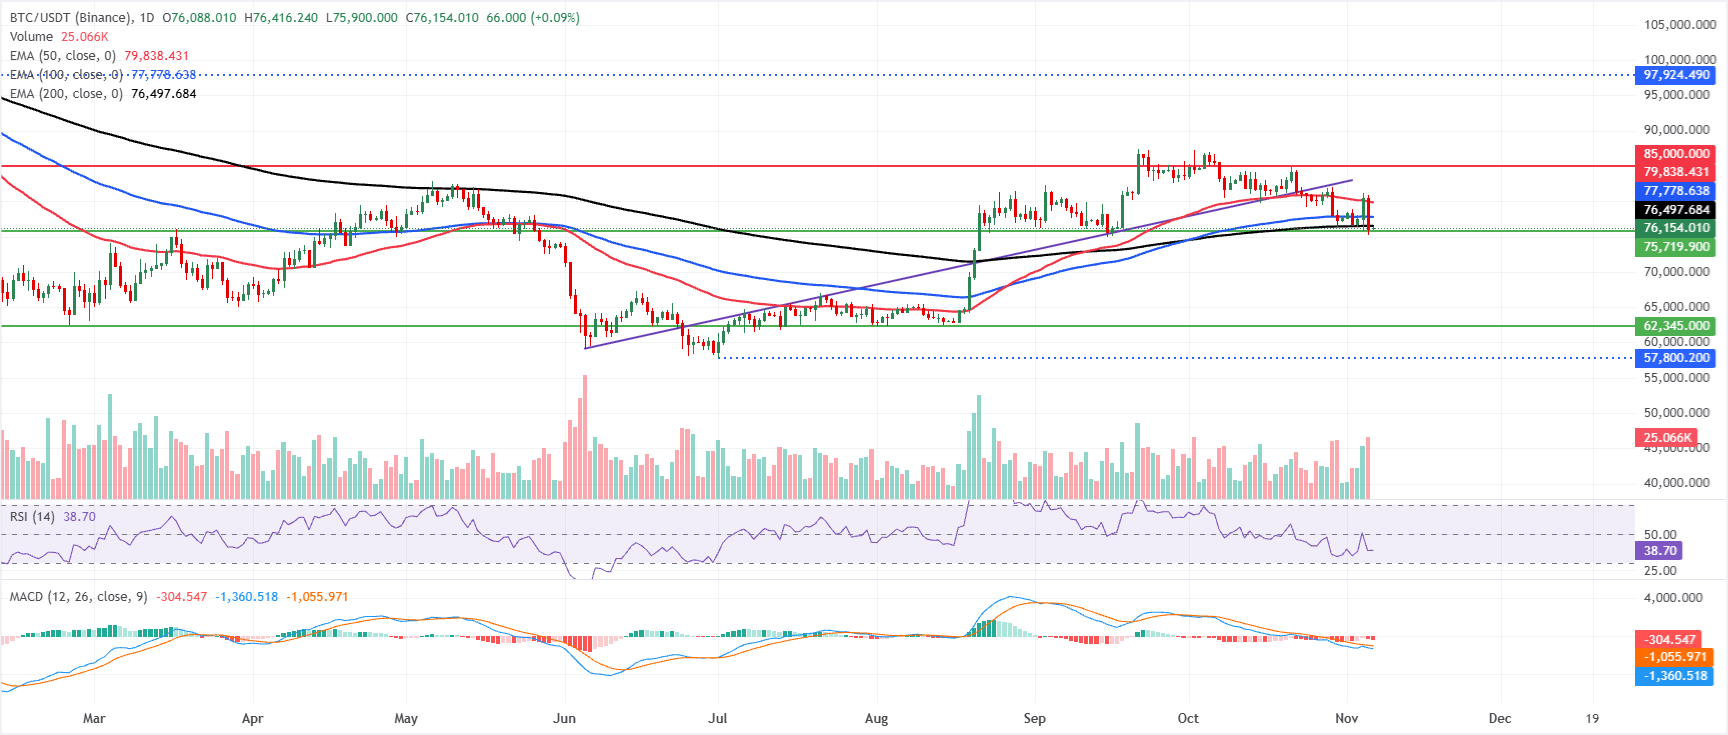
- A bearish bias persists for Bitcoin, which trades at $76,154 on Friday following a close below the 200-day EMA around $76,497.
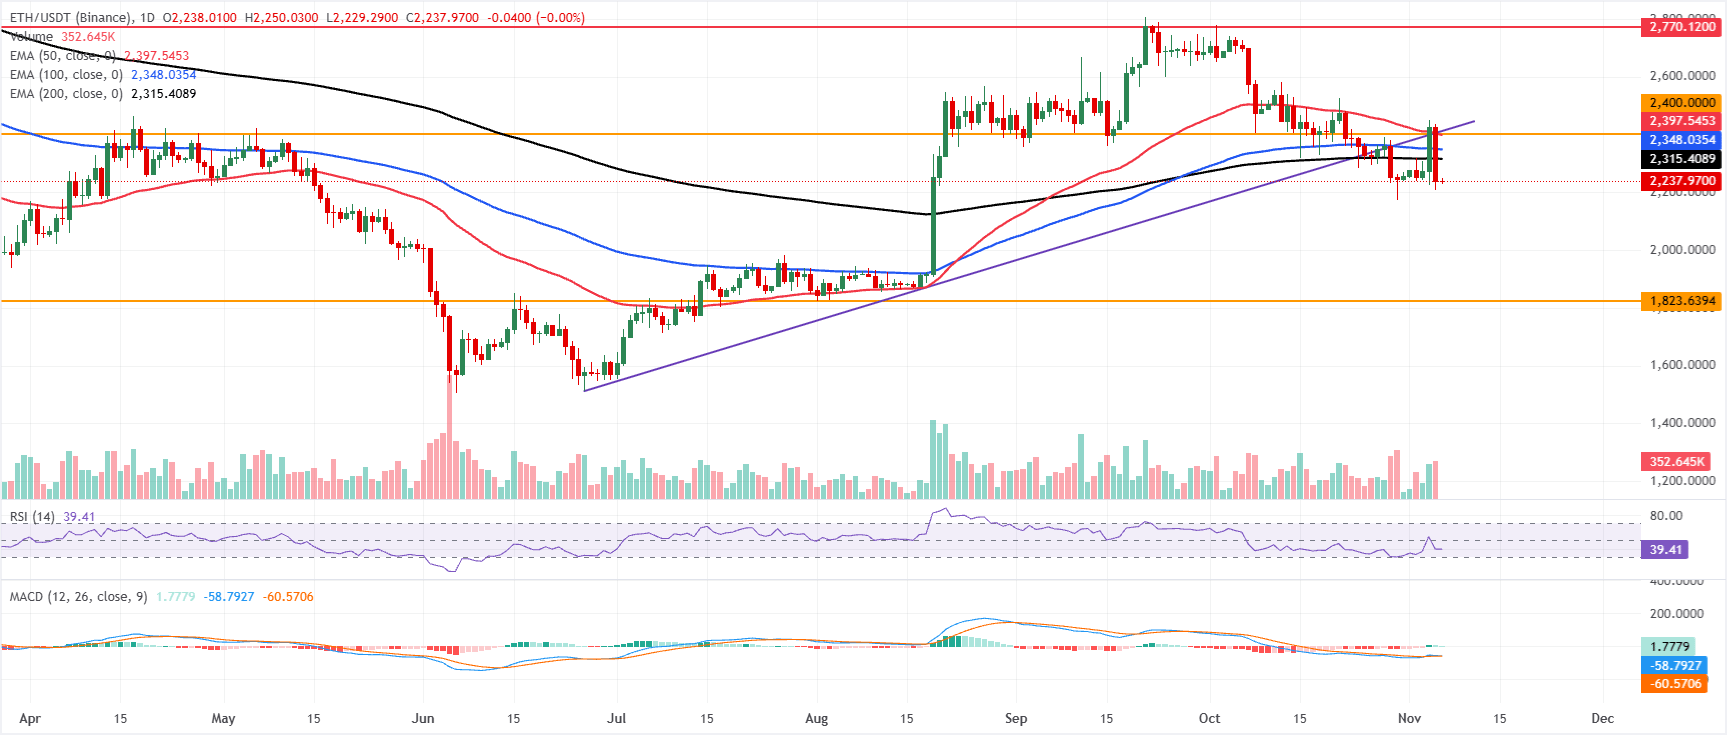
- Downside risks remain elevated for Ethereum as it trades at $2,237 following a rejection at the previously breached ascending trendline.
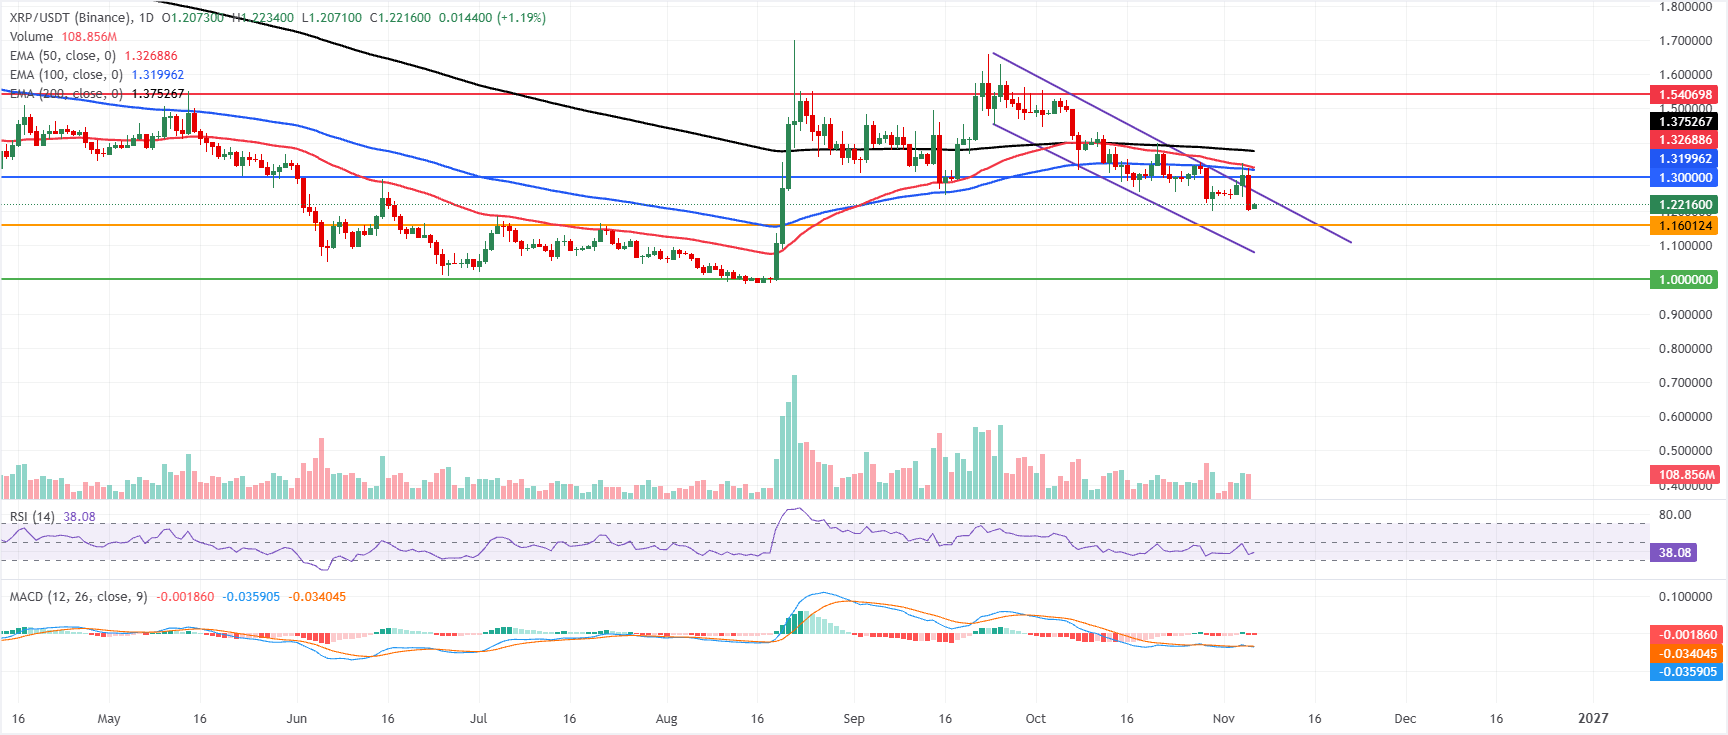
- Key EMA resistance continues to cap XRP, which trades at $1.22 after failing to secure a close above it.
Fresh selling pressure has weighed on Bitcoin (BTC), Ethereum (ETH) and Ripple (XRP) in the second half of this week. The weakness comes amid concerns that Democrats' control of both chambers of the US Congress could bring stricter regulations for crypto and Artificial Intelligence (AI).

Key resistance zones continue to hold back these top three cryptocurrencies. BTC has closed beneath its 200-day Exponential Moving Average (EMA), while rejections at important resistance levels for ETH and XRP also point to the possibility of a deeper correction.
Could Bitcoin extend losses after closing below the 200-day EMA?
The near-term outlook for Bitcoin remains bearish as its correction continues beneath key Exponential Moving Averages (EMAs), with the price at $76,157 on Friday.
Above BTC, the 200-day EMA at $76,497, the 100-day EMA at $77,778 and the 50-day EMA at $79,837 form successive barriers. This close grouping of medium- and longer-term trend resistance suggests limited room for an advance.
Momentum indicators reinforce the weak tone. The Relative Strength Index (RSI) is hovering in the upper-30s, while a negative Moving Average Convergence Divergence (MACD) suggests that renewed selling could undermine rallies.
Any recovery would first encounter the 200-day EMA near $76,497, before facing the 100-day EMA at $77,778. Beyond these levels, the 50-day EMA at $79,837 marks another supply barrier, followed by horizontal resistance around $85,000. The immediate data set offers no clearly established support levels, so a further decline would likely look for a fresh floor below the spot price. Recovery attempts, meanwhile, are likely to face difficulty while BTC remains below this cluster of moving averages.
Could Ethereum face a deeper correction?
A bearish near-term bias continues to weigh on Ethereum as its corrective phase keeps the price below major EMAs. ETH trades at $2,237 on Friday, beneath the 200-day EMA at $2,315 and the 100-day EMA at $2,348. With the 50-day EMA higher at $2,397, successive layers of trend resistance appear to be limiting rallies.
Weak momentum is reflected in an RSI near 39. Although the MACD has turned marginally positive, attempts to move higher still appear to be contending with prevailing overhead supply.
For a recovery, the first hurdle is the 200-day EMA at $2,315, ahead of the 100-day EMA at $2,348. The next resistance cluster comprises the 50-day EMA at $2,397 and a horizontal barrier at $2,400, followed by the broken rising trendline near $2,412. A sustained break above this group of levels would soften the current bearish bias and clear a path towards the next key obstacle at $2,770.
Immediate support on a decline lies broadly around the current price zone. A stronger structural floor stands at $1,823; a breach there would leave Ethereum exposed to further losses within the broader correction.
Are XRP bears still in control?
The near-term bias for XRP remains bearish, with Friday's price of $1.221 below the cluster of 50-day, 100-day and 200-day Exponential Moving Averages (EMAs) between $1.320 and $1.375.
The upper boundary of the falling channel, currently projected near $1.257, has also proved beyond XRP's reach. Momentum offers little encouragement: the RSI is around 38 and the MACD indicator is marginally negative near the zero line. Together, these readings suggest restricted upside rather than a convincing recovery.
A move higher would initially face the upper channel trendline around $1.257, followed by horizontal resistance at $1.300. The 100-day EMA at $1.320 and the 50-day EMA at $1.326 create a stronger overhead supply zone. Beyond that, medium-term obstacles lie at the 200-day EMA of $1.375 and the subsequent horizontal levels of $1.540 and $1.900.
On a decline, the first support level is the horizontal line at $1.160, followed by a firmer floor at $1.000. While XRP stays below the moving-average cluster, rebounds towards resistance are likely to be regarded as corrective moves within the broader bearish trend.
(The technical analysis of this story was written with the help of an AI tool. Know more.)
What drives cryptocurrency prices? FAQs
Demand and adoption among market participants are influenced by token launches. When an asset is listed on a crypto exchange, its liquidity deepens and more participants join its network. These developments are generally positive for a digital asset's price.
During a hack, an attacker uses exploits, bugs or other methods to seize a large quantity of an asset from a DeFi bridge, an exchange's hot wallet or another crypto platform. The stolen tokens are then moved out of exchange platforms, with the eventual aim of selling them or swapping them for other cryptocurrencies or stablecoins. Widespread panic often accompanies such incidents, triggering a sell-off in the affected assets.
The effect of macroeconomic events on crypto assets comes mainly through their direct influence on the US Dollar. Interest-rate decisions by the US Federal Reserve are one such example. Higher interest rates usually weigh on Bitcoin and altcoin prices, while lower rates tend to have the opposite effect. A decline in the US Dollar index makes risk assets and the associated trading leverage cheaper, thereby pushing crypto prices higher.
By cutting miners' block rewards in half, halvings restrict an asset's supply and are therefore generally viewed as bullish events. If demand remains unchanged as supply falls, the asset's price rises.
POPULAR ARTICLES
1Safe-haven demand keeps Swiss Franc steady2US Dollar Index (DXY) reaches 101.80 as recovery gathers pace ahead of US NFP report3AUD/JPY Price Forecast: Losses deepen below 109.00 as bearish bias holds under 100-day SMA4India Gold price today: FXStreet data shows a decline in Gold prices5Why is gold edging lower as recovering bond yields and Fed hike bets bolster USD ahead of US NFP?6Top 3 Price Predictions: Can Bitcoin, Ethereum, Ripple withstand renewed selling as key technical barriers and regulatory fears weigh on sentiment?7EUR/JPY Price Forecast: Pair hovers near 176.50 following a drop below the nine-day EMA8Zcash Price Forecast: Can the NU7 upgrade drive a breakout as ZEC bucks the crypto market sell-off?9Why is the Australian Dollar falling on a dovish RBA outlook and a firmer US Dollar?


Get Started!
Sign up and access the Global Markets in less than 3 minutes

Connect With Us









Contacts
Phone: +61 2 8036 8388
Fax: +61 2 8036 8388
Email: support@tmgm.com



The information provided on this website is of a general nature only and does not constitute personal financial advice. Before acting on any information on this website, you should consider the suitability of the information in relation to your objectives, financial situation and needs. Investing in CFDs and FX Margin Contracts carries significant risks and is not suitable for all investors. You may lose more than your initial deposit. You do not own, or have, any interest in the underlying asset. We recommend that you seek independent advice and ensure you fully understand the risks involved before trading. It is important that you read and consider the disclosure document before you acquire any product listed on the website. The information and advertisements offered on this website are not intended for use by any person in any country or jurisdiction where such use would be contrary to local laws and regulations. The Products and Services offered on this website are not intended for residents of the United States, Malaysia and Thailand.
TMGM is authorized and regulated in various jurisdictions.
Trademax Australia Limited, trading as TMGM, is regulated by the Australian Securities and Investments Commission (ASIC), AFSL no. 436416 and is located at Level 28, One International Tower, 100 Barangaroo Avenue, 2000 Sydney, NSW Australia.
Email: support@tmgm.com.au
Trademax Global Limited, trading as TMGM, is authorized and regulated by the Vanuatu Financial Services Commission (VFSC), registration number 40356 and registered at 1276, Kumul Highway, Port Vila, Vanuatu, Republic of Vanuatu.
Email: support@tmgm.com
Trademax Global Markets (SE) Limited, trading as TMGM, is authorized and regulated by the Financial Services Authority (FSA) of Seychelles, with license number SD224. The company is registered at Office No 13, Providence Estate ABIS Centre, Mahe, Seychelles.
Email: support@tmgm.com
Trademax Global Markets (International) Pty Ltd, trading as TMGM, is authorized and regulated by the Financial Services Commission, Mauritius (FSC) with license no. GB22201012, and registered at 33, Edith Cavell Street C/o IQ EQ Fund Services (Mauritius) Ltd Port Louis, 11324 Mauritius.
Email: support@tmgm.com
Copyright © TMGM. All rights reserved