

Trading
Explore a wide range of markets with competitive pricing, deep liquidity, and advanced trading tools.
Learn More 
Platform
Trade seamlessly with TMGM's powerful platform, built for speed, precision, and a superior trading experience.
Learn More Trading Platform
Academy
Learn the fundamentals of trading with beginner-friendly resources, including guides, webinars, and market insights.
Learn More News & Analysis
Get real-time market updates and expert analysis to stay ahead of trading opportunities
Learn More News & Analysis
About
Learn what sets TMGM apart — our global presence, regulatory strength, and commitment to innovation in trading.
Learn More Why Choose TMGM
Sponsorship
Will US S&P Global PMI point to the expected slowdown in October business activity?
- Expansion is expected to remain firmly intact across US business activity in October, despite a modest loss of momentum.
- After September's robust readings, forecasts suggest softer manufacturing and services survey results.
- If business activity exceeds expectations and strengthens the case for further Fed rate hikes, the US Dollar could gain support.
With next week's Federal Reserve (Fed) monetary policy meeting approaching, market attention turns to the United States (US) S&P Global preliminary Purchasing Managers Indices (PMIs) for October, due on Friday. The figures will offer a fresh assessment of conditions in the world's largest economy.

Private-sector business activity is tracked through the report's Manufacturing PMI, Services PMI and Composite PMI. A reading above 50 denotes expansion; one below that mark indicates contraction.
Resilient US economic activity, evident in recent data despite sustained inflationary pressures and high borrowing costs, forms the backdrop to the October surveys. Investors will scrutinise the readings for any loss of growth momentum or renewed price pressures that could shape the Fed's monetary policy outlook and movements in the US Dollar (USD).
Will October's S&P Global PMIs signal a modest slowdown?
A modest easing in US private-sector growth is the market's expectation for October, after September's particularly robust results. Forecasts put the S&P Global Manufacturing PMI at 55.6, slightly below September's 55.9, and the Services PMI at 57.9, down from 58.8. September's Composite PMI, meanwhile, registered 58.4, underscoring strong growth throughout the US private sector.
Even with some moderation expected in both sectors, the projected readings sit well above 50. They therefore point to continued expansion at a healthy pace in the US economy.
Persistent price pressures give this release added significance. Inflation has exceeded expectations in recent US data, while Retail Sales and labour market indicators still point to resilient domestic demand.
Following September's 25-basis-point (bps) increase, the Fed is widely expected to hold interest rates steady at its meeting on 28 October. Nevertheless, the CME FedWatch tool shows that investors have fully priced in a further rate hike in December.
How could October's flash US S&P Global PMIs move EUR/USD, and when are they due?
Friday at 13:45 GMT is the scheduled release time for October's S&P Global Manufacturing, Services and Composite PMIs. As investors adjust positions before the Fed's 28 October monetary policy decision, the data could spark volatility in both the US Dollar and EUR/USD.
Expectations of more Fed rate hikes over the coming months could strengthen if the report beats forecasts. That outcome would likely underpin US Treasury yields and the US Dollar, with EUR/USD potentially coming under pressure.
A more pronounced slowdown than forecast, especially in services, could instead prompt concerns over whether US economic growth can be sustained. If softer PMI readings lead investors to reconsider the prospects of further monetary tightening, the Greenback could face downward pressure while EUR/USD gains support.
A broadly in-line outcome, however, could elicit only a relatively muted market response, as forecasts already place both manufacturing and services activity firmly in expansion territory.
Investors have already largely factored in another December Fed rate hike. Their focus on Friday will therefore be whether the PMIs validate the US economy's resilience or indicate a slowdown. An upside surprise could bolster expectations of further monetary tightening; disappointing figures, by contrast, could raise questions about the strength of growth and put pressure on the US Dollar.
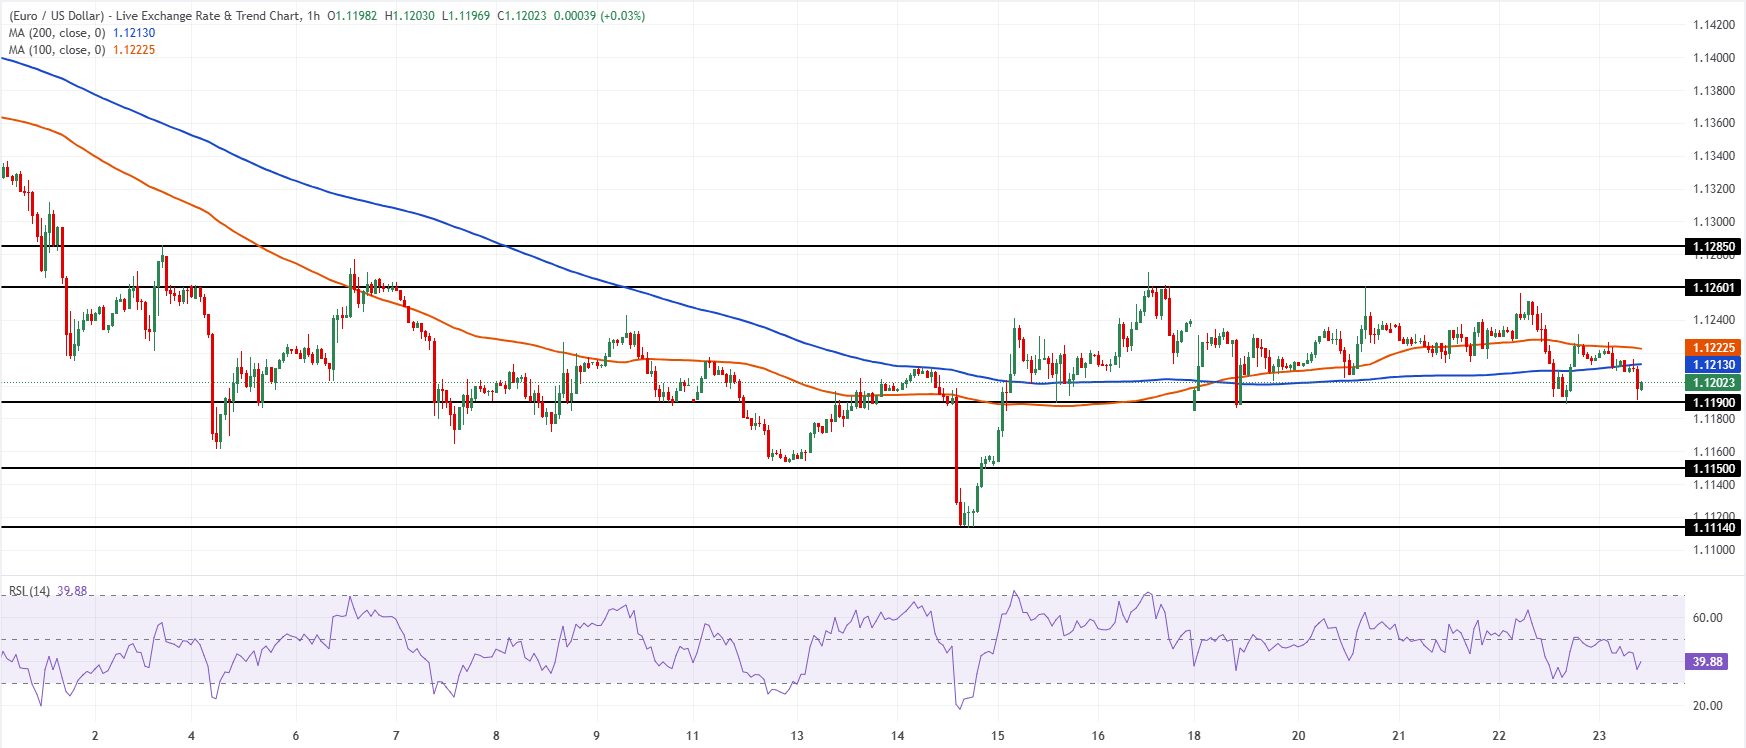
Trading beneath the 100-period Simple Moving Average (SMA) at 1.1223 and the 200-period SMA at 1.1213, EUR/USD retains a mildly bearish bias on the one-hour chart. The pair is edging along just above nearby price support. With the Relative Strength Index (14) hovering around 40, the signal is one of fading bullish momentum rather than outright oversold conditions. Downside risks therefore persist as long as these moving averages restrict gains.
The horizontal area near 1.1190 provides the first support, with further downside cushions at 1.1150 and 1.1114. Any advance would first encounter the 200-period SMA at 1.1213, then the 100-period SMA at 1.1223. Beyond those levels, the pair would need to regain the more substantial barriers at 1.1260 and 1.1285 to temper the prevailing bearish bias.
(The technical analysis of this story was written with the help of an AI tool. Know more.)
US Dollar: Frequently Asked Questions
Alongside its status as the official currency of the United States of America, the US Dollar (USD) serves as the ‘de facto’ currency in a significant number of other countries, circulating together with local banknotes. No other currency is traded as heavily worldwide: according to 2022 data, it accounts for over 88% of global foreign exchange turnover, equivalent to average daily transactions of $6.6 trillion. The USD replaced the British Pound as the world's reserve currency after the Second World War. Gold backed the US Dollar for most of its history, until the Bretton Woods Agreement in 1971 brought an end to the Gold Standard.
Monetary policy, set by the Federal Reserve (Fed), is the single most influential driver of the US Dollar's value. Price stability, meaning control over inflation, and full employment are the Fed's two mandates. Adjusting interest rates is its main means of pursuing these objectives. If prices climb too rapidly and inflation exceeds its 2% target, the Fed will increase rates, supporting the USD's value. Conversely, inflation below 2% or an excessively high Unemployment Rate may prompt the Fed to cut interest rates, putting pressure on the Greenback.
When conditions become extreme, the Federal Reserve can print additional Dollars and introduce quantitative easing (QE). Through QE, the Fed sharply expands the supply of credit within a stalled financial system. This unconventional policy is used when credit dries up because banks, fearing counterparty default, refuse to lend to one another. It is a last-resort option when interest rate cuts alone are unlikely to deliver the required outcome. During the Great Financial Crisis in 2008, QE was the Fed's preferred response to the credit crunch. Under the process, the Fed prints additional Dollars to purchase US government bonds, mainly from financial institutions. The US Dollar typically weakens as a result of QE.
By reversing this process, quantitative tightening (QT) sees the Federal Reserve halt bond purchases from financial institutions and refrain from reinvesting the principal of its maturing bond holdings in new purchases. The US Dollar usually benefits from QT.
Economic Data Indicator
S&P Global Composite PMI: What does it measure?
Published monthly, the S&P Global Composite Purchasing Managers Index (PMI) provides an early gauge of US private-sector business activity across manufacturing and services. Surveys of senior executives form the basis of the data. Responses are weighted by company size and by the share of total manufacturing or services output attributable to the company's sub-sector. By reporting any change in the current month relative to the previous month, the responses can foreshadow shifts in official data series, including Gross Domestic Product (GDP), industrial production, employment and inflation. On the index's 0 to 100 scale, 50.0 denotes no month-on-month change. Above 50, the reading points to broad expansion in the private economy, a bullish signal for the US Dollar (USD). Below 50, it indicates a general decline in activity and is regarded as bearish for USD.
Explore further.Upcoming release: Fri 23 Oct 2026 13:45 (Prel)
Publication frequency: Monthly
Consensus estimate: -
Previous reading: 58.4
Data source: S&P Global
POPULAR ARTICLES
1European Central Bank: Will one further hike be followed by a prolonged rate hold? – Commerzbank2US economic strength eclipses the Eurozone as Euro retreats towards 1.12003Bank of Canada: RBC highlights focus on pre-emptive tightening4Federal Reserve: December hike odds rise after October hold - TD Securities5Euro: How are fiscal risks limiting gains against the US Dollar? – BBH6Fed-BoC policy divergence takes centre stage as Canadian Dollar adds to winning streak7Indian Rupee: Downside Risk Against US Dollar Calls for Caution – OCBC8Will US S&P Global PMI point to the expected slowdown in October business activity?9Mexican Peso: Banxico’s lag behind Fed keeps currency under pressure – ING
LIVE QUOTES

ALL ABOUT FOREX
What Is a Stop Loss, How Does It Work and How Do You Set One?
Margin Call Meaning: What It Is, What Triggers It, and How to Avoid One
What Is an Islamic Account in Forex?
Best Indicators for Forex Trading and How to Use Them
The Top 10 Most Traded Currency Pairs in the World
What are the Major Forex Pairs? 7 Major Currency Pairs in the World
5 Best Forex Trading Apps In India In 2026
Top 15 Weakest Currencies in the World
Best Time to Trade Forex
Get Started!
Sign up and access the Global Markets in less than 3 minutes

Connect With Us









Contacts
Phone: +61 2 8036 8388
Fax: +61 2 8036 8388
Email: support@tmgm.com



The information provided on this website is of a general nature only and does not constitute personal financial advice. Before acting on any information on this website, you should consider the suitability of the information in relation to your objectives, financial situation and needs. Investing in CFDs and FX Margin Contracts carries significant risks and is not suitable for all investors. You may lose more than your initial deposit. You do not own, or have, any interest in the underlying asset. We recommend that you seek independent advice and ensure you fully understand the risks involved before trading. It is important that you read and consider the disclosure document before you acquire any product listed on the website. The information and advertisements offered on this website are not intended for use by any person in any country or jurisdiction where such use would be contrary to local laws and regulations. The Products and Services offered on this website are not intended for residents of the United States, Malaysia and Thailand.
TMGM is authorized and regulated in various jurisdictions.
Trademax Australia Limited, trading as TMGM, is regulated by the Australian Securities and Investments Commission (ASIC), AFSL no. 436416 and is located at Level 28, One International Tower, 100 Barangaroo Avenue, 2000 Sydney, NSW Australia.
Email: support@tmgm.com.au
Trademax Global Limited, trading as TMGM, is authorized and regulated by the Vanuatu Financial Services Commission (VFSC), registration number 40356 and registered at 1276, Kumul Highway, Port Vila, Vanuatu, Republic of Vanuatu.
Email: support@tmgm.com
Trademax Global Markets (SE) Limited, trading as TMGM, is authorized and regulated by the Financial Services Authority (FSA) of Seychelles, with license number SD224. The company is registered at Office No 13, Providence Estate ABIS Centre, Mahe, Seychelles.
Email: support@tmgm.com
Trademax Global Markets (International) Pty Ltd, trading as TMGM, is authorized and regulated by the Financial Services Commission, Mauritius (FSC) with license no. GB22201012, and registered at 33, Edith Cavell Street C/o IQ EQ Fund Services (Mauritius) Ltd Port Louis, 11324 Mauritius.
Email: support@tmgm.com
Copyright © TMGM. All rights reserved