

Trading
Explore a wide range of markets with competitive pricing, deep liquidity, and advanced trading tools.
Learn More 
Platform
Trade seamlessly with TMGM's powerful platform, built for speed, precision, and a superior trading experience.
Learn More Trading Platform
Academy
Learn the fundamentals of trading with beginner-friendly resources, including guides, webinars, and market insights.
Learn More News & Analysis
Get real-time market updates and expert analysis to stay ahead of trading opportunities
Learn More News & Analysis
About
Learn what sets TMGM apart — our global presence, regulatory strength, and commitment to innovation in trading.
Learn More Why Choose TMGM
Sponsorship
WTI Price Forecast: Can key support at the 200-day SMA near $86.00 hold?
- WTI Oil remains slightly above $86, with losses approaching 15% so far this week.
- Hopes for a swift end to the war in Iran have strengthened following Trump's midterm election defeat.
- Technical indicators show prices barely holding on to crucial support at the 200-day SMA.
Oil is heading for its steepest weekly fall in months as hopes of an end to the war against Iran gather strength following the Democrats' landslide win in the US midterm elections. Down 14.25% so far this week, US benchmark West Texas Intermediate (WTI) is trading at $87.50 a barrel at the time of writing. Prices earlier tested support near $86.00 at the 200-day Simple Moving Average (SMA).

Wednesday's sharp sell-off in crude followed US President Donald Trump's decisive midterm election defeat. The result confirmed disapproval of Republican policies, particularly the war in Iran and the effects of the resulting energy shock.
In a Financial Times interview on Wednesday, Trump maintained that he did not regret the intervention in Iran, while stating that the US had no immediate plans to restart hostilities. Vice President JD Vance also identified the war in Iran as the principal reason for the election outcome on Wednesday, fuelling expectations that the government would seek a swift exit from the conflict.
Further declines in crude are being limited by persistent concerns over supply disruptions. On Thursday, Iran's Islamic Republican Guard Corps (IRGC) reported that two oil tankers had caught fire while trying to pass through the Strait of Hormuz along what they described as "an unauthorised route".
Technical Analysis: Can WTI Defend Crucial Support Near $86.00?
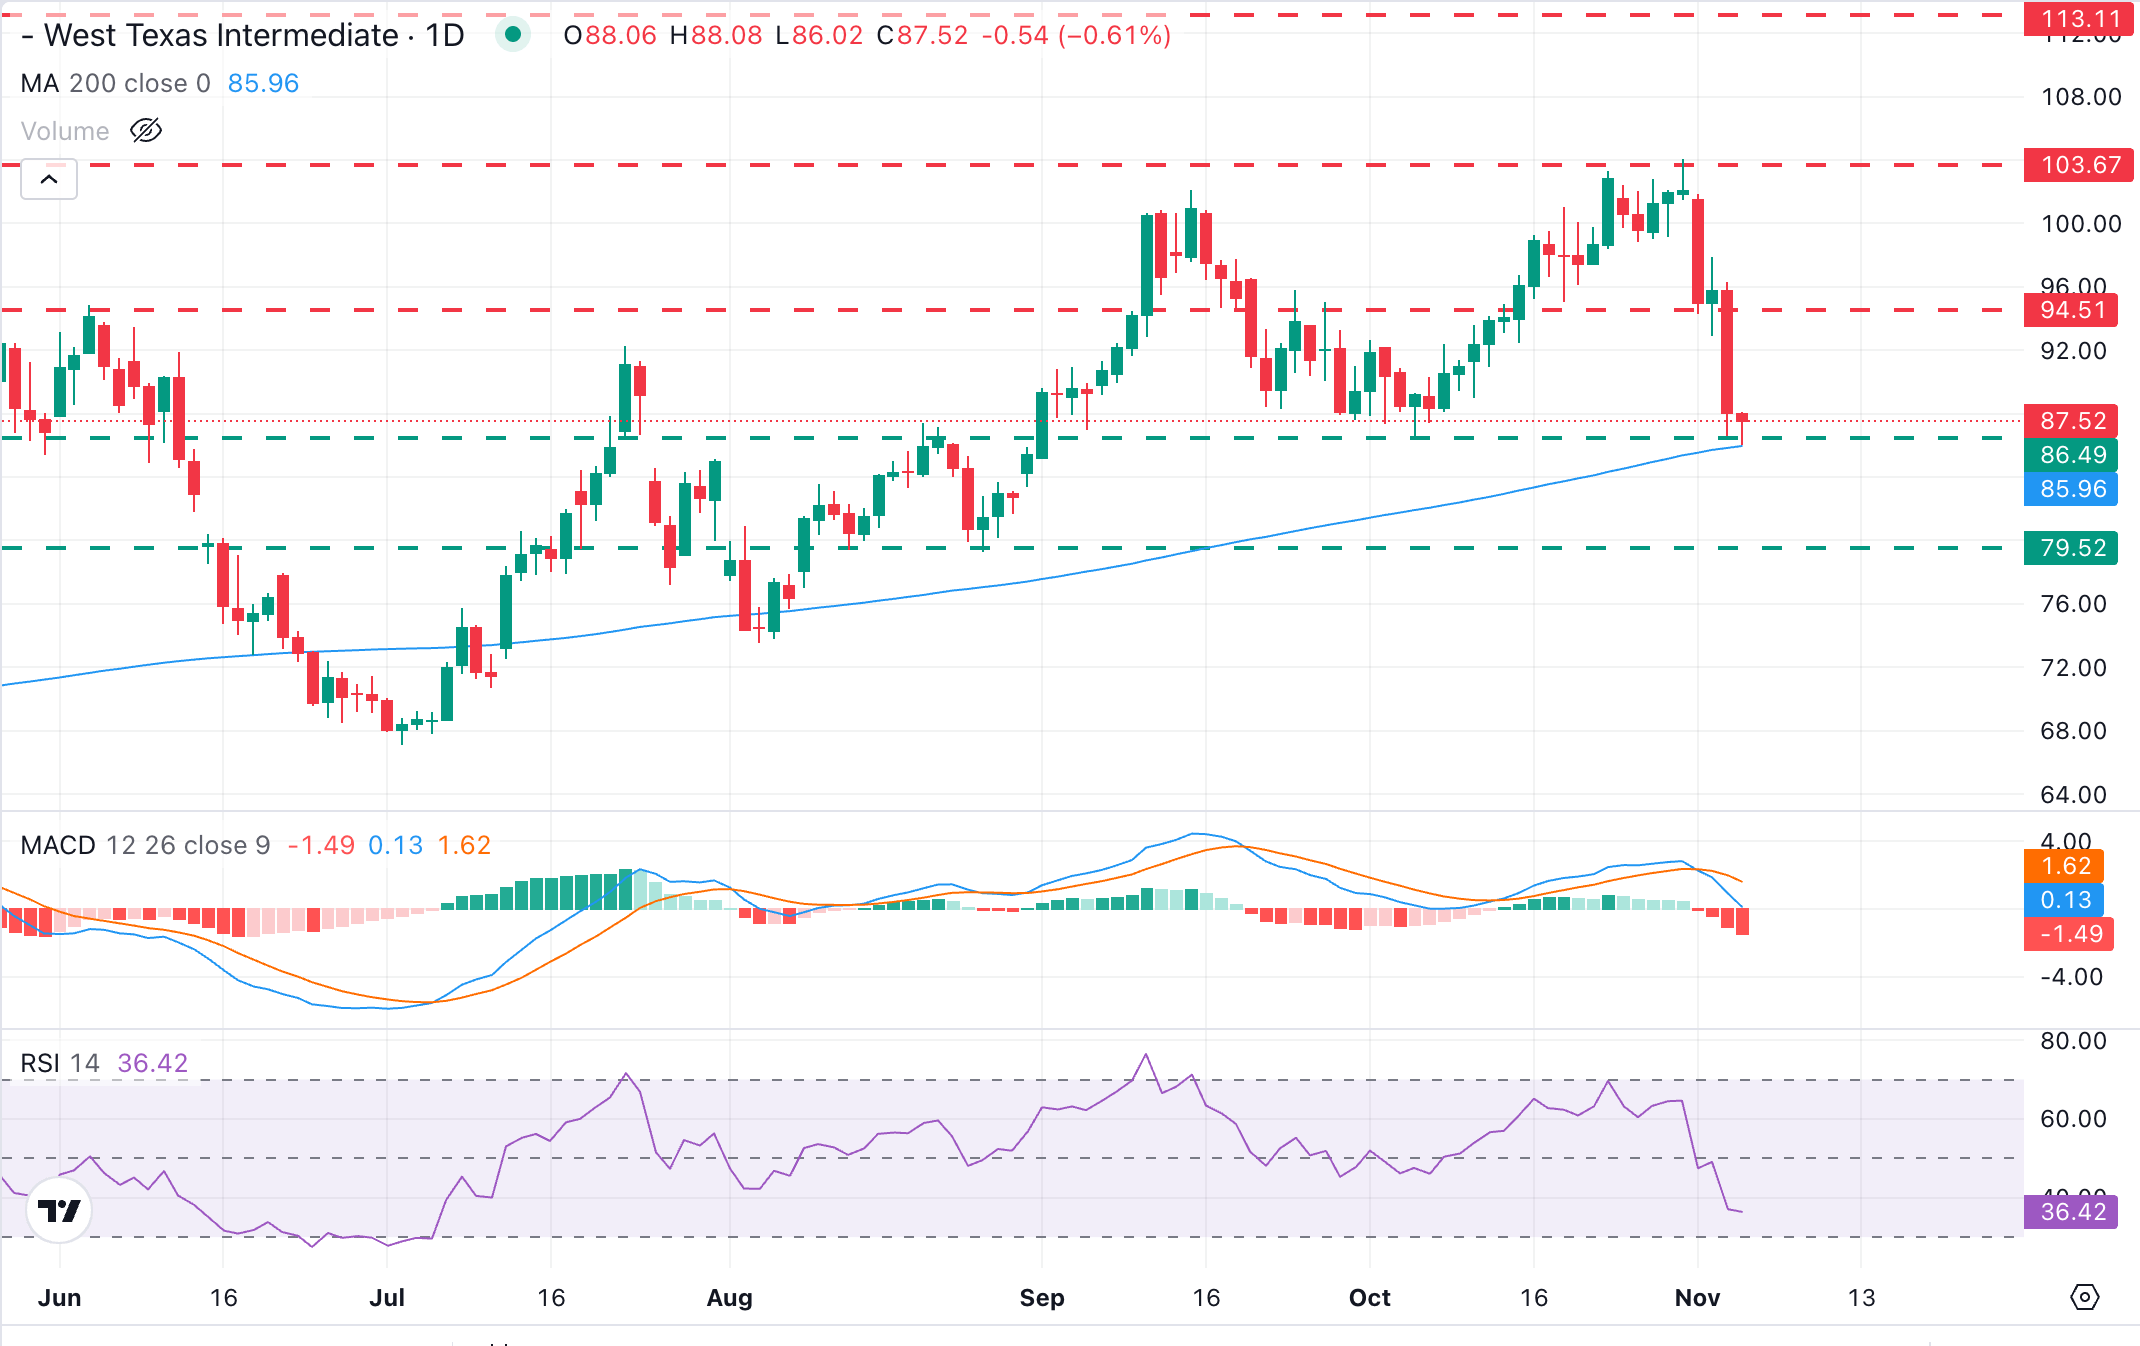
With momentum weakening sharply, WTI US Oil is trading at $87.52, barely above its 200-day simple moving average (SMA). On the daily chart, the Relative Strength Index (RSI) has fallen to 36.5. The Moving Average Convergence Divergence (MACD) line has moved below the Signal line, while the histogram has become more negative. Together, these readings suggest the latest pullback is gathering pace, even though the broader trend remains positive.
A confirmed break below the $86.00 region would signal a change in trend and intensify downward pressure towards the late August lows near $79.30, followed by the August 3 low around $73.50. Any recovery would first encounter resistance near $94.50, the former support zone marked by the November 2 low. Beyond that lie last week's highs above $103.67.
(The technical analysis of this story was written with the help of an AI tool. Know more.)
WTI Oil: Key Questions Answered
Among the crude oils traded internationally, WTI, short for West Texas Intermediate, is one of the three main varieties alongside Brent and Dubai Crude. Its relatively low gravity and sulphur content account for the descriptions “light” and “sweet”, respectively. Regarded as a high-quality oil, WTI is straightforward to refine. Production takes place in the United States, with distribution routed through the Cushing hub, known as “The Pipeline Crossroads of the World”. WTI serves as an oil market benchmark, and its price is regularly cited in media coverage.
Supply and demand underpin WTI Oil prices, as they do those of other assets. Stronger global growth can lift demand, whereas weaker growth can have the reverse effect. On the supply side, political instability, wars and sanctions can interrupt flows and affect prices. Decisions by OPEC, the grouping of major oil-producing countries, also play an important role. Since oil is traded predominantly in US Dollars, the US Dollar's value influences WTI Crude Oil prices: a weaker currency can make oil more affordable, while a stronger one can do the opposite.
WTI Oil prices respond to weekly inventory releases from the American Petroleum Institute (API) and the Energy Information Agency (EIA), as stock movements indicate shifts in supply and demand. A decline in inventories may point to stronger demand and lift oil prices; rising stocks may suggest greater supply and weigh on prices. The API releases its report on Tuesdays, followed by the EIA the next day. The two sets of figures generally align, coming within 1% of one another 75% of the time. As the EIA is a government agency, its data is regarded as more reliable.
At meetings held twice a year, the 12 oil-producing nations in OPEC (Organization of the Petroleum Exporting Countries) jointly set production quotas for member countries. These decisions frequently influence WTI Oil prices. Lower quotas can constrain supply and lift oil prices, whereas increased OPEC production has the reverse effect. The wider OPEC+ grouping brings in ten additional non-OPEC members, with Russia the most prominent among them.
POPULAR ARTICLES
1Swedish Krona: Riksbank path shifts focus to February – Commerzbank2Injective Price Forecast: First-ever INJ staked ETF approval drives further gains3WTI Price Forecast: Can key support at the 200-day SMA near $86.00 hold?4Silver price today: FXStreet data show Silver moving higher5Gold: Can the post-election rally withstand headwinds? – ING6Amid softer oil prices and German manufacturing momentum, Euro holds steady against Swiss Franc7Why is the British Pound struggling to build on gains ahead of the BoE’s policy decision?8Italy Retail Sales n.s.a (YoY) rose from previous 0.5% to 1.6% in September9Dow Jones futures advance as US jobs data and corporate earnings take centre stage


Get Started!
Sign up and access the Global Markets in less than 3 minutes

Connect With Us









Contacts
Phone: +61 2 8036 8388
Fax: +61 2 8036 8388
Email: support@tmgm.com



The information provided on this website is of a general nature only and does not constitute personal financial advice. Before acting on any information on this website, you should consider the suitability of the information in relation to your objectives, financial situation and needs. Investing in CFDs and FX Margin Contracts carries significant risks and is not suitable for all investors. You may lose more than your initial deposit. You do not own, or have, any interest in the underlying asset. We recommend that you seek independent advice and ensure you fully understand the risks involved before trading. It is important that you read and consider the disclosure document before you acquire any product listed on the website. The information and advertisements offered on this website are not intended for use by any person in any country or jurisdiction where such use would be contrary to local laws and regulations. The Products and Services offered on this website are not intended for residents of the United States, Malaysia and Thailand.
TMGM is authorized and regulated in various jurisdictions.
Trademax Australia Limited, trading as TMGM, is regulated by the Australian Securities and Investments Commission (ASIC), AFSL no. 436416 and is located at Level 28, One International Tower, 100 Barangaroo Avenue, 2000 Sydney, NSW Australia.
Email: support@tmgm.com.au
Trademax Global Limited, trading as TMGM, is authorized and regulated by the Vanuatu Financial Services Commission (VFSC), registration number 40356 and registered at 1276, Kumul Highway, Port Vila, Vanuatu, Republic of Vanuatu.
Email: support@tmgm.com
Trademax Global Markets (SE) Limited, trading as TMGM, is authorized and regulated by the Financial Services Authority (FSA) of Seychelles, with license number SD224. The company is registered at Office No 13, Providence Estate ABIS Centre, Mahe, Seychelles.
Email: support@tmgm.com
Trademax Global Markets (International) Pty Ltd, trading as TMGM, is authorized and regulated by the Financial Services Commission, Mauritius (FSC) with license no. GB22201012, and registered at 33, Edith Cavell Street C/o IQ EQ Fund Services (Mauritius) Ltd Port Louis, 11324 Mauritius.
Email: support@tmgm.com
Copyright © TMGM. All rights reserved