

Trading
Explore a wide range of markets with competitive pricing, deep liquidity, and advanced trading tools.
Learn More 
Platform
Trade seamlessly with TMGM's powerful platform, built for speed, precision, and a superior trading experience.
Learn More Trading Platform
Academy
Learn the fundamentals of trading with beginner-friendly resources, including guides, webinars, and market insights.
Learn More News & Analysis
Get real-time market updates and expert analysis to stay ahead of trading opportunities
Learn More News & Analysis
About
Learn what sets TMGM apart — our global presence, regulatory strength, and commitment to innovation in trading.
Learn More Why Choose TMGM
Sponsorship
Pi Network Price Forecast: Halts decline as Core Team explores stablecoin integration
- Pi Network hovers above $0.0800 on Friday, holding steady after a roughly 7% decline on Wednesday.
- Pi Core Team is exploring the integration of stablecoins following the recent partnership with the OUSD stablecoin issuer, Open Standard.
- The technical outlook for PI is bearish, with downside pressure building on the $0.0800 support level.
Pi Network (PI) price is up nearly 2% on Friday, finding near-term support around $0.0800 after a corrective slide of around 13% over the past seven days. The Pi Core Team is exploring the additional utility of Open Standard’s OUSD stablecoin across the Pi ecosystem, while maintaining the PI token’s status as the network’s native token. The technical outlook for PI remains bearish, as the prevailing downtrend risks a breakout below $0.0800.

Pi Core Team explores OUSD stablecoin integration
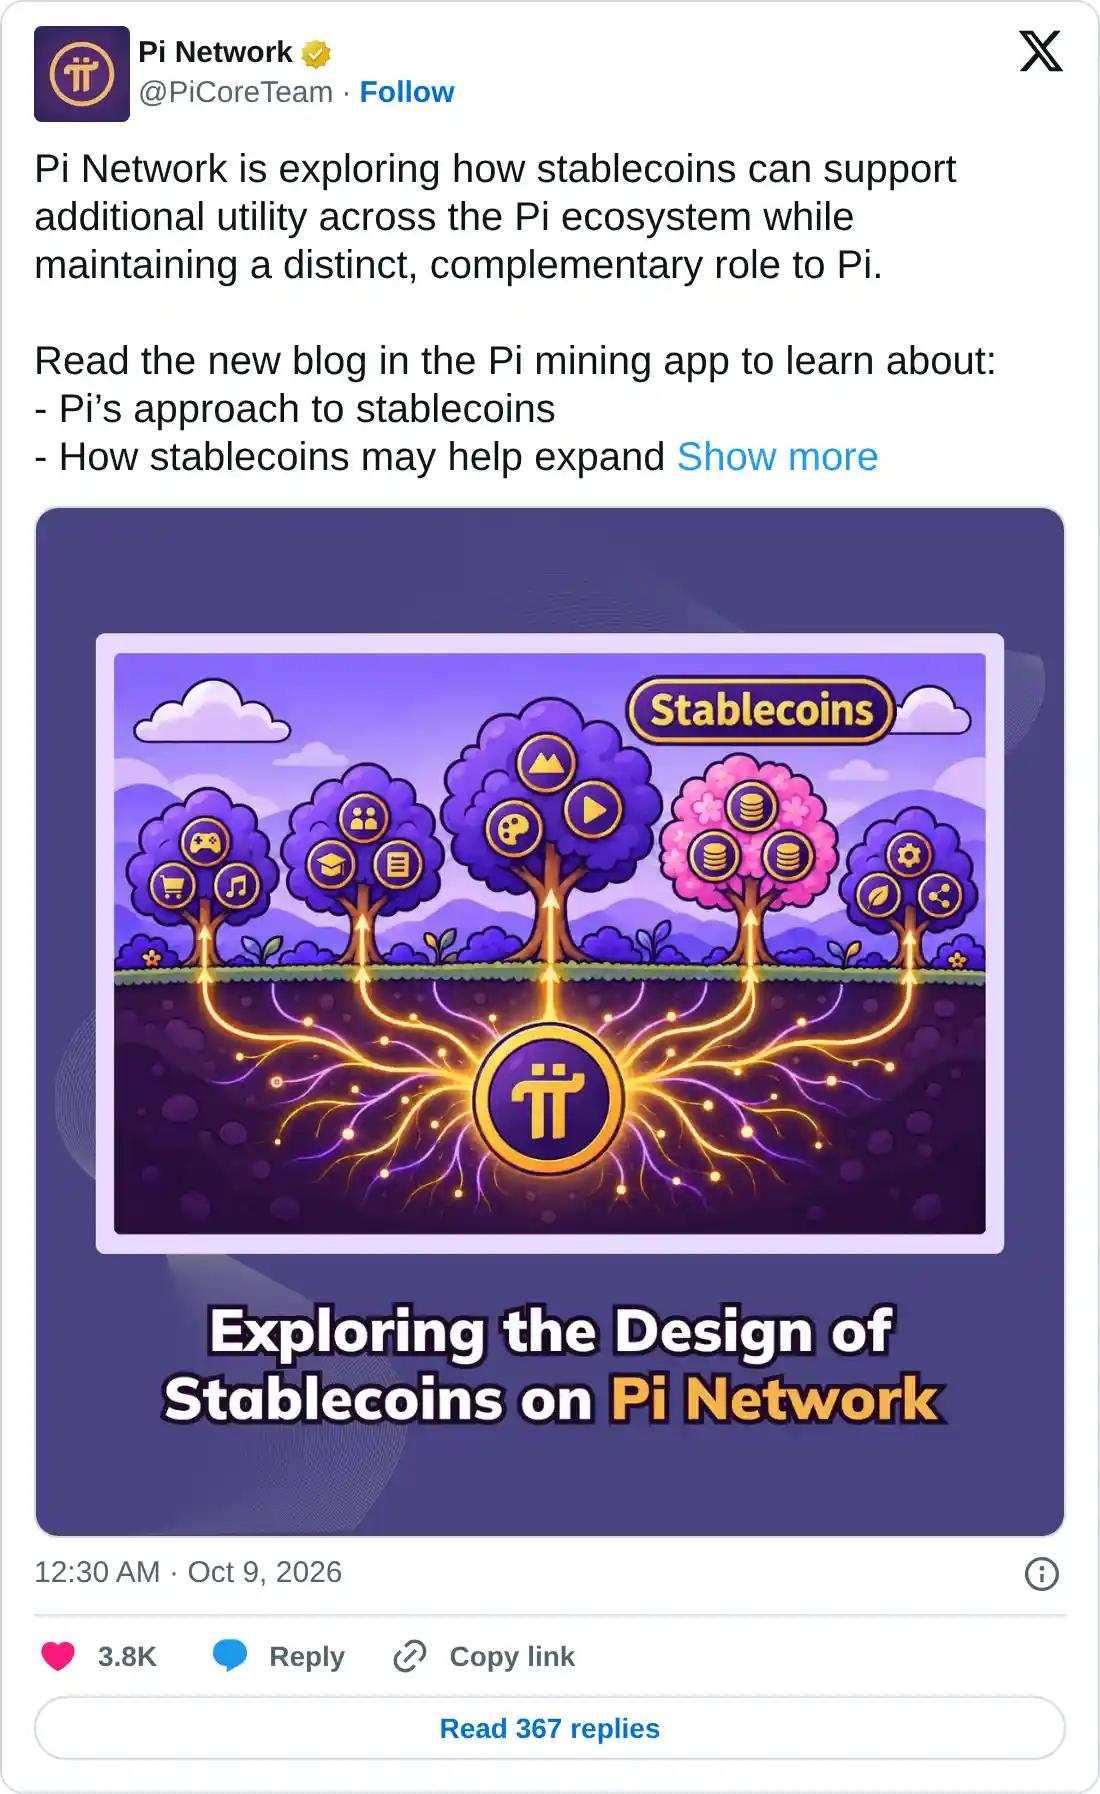
Pi Network announced plans to introduce a US Dollar-pegged stablecoin, Open Standard’s OUSD, to its ecosystem in a blog post on Thursday. The integration will explore user rewards programs and broader utility across the Pi ecosystem, which may require establishing principles to guide future integrations and ensure compliance. Pi Core Team also remains focused on maintaining a distinct, complementary role to Pi. Overall, stablecoin integration in the Pi ecosystem could boost real-world economic activities.
Technical outlook: Pi Network’s short-term footing remains at risk
Pi Network trades around $0.0819 at press time on Friday, maintaining a bearish near-term bias. The PI token remains well below the 50-, 100-, and 200-day Exponential Moving Averages (EMAs) at $0.0898, $0.0981, and $0.1240, respectively.
From a technical perspective, PI is capped by the 23.6% Fibonacci retracement at $0.0866, measured from $0.1341 to $0.0704, reinforcing overhead supply, while the July 31 low around $0.0801 serves as the immediate support.
A confirmed breakout below $0.0801 could extend the decline toward the $0.704 swing low, potentially attracting near-term buying interest. However, any deeper pullbacks would mark a new record low for the PI token, igniting a support-discovery mode.
Momentum on the daily chart shows a corrective bias, as the Moving Average Convergence Divergence (MACD) remains below zero and the signal line, with an expanding negative histogram, while the Relative Strength Index (RSI) near 38 suggests weak but not extreme selling pressure.
On the topside, initial resistance emerges at the 23.6% Fibonacci retracement at $0.0866, followed by the 50-day EMA at $0.0898. A sustained break above these levels would open the way toward the 100-day EMA at $0.0981. Further up, the 50% retracement level at $0.1049 and the 200-day EMA at $0.1240 stand as broader bullish validation hurdles.
(The technical analysis of this story was written with the help of an AI tool. Know more.)
Top Articles
1British Pound: Resilient growth supports more BoE hikes - Commerzbank2Euro picks up against British Pound with French debt, Oil prices still weighing3Euro: Recovery capped by resistance against US Dollar – UOB4WTI declines to near $89.50 as Trump rules out attacks on Iran before midterm elections5GBP/USD Price Forecast: Risk-on sentiment lends support6Pi Network Price Forecast: Halts decline as Core Team explores stablecoin integration7Indian Rupee gets relief from pullback in US bond yields8Dogecoin Price Forecast: Whale selling and bearish momentum threaten further correction9Asian Stocks struggle as OpenAI revenue miss hits AI sector, trade concerns loom
LIVE QUOTES


ALL ABOUT TECHNICAL
What Is ICT Trading? Inner Circle Trader Concepts Explained
Support and Resistance: Meaning, Types, How to Draw Levels & Trading Strategies
What Is Liquidity? Meaning in Trading and Financial Markets
Liquidity Sweep: Meaning, Examples & Trading Strategy
Market Structure in Trading: The Complete Guide (Bullish, Bearish, Sideways)
Change of Character (CHoCH): Definition, Examples & Strategy
What Is the Bullish Kicker Pattern and How to Trade It?
What Is a Dragonfly Doji Candlestick and How Do You Trade It?
What Is an Inverted Hammer Candlestick Pattern and How Do You Trade It?
Get Started!
Sign up and access the Global Markets in less than 3 minutes

Connect With Us









Contacts
Phone: +61 2 8036 8388
Fax: +61 2 8036 8388
Email: support@tmgm.com



The information provided on this website is of a general nature only and does not constitute personal financial advice. Before acting on any information on this website, you should consider the suitability of the information in relation to your objectives, financial situation and needs. Investing in CFDs and FX Margin Contracts carries significant risks and is not suitable for all investors. You may lose more than your initial deposit. You do not own, or have, any interest in the underlying asset. We recommend that you seek independent advice and ensure you fully understand the risks involved before trading. It is important that you read and consider the disclosure document before you acquire any product listed on the website. The information and advertisements offered on this website are not intended for use by any person in any country or jurisdiction where such use would be contrary to local laws and regulations. The Products and Services offered on this website are not intended for residents of the United States, Malaysia and Thailand.
TMGM is authorized and regulated in various jurisdictions.
Trademax Australia Limited, trading as TMGM, is regulated by the Australian Securities and Investments Commission (ASIC), AFSL no. 436416 and is located at Level 28, One International Tower, 100 Barangaroo Avenue, 2000 Sydney, NSW Australia.
Email: support@tmgm.com.au
Trademax Global Limited, trading as TMGM, is authorized and regulated by the Vanuatu Financial Services Commission (VFSC), registration number 40356 and registered at 1276, Kumul Highway, Port Vila, Vanuatu, Republic of Vanuatu.
Email: support@tmgm.com
Trademax Global Markets (SE) Limited, trading as TMGM, is authorized and regulated by the Financial Services Authority (FSA) of Seychelles, with license number SD224. The company is registered at Office No 13, Providence Estate ABIS Centre, Mahe, Seychelles.
Email: support@tmgm.com
Trademax Global Markets (International) Pty Ltd, trading as TMGM, is authorized and regulated by the Financial Services Commission, Mauritius (FSC) with license no. GB22201012, and registered at 33, Edith Cavell Street C/o IQ EQ Fund Services (Mauritius) Ltd Port Louis, 11324 Mauritius.
Email: support@tmgm.com
Copyright © TMGM. All rights reserved