

Trading
Explore a wide range of markets with competitive pricing, deep liquidity, and advanced trading tools.
Learn More 
Platform
Trade seamlessly with TMGM's powerful platform, built for speed, precision, and a superior trading experience.
Learn More Trading Platform
Academy
Learn the fundamentals of trading with beginner-friendly resources, including guides, webinars, and market insights.
Learn More News & Analysis
Get real-time market updates and expert analysis to stay ahead of trading opportunities
Learn More News & Analysis
About
Learn what sets TMGM apart — our global presence, regulatory strength, and commitment to innovation in trading.
Learn More Why Choose TMGM
Sponsorship
October US Inflation Rise: Bitcoin vs Gold Outlook as BTC and XAU retreat
- $74,000 gives way as Bitcoin declines on Tuesday following US inflation data.
- Near $4,050, Gold undergoes a correction as key moving averages and the dynamic SuperTrend indicator exert pressure.
- A 0.4% rise in US CPI for October exceeded the market forecast of 0.3%.
Bitcoin (BTC) hovers near $74,000 on Tuesday. Gold (XAU/USD) trades around $4,050, with both assets remaining in a broad downtrend. Fragile technical structures and macroeconomic uncertainty leave the balance of risks tilted towards further declines.
Support for Gold appears to hold at the critical $4,000 mark. Bitcoin, by contrast, keeps probing lower demand zones towards $70,000.

0.4% October increase in US CPI
October inflation increased 0.4% month on month, according to the United States (US) Consumer Price Index published on Tuesday by the Bureau of Labor Statistics (BLS). Although slower than September’s 0.6% rise, the reading exceeded the market forecast of 0.3%.
Core CPI, which strips out volatile food and energy prices, advanced 0.3% in October. That matched September’s reading but topped expectations of 0.2%.
Annual inflation readings were absent from the release. Monthly data for October 2025 were unavailable because of the government shutdown from 1 October 2025 to 12 November 2025.
In written commentary, Joel Kruger, Global Markets Strategist at LMAX Group, said: “We see little in today’s US inflation data to materially shift the market outlook, despite the slightly hotter-than-expected readings,” adding, “With markets already pricing in a December Fed rate hike, there is limited scope for an additional hawkish repricing.”
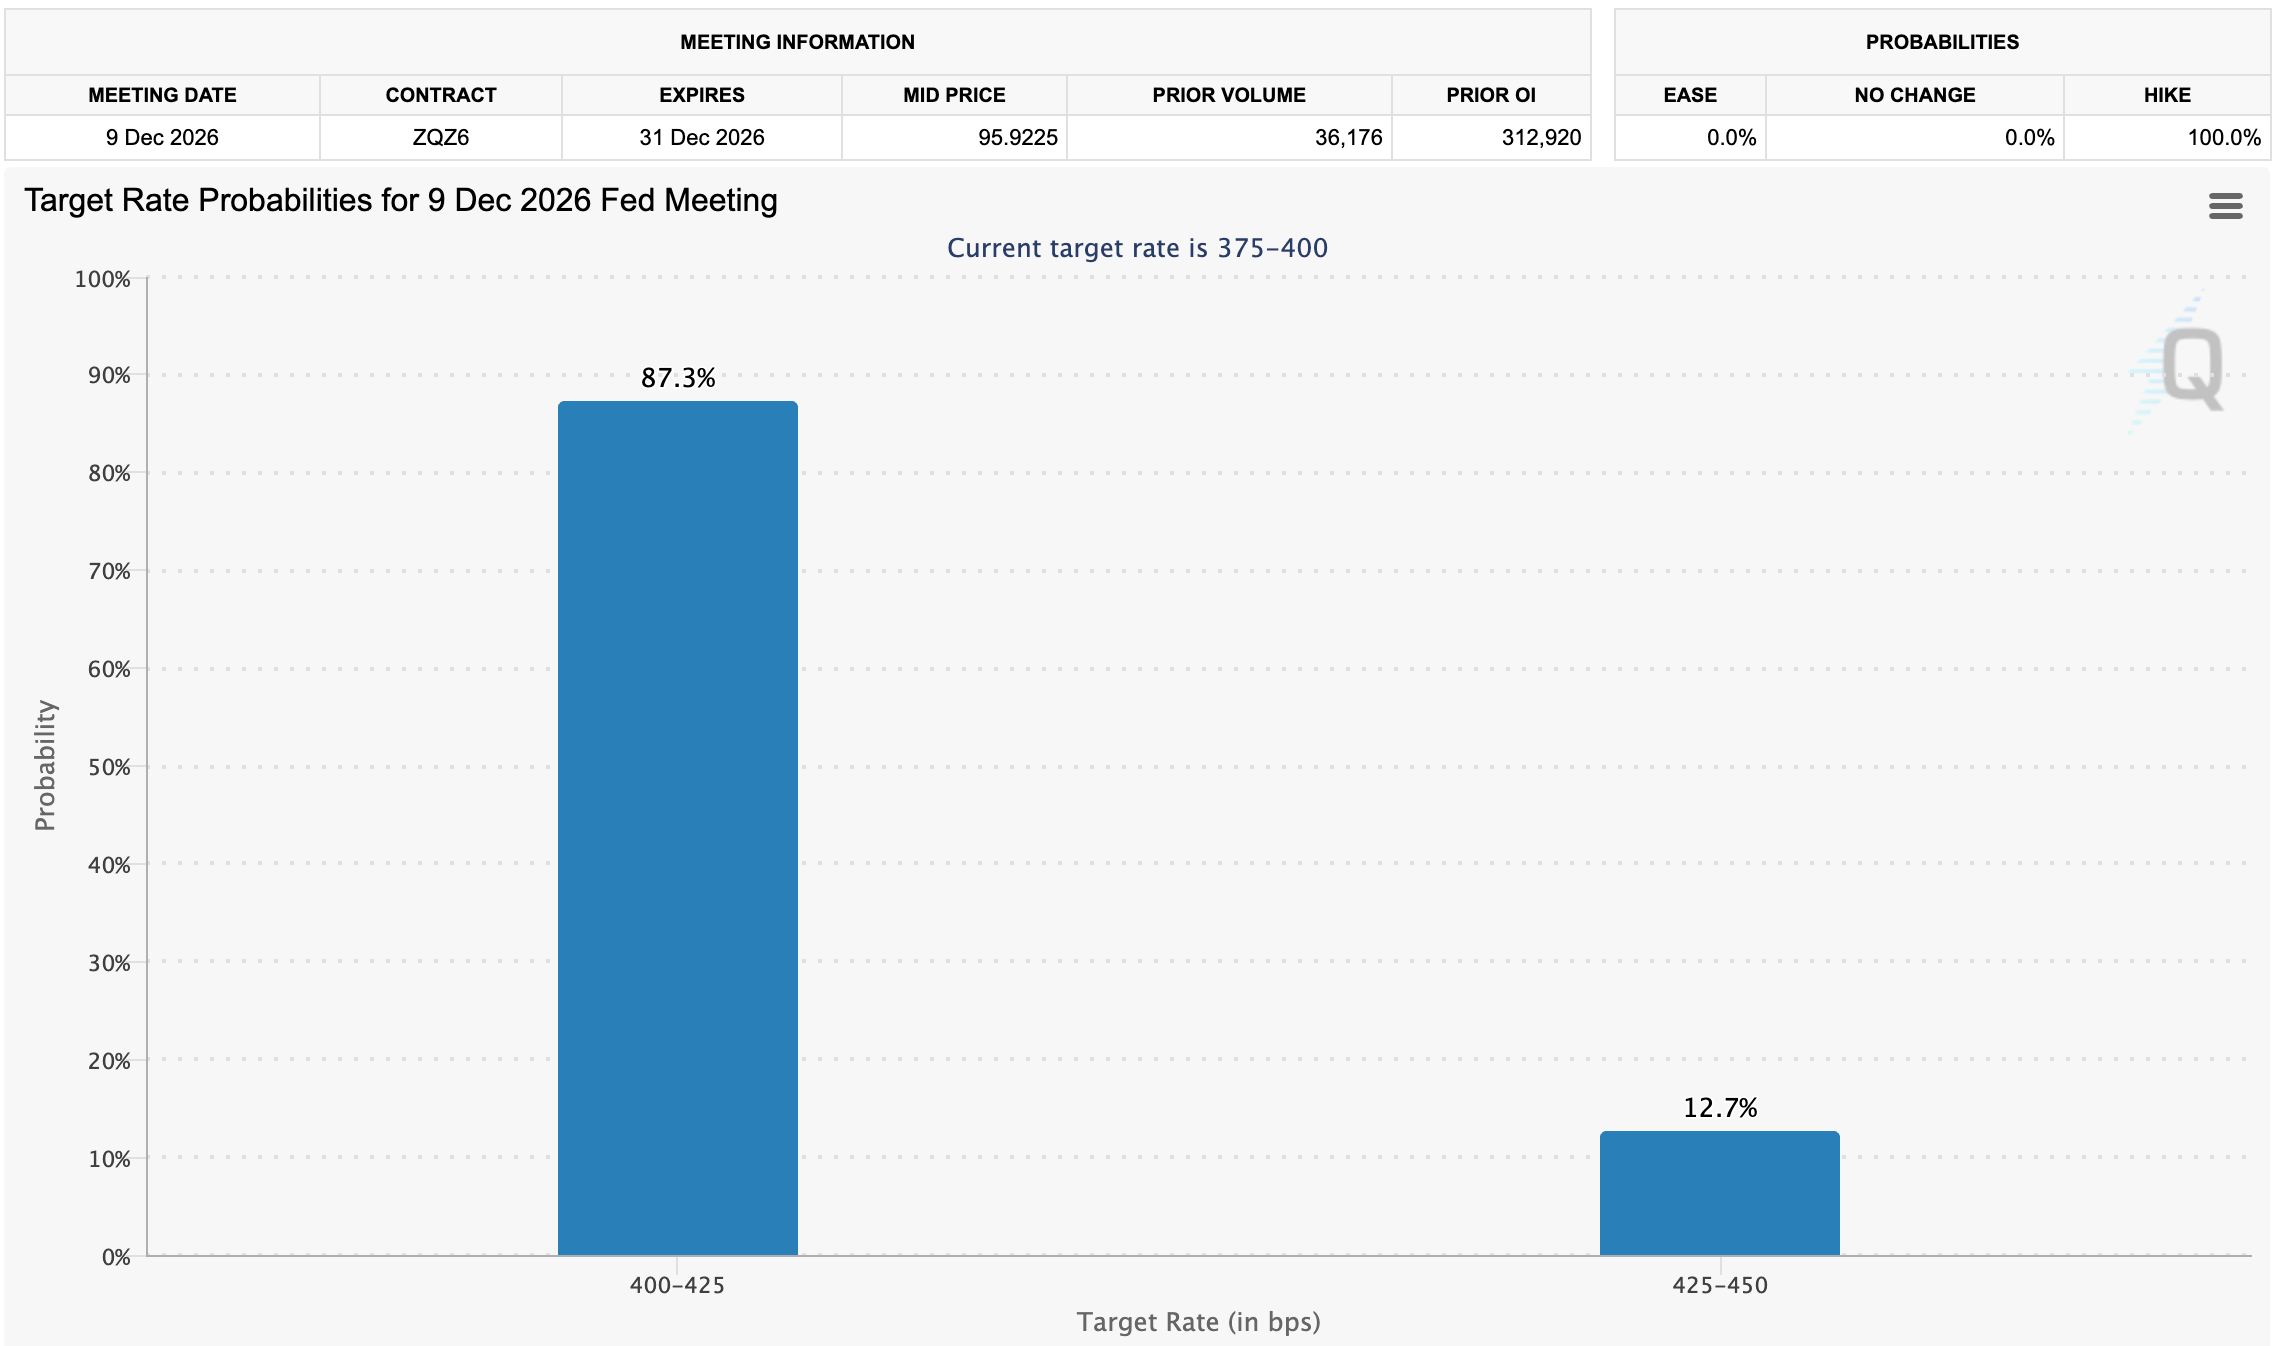
An 87% probability of a December interest rate increase by the Federal Reserve (Fed), taking rates to the 4.00-4.25% range, is priced in by market participants, according to the CME Group’s FedWatch Tool. Rates were unchanged in October after September’s 25-basis-point increase, the first hike in three years.
$74,051 Bitcoin: technical outlook favours sellers
At $74,051, Bitcoin remains below its key Exponential Moving Averages (EMAs), leaving the near-term outlook bearish. Overhead resistance comprises the 200-day EMA at $76,460, the 100-day EMA at $77,562 and the 50-day EMA at $79,114. While the pair stays beneath this cluster, recovery attempts are likely to face a ceiling.
A cautious outlook is also evident in the momentum indicators. The Moving Average Convergence Divergence (MACD) line sits beneath both its signal line and zero, while the Relative Strength Index (RSI) is near 35. These readings suggest persistent selling pressure, though conditions are not yet deeply oversold.
The first upside hurdle is the 200-day EMA near $76,460. Beyond it lie the 100-day EMA at approximately $77,562 and the 50-day EMA near $79,114. Buyers would need to regain this concentrated overhead supply zone to neutralise the prevailing downtrend.
For the downside outlook, the only apparent structural demand lies much higher, at the SuperTrend level near $81,208. Well above the spot price, this level will become relevant only if BTC mounts a broader recovery. Until that happens, trading beneath the daily EMA cluster leaves the pair exposed to additional losses.
$4,055 Gold: XAU sheds gains as selling intensifies
At $4,055, Gold retains a bearish near-term outlook beneath a concentrated band of moving averages and trend resistance. The 50-day EMA, around $4,150, remains above the metal. Further overhead, the 100-day EMA near $4,229 and the 200-day EMA near $4,257 strengthen the broader resistance zone. An active downward resistance trendline adds to that ceiling, with its breakout level substantially higher at around $4,337.
The SuperTrend signal, near $4,163, likewise remains above spot. This suggests that any rebound is still corrective within a structure constrained by resistance. Although the MACD has moved into positive territory and the RSI sits just below 50, those readings point to only modest stabilisation in momentum, not a clear bullish reversal.
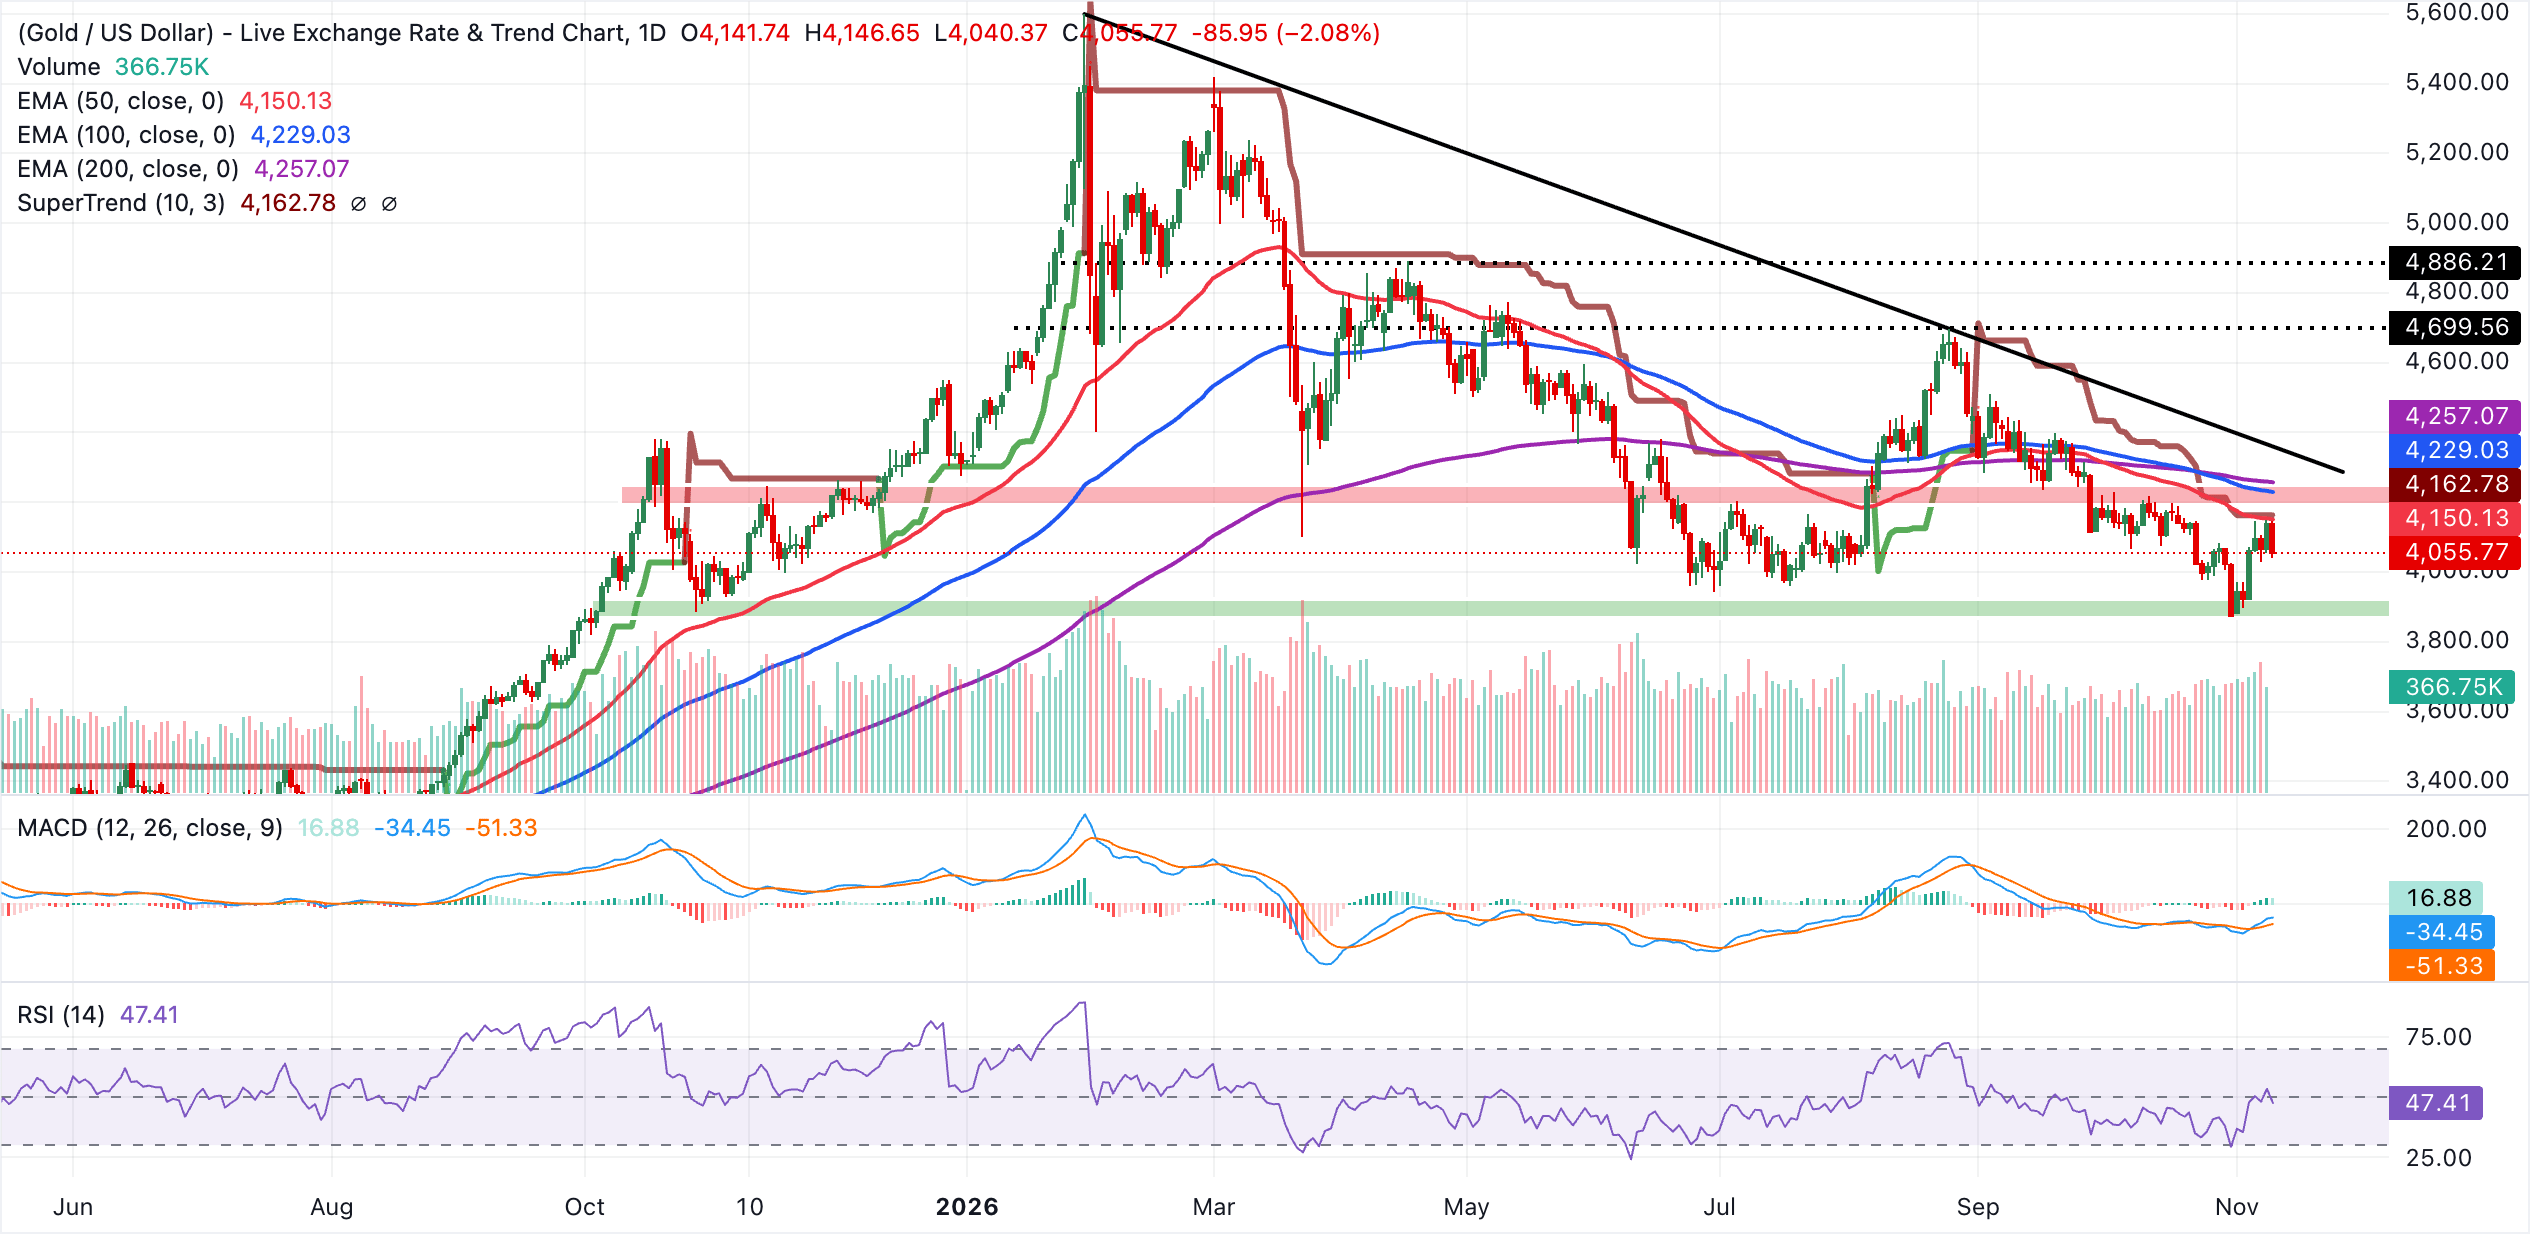
The 50-day EMA near $4,150 presents the first resistance level. Together with the nearby SuperTrend barrier around $4,163, it forms an initial supply cluster that buyers must overcome to reduce immediate downside pressure. Higher up, a broader resistance band spans the 100-day EMA at approximately $4,229 and the 200-day EMA near $4,257. Regaining the downward resistance trendline’s breakout price around $4,337 would be necessary to negate the prevailing bearish outlook, making it a more decisive medium-term hurdle. The supplied daily chart levels offer no identifiable nearby support. Any renewed decline below $4,055 would therefore expose Gold to further losses until a new demand zone forms on the chart.
(The technical analysis of this story was written with the help of an AI tool. Find out more.)
Bitcoin, altcoins and stablecoins: key questions
Designed to function as money, Bitcoin is a virtual currency and the largest cryptocurrency by market capitalisation. No single person, group or entity can control this payment method, removing the need for third parties to participate in financial transactions.
The term altcoin covers every cryptocurrency other than Bitcoin. Some, however, also exclude Ethereum, on the grounds that forks originate from these two cryptocurrencies. Under that interpretation, Litecoin is the first altcoin: it was forked from the Bitcoin protocol and is therefore an “improved” version of it.
Price stability is the design objective of stablecoins, cryptocurrencies backed by reserves of the assets they represent. Each stablecoin is pegged to a commodity or financial instrument, such as the US Dollar (USD), while an algorithm or demand regulates its supply. Their principal purpose is to give investors a route into and out of cryptocurrency trading and investment. They also provide a way to store value, given the volatility generally associated with cryptocurrencies.
The ratio of Bitcoin’s market capitalisation to the combined market capitalisation of all cryptocurrencies is known as Bitcoin dominance. It offers a clear indication of investor interest in Bitcoin. BTC dominance is typically high before and during a bull run, as investors turn to relatively stable cryptocurrencies with large market capitalisations, such as Bitcoin. When BTC dominance falls, it usually signals that investors are shifting capital and/or profits into altcoins in pursuit of higher returns. That shift usually sparks a surge in altcoin rallies.
POPULAR ARTICLES
1Above-forecast US CPI weighs on Japanese Yen as Fed officials favour further rate hikes2Two more hikes expected by Fed’s Logan, who flags faster winter tightening3October US Inflation Rise: Bitcoin vs Gold Outlook as BTC and XAU retreat4December ECB rate hike obvious despite energy relief, says Nagel5Below 1.34: British Pound slides as hot CPI raises prospect of 50-bps Fed hike6US CPI bolsters hawkish Fed outlook, weighing on Canadian Dollar71.1200 gives way as euro retreats and hotter US inflation boosts Fed rate hike bets8United States Consumer Price Index Core s.a came in at 339.9, above forecasts (0) in October9United States Consumer Price Index (MoM) above forecasts (0.3%) in October: Actual (0.4%)

Get Started!
Sign up and access the Global Markets in less than 3 minutes

Connect With Us









Contacts
Phone: +61 2 8036 8388
Fax: +61 2 8036 8388
Email: support@tmgm.com



The information provided on this website is of a general nature only and does not constitute personal financial advice. Before acting on any information on this website, you should consider the suitability of the information in relation to your objectives, financial situation and needs. Investing in CFDs and FX Margin Contracts carries significant risks and is not suitable for all investors. You may lose more than your initial deposit. You do not own, or have, any interest in the underlying asset. We recommend that you seek independent advice and ensure you fully understand the risks involved before trading. It is important that you read and consider the disclosure document before you acquire any product listed on the website. The information and advertisements offered on this website are not intended for use by any person in any country or jurisdiction where such use would be contrary to local laws and regulations. The Products and Services offered on this website are not intended for residents of the United States, Malaysia and Thailand.
TMGM is authorized and regulated in various jurisdictions.
Trademax Australia Limited, trading as TMGM, is regulated by the Australian Securities and Investments Commission (ASIC), AFSL no. 436416 and is located at Level 28, One International Tower, 100 Barangaroo Avenue, 2000 Sydney, NSW Australia.
Email: support@tmgm.com.au
Trademax Global Limited, trading as TMGM, is authorized and regulated by the Vanuatu Financial Services Commission (VFSC), registration number 40356 and registered at 1276, Kumul Highway, Port Vila, Vanuatu, Republic of Vanuatu.
Email: support@tmgm.com
Trademax Global Markets (SE) Limited, trading as TMGM, is authorized and regulated by the Financial Services Authority (FSA) of Seychelles, with license number SD224. The company is registered at Office No 13, Providence Estate ABIS Centre, Mahe, Seychelles.
Email: support@tmgm.com
Trademax Global Markets (International) Pty Ltd, trading as TMGM, is authorized and regulated by the Financial Services Commission, Mauritius (FSC) with license no. GB22201012, and registered at 33, Edith Cavell Street C/o IQ EQ Fund Services (Mauritius) Ltd Port Louis, 11324 Mauritius.
Email: support@tmgm.com
Copyright © TMGM. All rights reserved