

Trading
Explore a wide range of markets with competitive pricing, deep liquidity, and advanced trading tools.
Learn More 
Platform
Trade seamlessly with TMGM's powerful platform, built for speed, precision, and a superior trading experience.
Learn More Trading Platform
Academy
Learn the fundamentals of trading with beginner-friendly resources, including guides, webinars, and market insights.
Learn More News & Analysis
Get real-time market updates and expert analysis to stay ahead of trading opportunities
Learn More News & Analysis
About
Learn what sets TMGM apart — our global presence, regulatory strength, and commitment to innovation in trading.
Learn More Why Choose TMGM
Sponsorship
Crypto Today: Post-midterm elections rally unwinds as Bitcoin, Ethereum and XRP fall further
- $76,000 gives way as Bitcoin falls sharply. Concerns centre on Democrats taking control of the US Congress in January.
- $2,200 support remains in focus for Ethereum, with its technical structure limiting upside.
- $1.20 gives way for XRP as weakening momentum indicators add pressure.
$76,000 remains above Bitcoin (BTC) on Friday. The wider cryptocurrency market is undergoing a correction. As sellers strengthen their hold, Ethereum (ETH) slips towards the psychological demand zone at $2,200. Ripple (XRP) also presents a weak picture, retreating below $1.20.

US midterm outcome pressures crypto markets
Democrats will command majorities in both the House of Representatives and the Senate from January. The Democratic Party narrowly defeated Republicans to secure control of Congress in the United States (US) midterm elections, triggering widespread concerns. Many anticipate that the outcome could obstruct key crypto regulations and delay progress in Artificial Intelligence (AI) in the world’s largest economy.
According to a Wall Street Journal report, Senator Elizabeth Warren is expected to take the chair of the US Senate Banking Committee in early 2027. A prominent crypto critic and longstanding supporter of tighter rules, Warren is likely to bring crypto regulation into focus.
Among Warren’s possible first priorities, the report identifies investigations into alleged insider trading in prediction markets and scrutiny of consumer protection practices at crypto entities. Alleged conflicts of interest involving US President Donald Trump and his family may also come under review. Her appointment as Senate Banking Committee Chair remains unconfirmed, although observers see little chance of another candidate taking the role.
Writing in an opinion piece published by Time on Thursday, Senator Warren said: “Democrats won this election by claiming we are on the side of working people, and working people are counting on us to deliver,”
On September 15, the US CLARITY Act hit an impasse in the Senate. A procedural motion to bring it to the Senate floor failed 49-50, far below the 60-vote threshold required to proceed. Democrats have faced criticism for preventing its advance. With the party now holding a congressional majority, many fear crypto regulation could lose priority or undo progress made since Trump took office in 2024.
According to Crypto In America, Democrats are discussing the revival of legislation to protect crypto investors. That proposal could be broadened into a comprehensive bill governing digital market structure.
Crypto In America reported: “Additional ethics provisions are also expected, targeting crypto-related activities by President Trump and other federal officials,” and added: “The issue was a major sticking point in negotiations over the Clarity Act and helped drive the legislation’s collapse in September, when all Senate Democrats voted against advancing it.”
Passing fresh bills through Congress would not, however, guarantee their enactment. Trump keeps his veto power for the next two years, creating a separate and substantial obstacle. Republican support would be needed to override a presidential veto.
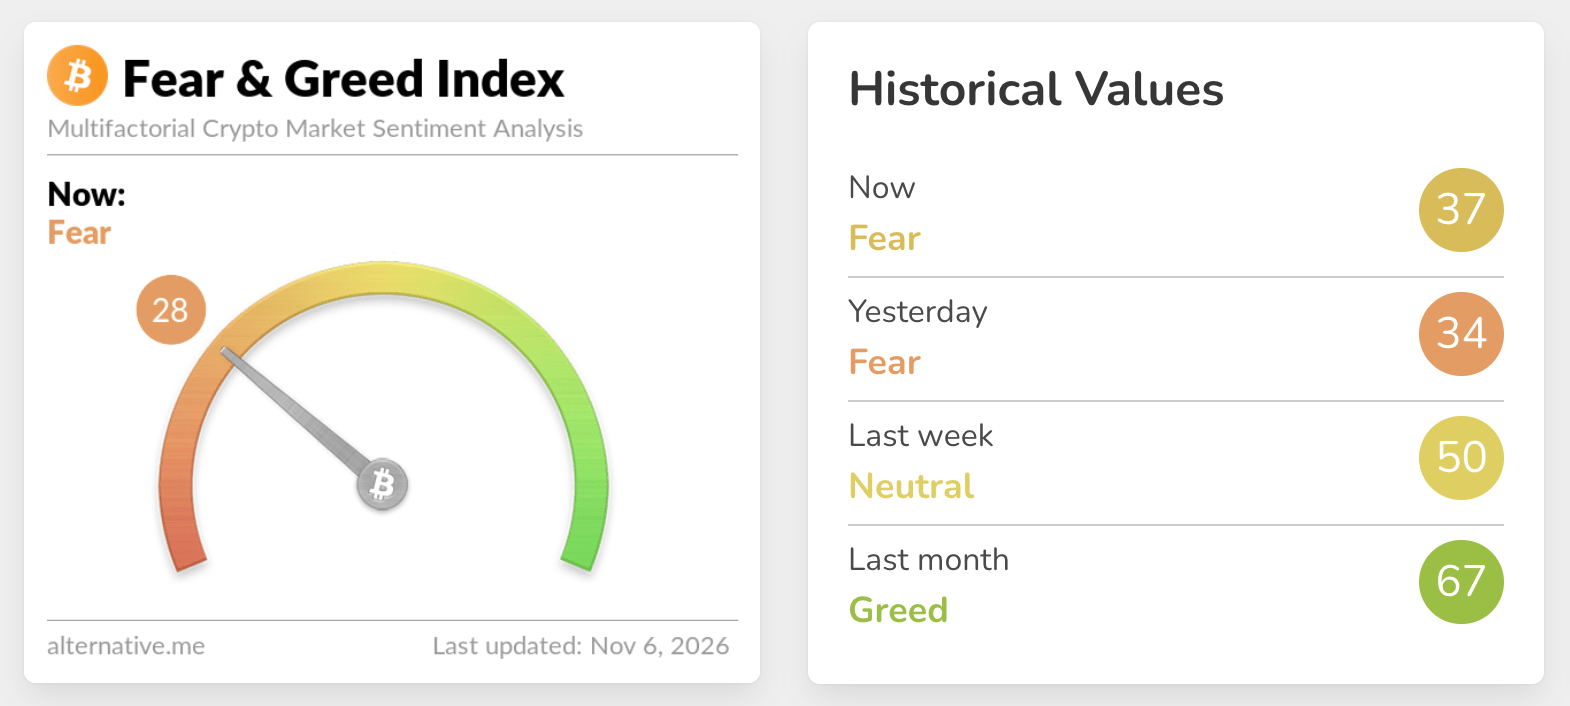
A reading of 28 on Friday underscores the continued deterioration in crypto market sentiment. The Fear & Greed Index fell from 37 a day earlier, with both readings in Fear territory. Last month, the index averaged 67 in the Greed region. The decline suggests waning appetite for crypto-related digital investment products.
$75,712: Bitcoin technical outlook stays bearish
At $75,712, Bitcoin remains below several key moving averages, leaving its near-term outlook bearish. Overhead supply is reinforced by the 200-day Exponential Moving Average (EMA) at $76,504, the 100-day EMA at $77,770 and the 50-day EMA near $79,821. All three continue to cap the pair.
A negative Moving Average Convergence Divergence (MACD) line and a Relative Strength Index (RSI) around 38 in bearish territory reinforce the weak backdrop. These momentum readings suggest that any rallies are likely to meet difficulty at resistance.
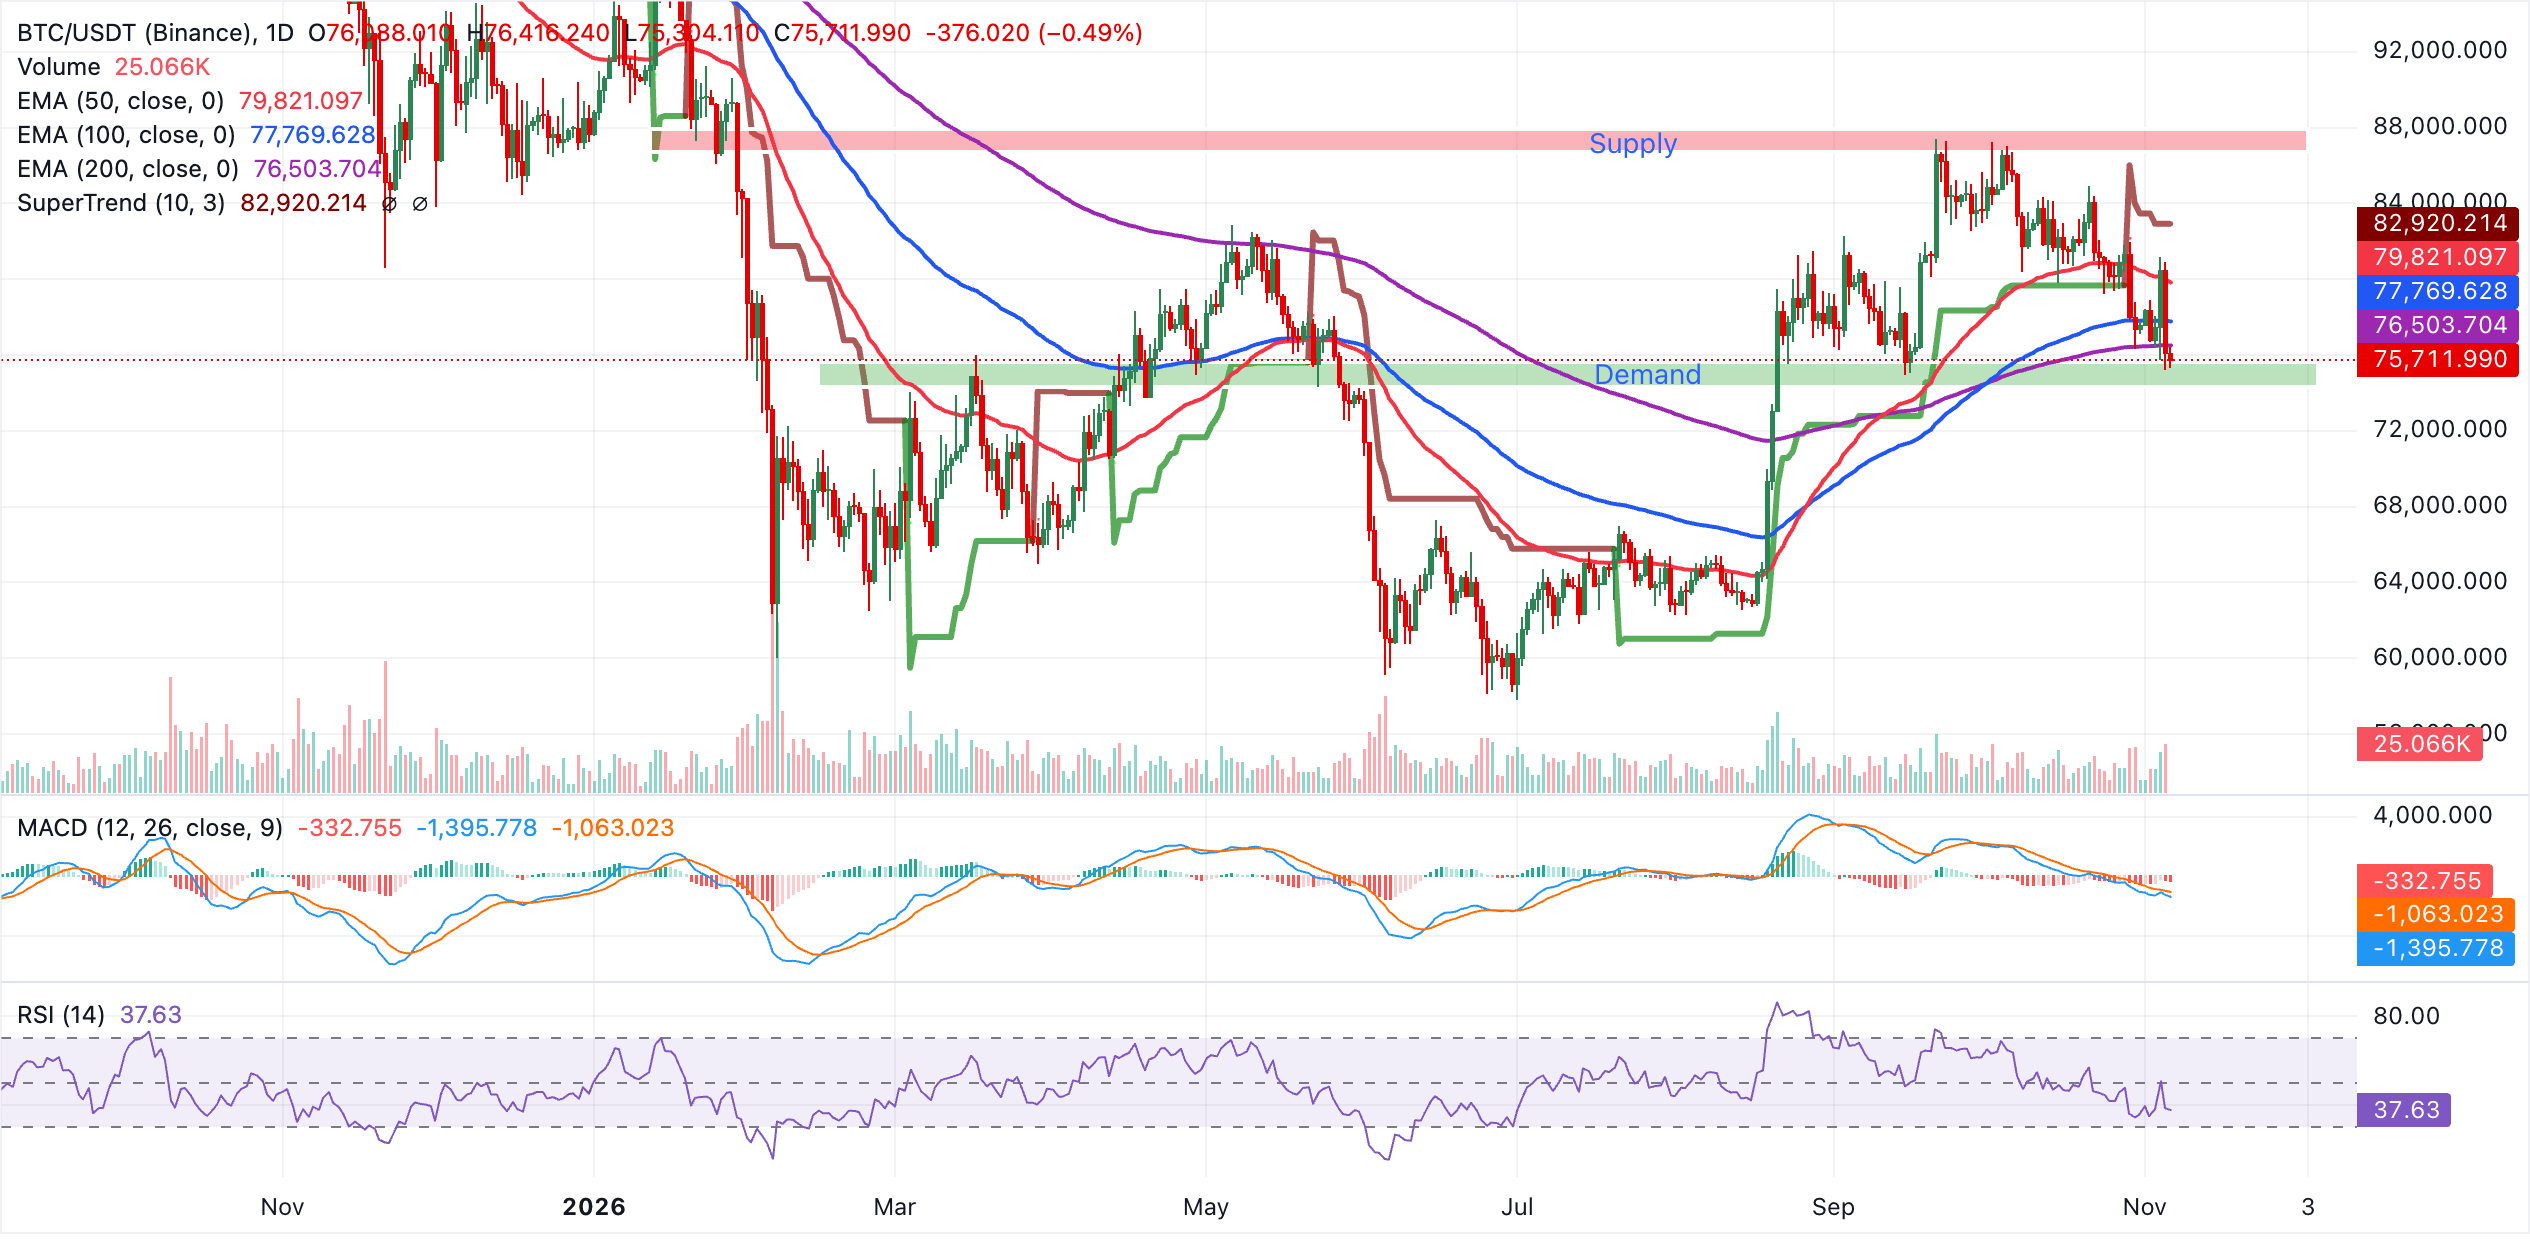
Recovering the 200-day EMA at $76,504 would be the first requirement for buyers to relieve immediate pressure. The next obstacle is the 100-day EMA at $77,770, followed by the 50-day EMA at $79,821. Further away, the SuperTrend line at $82,920 provides a ceiling that is unlikely to be tested without a material improvement in momentum.
$2,200 support in focus: Ethereum technical analysis
Near the crucial $2,200 demand zone, Ethereum continues to edge down. The smart contract token has surrendered the US midterm election gains that took it above $2,400 earlier this week. A cluster of key EMAs between $2,300 and $2,400 remains above the price, sustaining a strongly bearish outlook. On the daily chart, an RSI of 38 and a negative MACD indicate predominantly bearish momentum. The SuperTrend line at $2,490 adds pressure to ETH’s technical structure, suggesting the easier path remains lower.
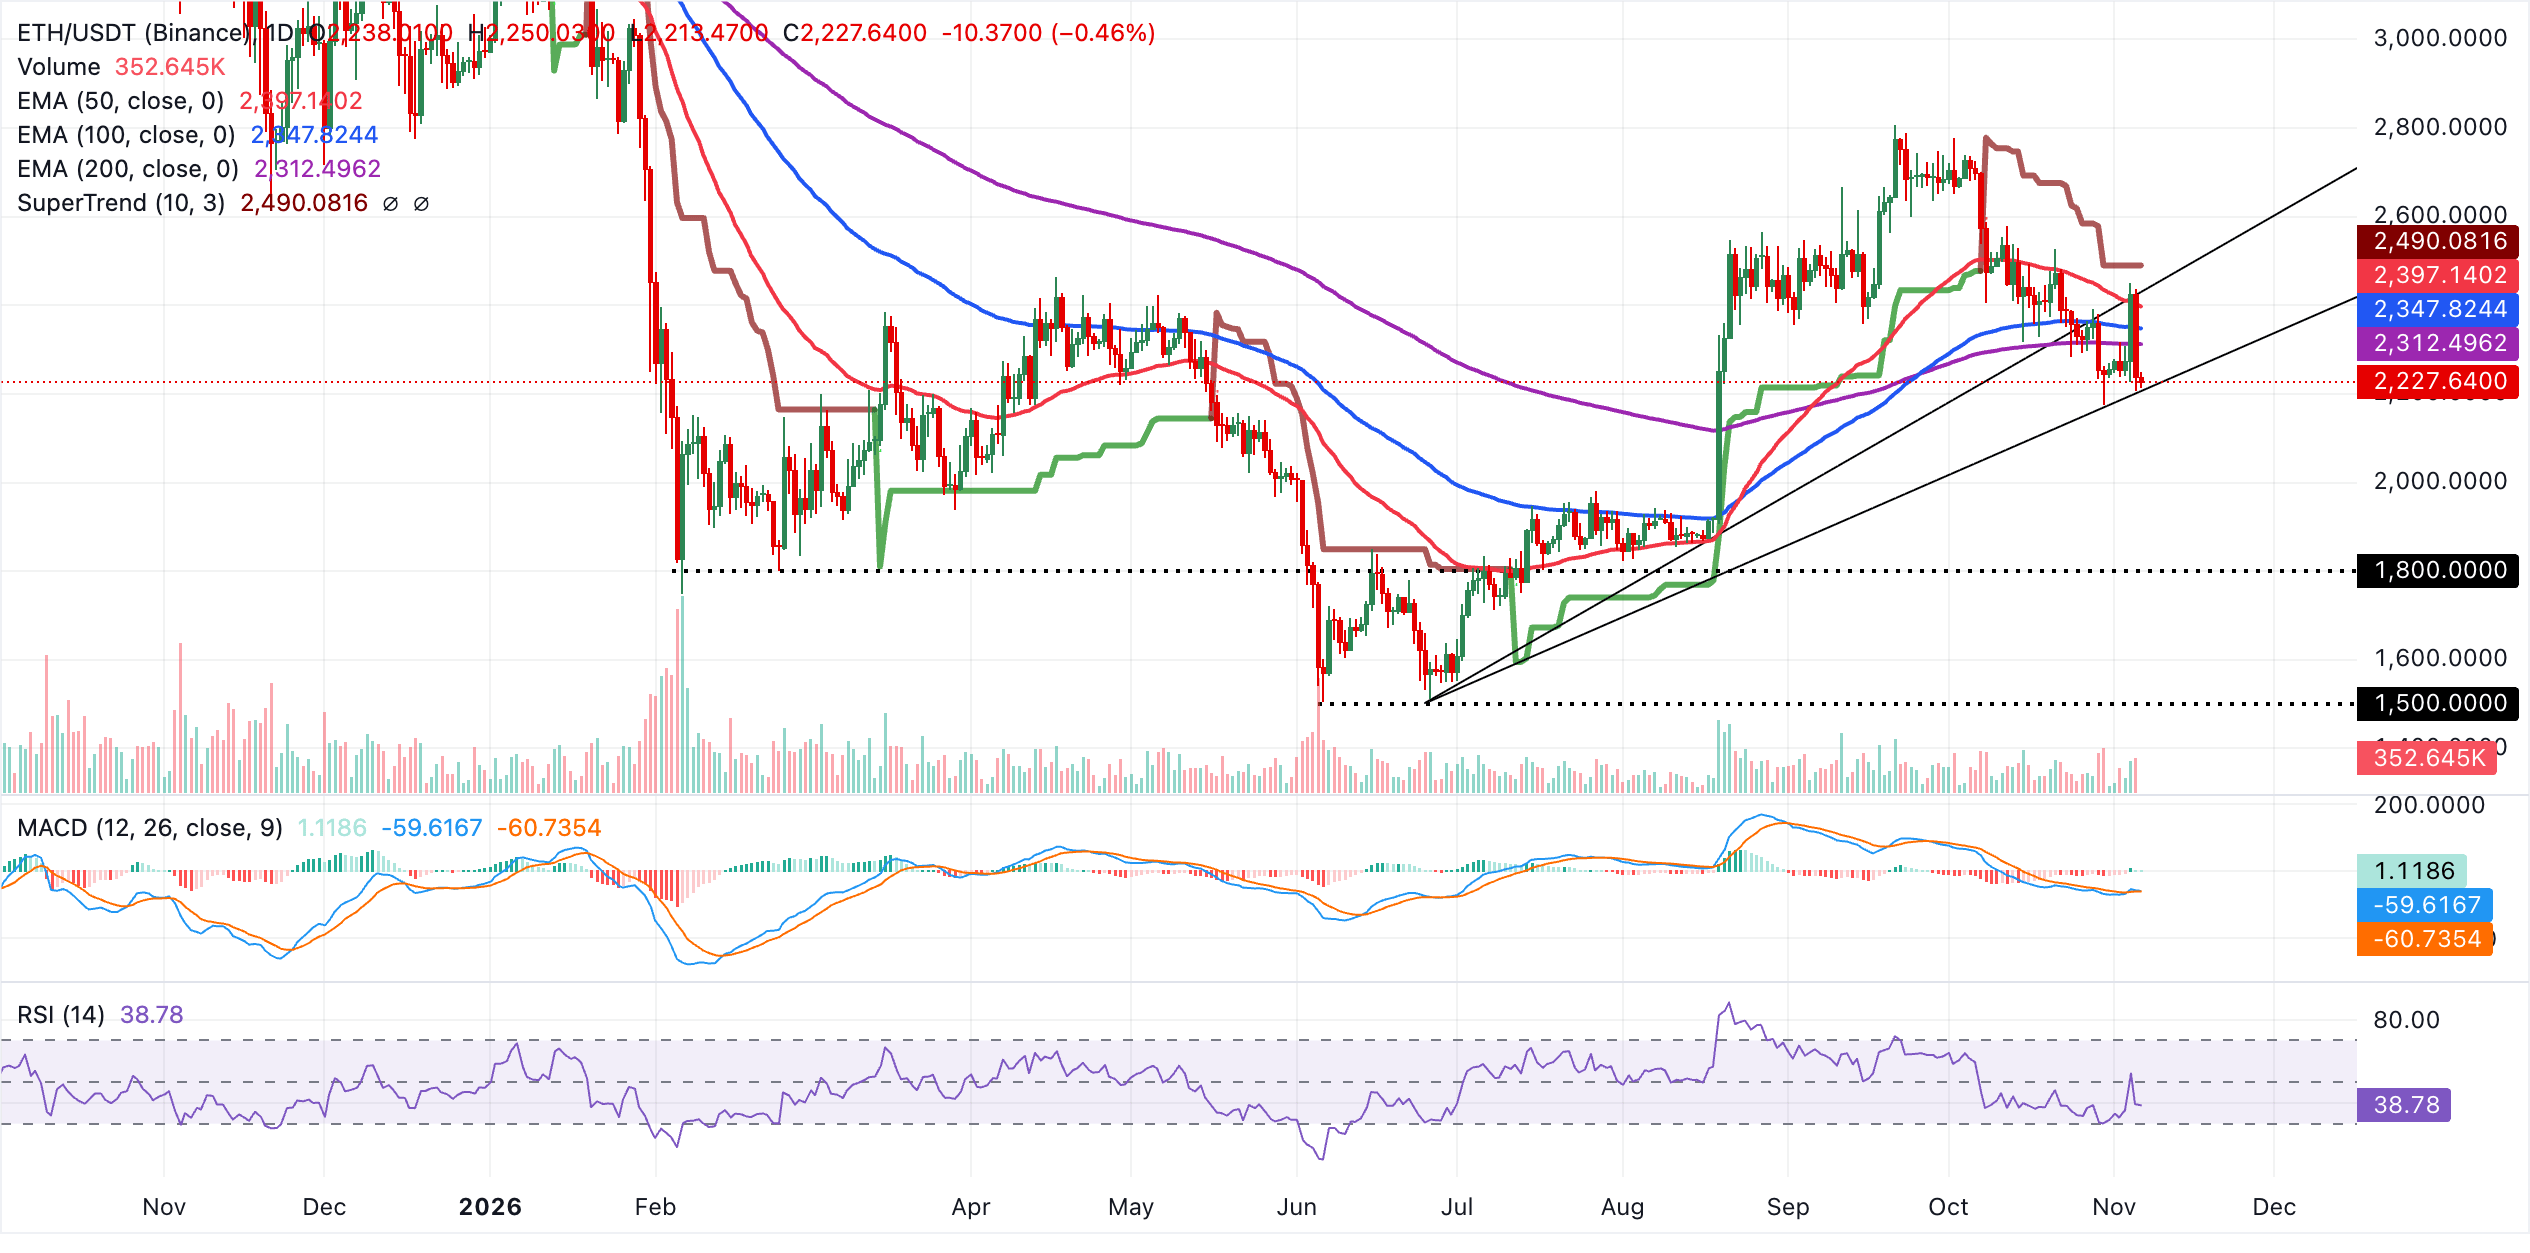
The concentration of buyers at $2,200 offers initial support. Traders are likely to return there to position for another recovery attempt once conditions settle. A break below could force Ethereum to look for liquidity towards $2,000. For a recovery, the 200-day EMA at $2,312 presents the first short-term hurdle. The 100-day EMA at $2,348 and the 50-day EMA at $2,397 follow. Closing a daily session above this group of moving averages would indicate a potential bullish reversal.
Below $1.20: XRP technical correction continues
Below $1.20, XRP retains a bearish short-term outlook. It sits beneath key moving averages and in the lower half of the Bollinger Bands. Despite a modest improvement over recent sessions, upside remains constrained by the 50-day, 100-day and 200-day EMAs. These are grouped roughly between $1.32 and $1.36, well above the spot price.
Even with the sell-off losing pace, momentum remains weak. The RSI is near 35, just above oversold territory, while the MACD line is slightly negative. Both suggest that downward pressure has yet to subside.
The lower Bollinger Band near $1.20 provides the first resistance. Should buyers generate a corrective rebound, the middle band around $1.29 would be the next obstacle. Beyond it, the 100-day EMA at $1.32 and the 50-day EMA at $1.33 form a concentrated supply zone. Higher barriers are the 200-day EMA near $1.36 and the upper Bollinger Band around $1.37. With no nearby chart-based support beneath current prices, a decisive break of $1.20 would leave XRP exposed to additional losses.
(The technical analysis of this story was written with the help of an AI tool. Know more.)
FAQs on Bitcoin, altcoins and stablecoins
By market capitalisation, Bitcoin ranks as the largest cryptocurrency. It is a virtual currency created to function as money. No single person, group or entity can control this payment method, removing the need for third-party involvement in financial transactions.
Any cryptocurrency other than Bitcoin is classed as an altcoin. Some also exclude Ethereum, however, on the basis that forks originate from these two cryptocurrencies. Under that interpretation, Litecoin would be the first altcoin: it was forked from the Bitcoin protocol and is therefore an “improved” version of it.
Designed to maintain a stable price, stablecoins are cryptocurrencies backed by reserves of the assets they represent. Each stablecoin is pegged to a commodity or financial instrument, such as the US Dollar (USD), while an algorithm or demand regulates its supply. Their primary purpose is to give investors a route into and out of cryptocurrency trading and investment. They also provide a way to store value, as cryptocurrencies generally experience volatility.
Dividing Bitcoin’s market capitalisation by the combined market capitalisation of all cryptocurrencies gives its dominance ratio. This measure indicates the level of investor interest in Bitcoin. High BTC dominance is typical ahead of and during a bull run, when investors favour relatively stable cryptocurrencies with large market capitalisations, such as Bitcoin. Falling BTC dominance generally signals that investors are shifting capital and/or profits into altcoins in pursuit of greater returns. That rotation usually sparks a surge in altcoin rallies.
POPULAR ARTICLES
1India FX Reserves, USD above expectations ($0B) in October 26: Actual ($717.06B)2US NFP data loom as Australian Dollar tumbles against US Dollar3Euro gains against US Dollar capped by rotation into Dollar cash – ING4$4,100 eludes gold as attention turns to US Nonfarm Payrolls5Weak Eurozone data and BoJ tightening bets lift Japanese Yen, weigh on Euro6Pi Network Price Forecast: PI faces pressure as markets sell off after US midterm elections7Crypto Today: Post-midterm elections rally unwinds as Bitcoin, Ethereum and XRP fall further8Bitcoin and crypto regulation: implications of a Democratic Congress9US midterms: Why wins for Democrats in House and Senate aren’t all bad for crypto

Get Started!
Sign up and access the Global Markets in less than 3 minutes

Connect With Us









Contacts
Phone: +61 2 8036 8388
Fax: +61 2 8036 8388
Email: support@tmgm.com



The information provided on this website is of a general nature only and does not constitute personal financial advice. Before acting on any information on this website, you should consider the suitability of the information in relation to your objectives, financial situation and needs. Investing in CFDs and FX Margin Contracts carries significant risks and is not suitable for all investors. You may lose more than your initial deposit. You do not own, or have, any interest in the underlying asset. We recommend that you seek independent advice and ensure you fully understand the risks involved before trading. It is important that you read and consider the disclosure document before you acquire any product listed on the website. The information and advertisements offered on this website are not intended for use by any person in any country or jurisdiction where such use would be contrary to local laws and regulations. The Products and Services offered on this website are not intended for residents of the United States, Malaysia and Thailand.
TMGM is authorized and regulated in various jurisdictions.
Trademax Australia Limited, trading as TMGM, is regulated by the Australian Securities and Investments Commission (ASIC), AFSL no. 436416 and is located at Level 28, One International Tower, 100 Barangaroo Avenue, 2000 Sydney, NSW Australia.
Email: support@tmgm.com.au
Trademax Global Limited, trading as TMGM, is authorized and regulated by the Vanuatu Financial Services Commission (VFSC), registration number 40356 and registered at 1276, Kumul Highway, Port Vila, Vanuatu, Republic of Vanuatu.
Email: support@tmgm.com
Trademax Global Markets (SE) Limited, trading as TMGM, is authorized and regulated by the Financial Services Authority (FSA) of Seychelles, with license number SD224. The company is registered at Office No 13, Providence Estate ABIS Centre, Mahe, Seychelles.
Email: support@tmgm.com
Trademax Global Markets (International) Pty Ltd, trading as TMGM, is authorized and regulated by the Financial Services Commission, Mauritius (FSC) with license no. GB22201012, and registered at 33, Edith Cavell Street C/o IQ EQ Fund Services (Mauritius) Ltd Port Louis, 11324 Mauritius.
Email: support@tmgm.com
Copyright © TMGM. All rights reserved