

Trading
Explore a wide range of markets with competitive pricing, deep liquidity, and advanced trading tools.
Learn More 
Platform
Trade seamlessly with TMGM's powerful platform, built for speed, precision, and a superior trading experience.
Learn More Trading Platform
Academy
Learn the fundamentals of trading with beginner-friendly resources, including guides, webinars, and market insights.
Learn More News & Analysis
Get real-time market updates and expert analysis to stay ahead of trading opportunities
Learn More News & Analysis
About
Learn what sets TMGM apart — our global presence, regulatory strength, and commitment to innovation in trading.
Learn More Why Choose TMGM
Sponsorship
Crypto Today: Bitcoin, Ethereum, XRP build on gains as US Dollar falls following Democrats' US midterm win
- Bitcoin has rebounded above $78,000. The Democrats’ US midterm lead sends the US Dollar to a five-week low.
- With broader risk appetite returning on Wednesday, Ethereum edges higher to trade marginally above the 200-day EMA.
- Above $1.28, XRP attracts bulls targeting a near-term break beyond $1.30.
Bitcoin (BTC) is trading above $78,000 on Wednesday. Improving risk appetite across the cryptocurrency market supports the move. Hovering above $2,300, Ethereum (ETH) shares BTC’s recovery outlook. Ripple (XRP) is also changing hands above $1.28, extending its gains to two consecutive days.

US midterms support cryptocurrency rebound
Democratic gains in the United States (US) midterm elections form the backdrop to the broader recovery. The party is securing successive victories and advancing towards control of the House. NBC News reports that Democrats have substantially exceeded their 2024 margins, making significant inroads into Republican territory.
At 101.41, the US Dollar Index (DXY) is down 0.45% on the day as midterm results put it under pressure. The fall brings the index into line with a six-month low, suggesting market concern over the election outcome.
Sponsored by Republican lawmakers, the US CLARITY Act did not clear the Senate. A Democratic majority in the House could significantly reduce the bill’s chances of becoming law.
In Tuesday’s ‘Ahead of the Curve’ report, K33 Research analysts said, “Today, the US midterm elections could trigger substantial volatility, with prediction markets assigning a 71% probability to Democrats winning both chambers,” adding, “This combination of thin liquidity and elevated leverage increases the risk of sharp price swings once market activity picks up following the election.”
$78,448: Bitcoin recovery gathers momentum, technical analysis shows
At $78,448, Bitcoin retains a bullish near-term bias. Supporting that outlook are the 100-day and 200-day Exponential Moving Averages (EMAs) at $77,806 and $76,558, respectively, alongside rising trendline support running from $71,126 to $75,650. The price nevertheless remains below the 50-day EMA at $80,067 and the SuperTrend line at $82,920. These barriers suggest consolidation within the continuing uptrend.
With the Relative Strength Index (RSI) near 43 and the Moving Average Convergence Divergence (MACD) below zero, momentum signals remain cautious. Further gains could therefore develop gradually, even as the broader structure retains support.
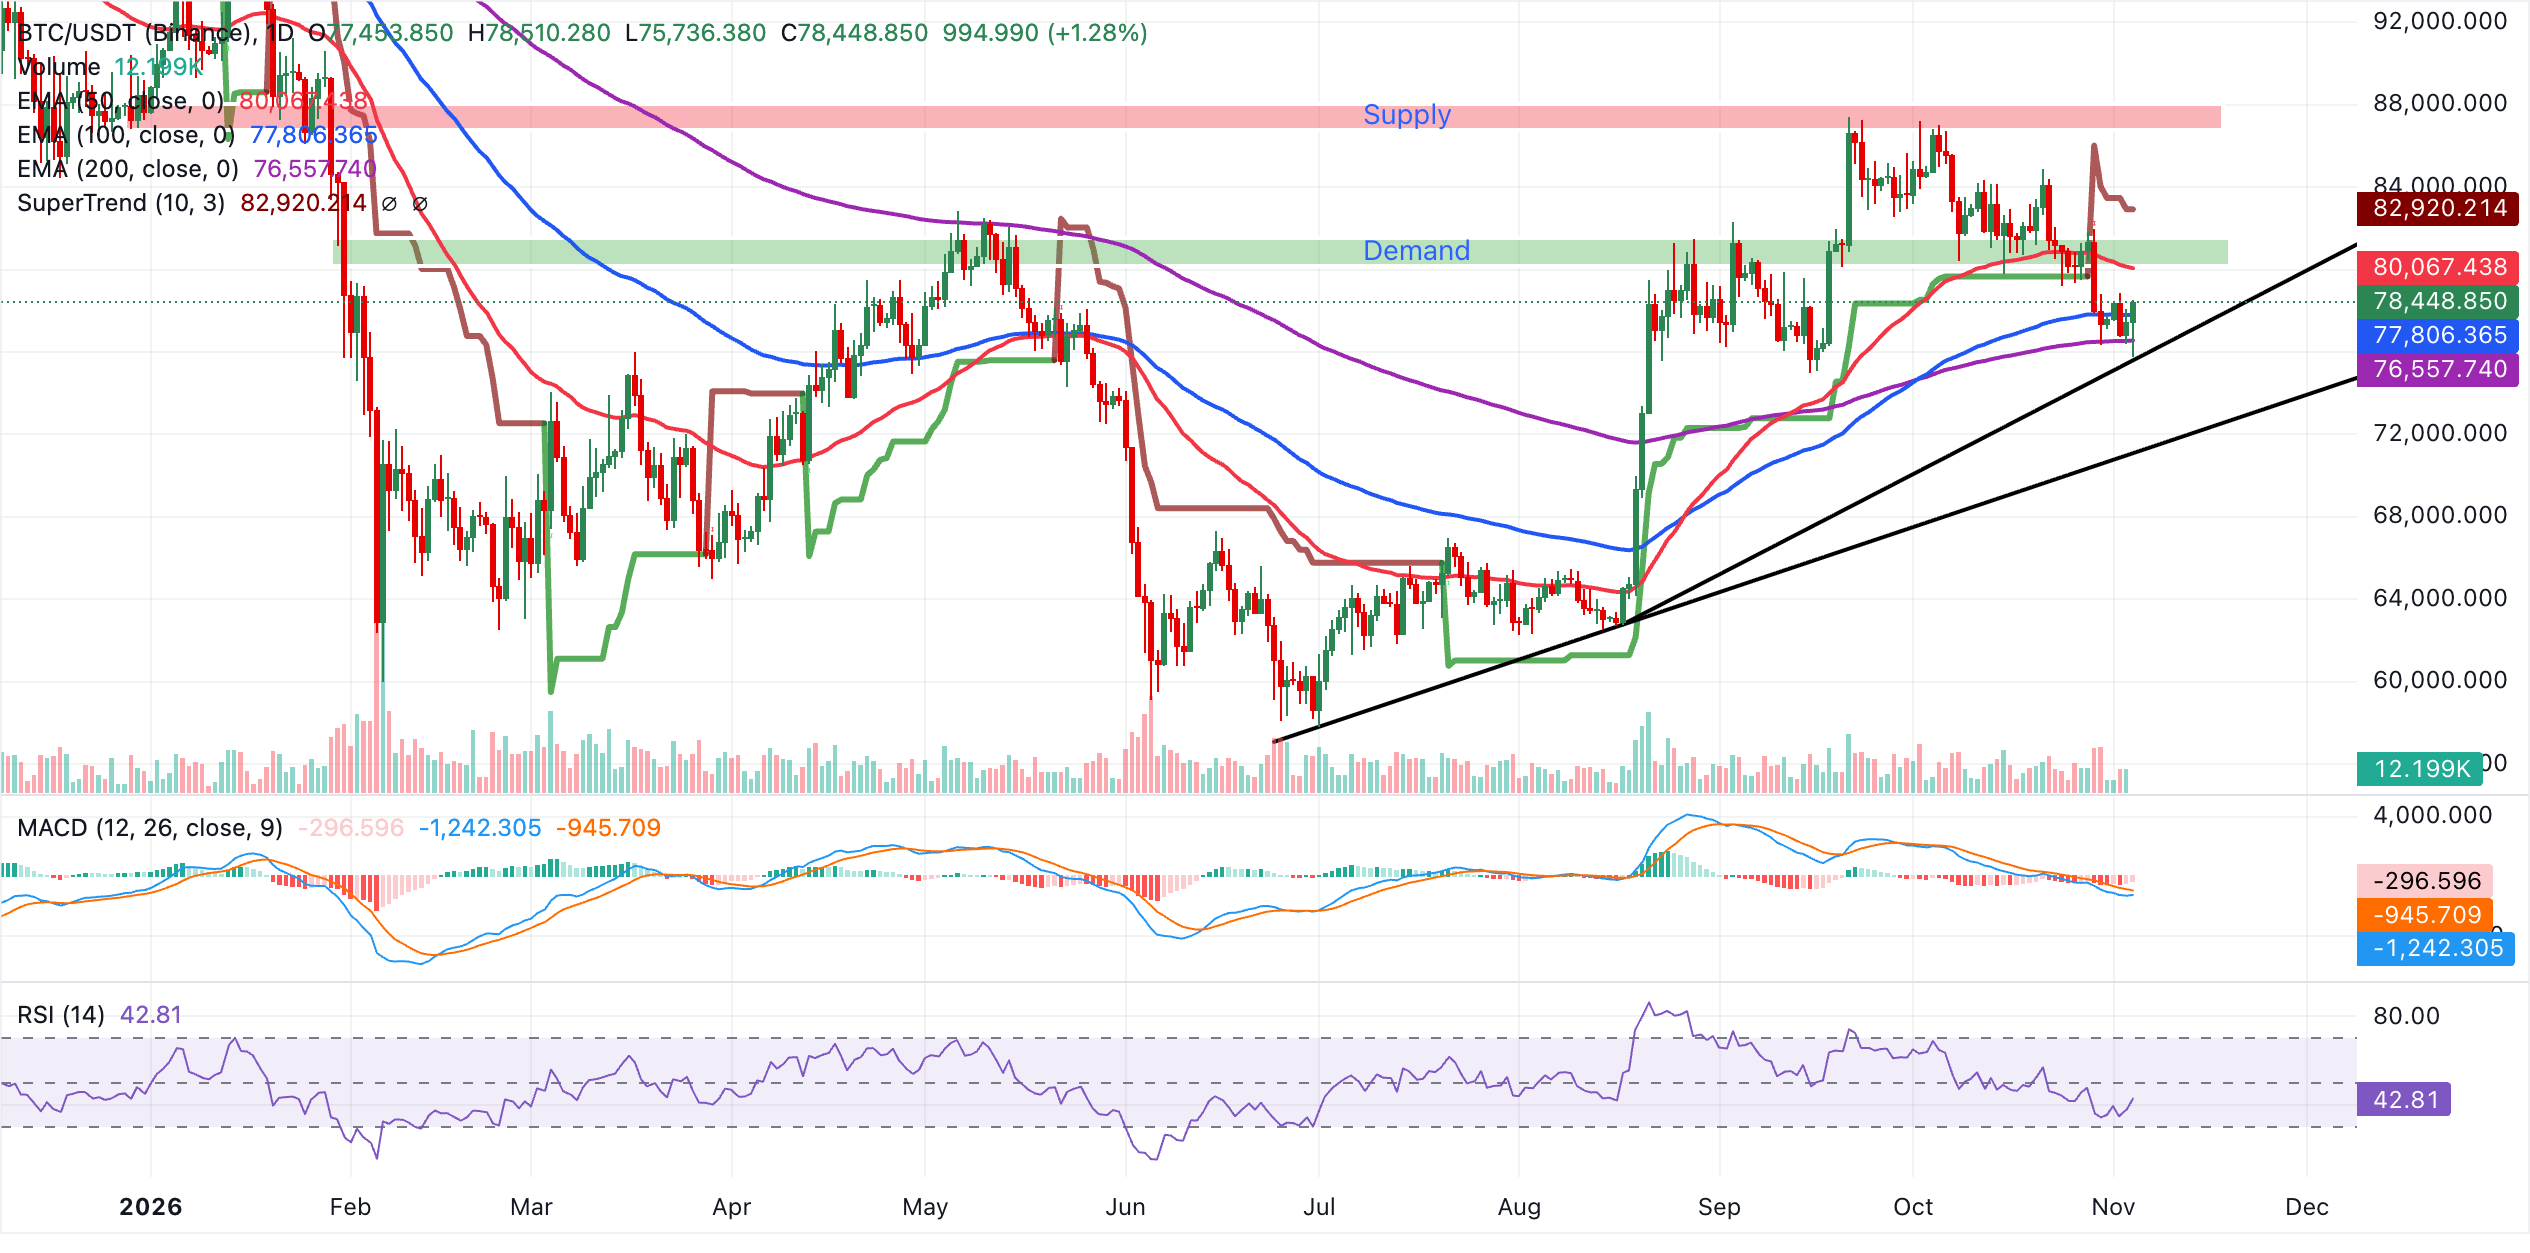
The 50-day EMA at $80,067 presents the nearest resistance, ahead of the SuperTrend hurdle at $82,920. Below the market, the recent pivot area around $78,448 provides the first significant support zone. Stronger demand sits along the short-term rising trendline at $75,650, while the earlier trendline near $71,126 offers deeper structural support. Adding to these layers are the 100-day and 200-day EMAs at $77,806 and $76,558. As long as the price remains above them, the broader bullish structure stays intact.
$2,318: Ethereum targets near-term recovery, technical analysis shows
At $2,318, Ethereum’s near-term bias remains bearish. It sits just above the 200-day EMA at $2,313, but the 100-day EMA at $2,350 continues to cap the price. Further resistance comes from the 50-day EMA at $2,407 and the SuperTrend line at $2,490. This layered overhead structure persists despite the MACD moving into positive territory above zero. An RSI reading of 43 still signals muted momentum.
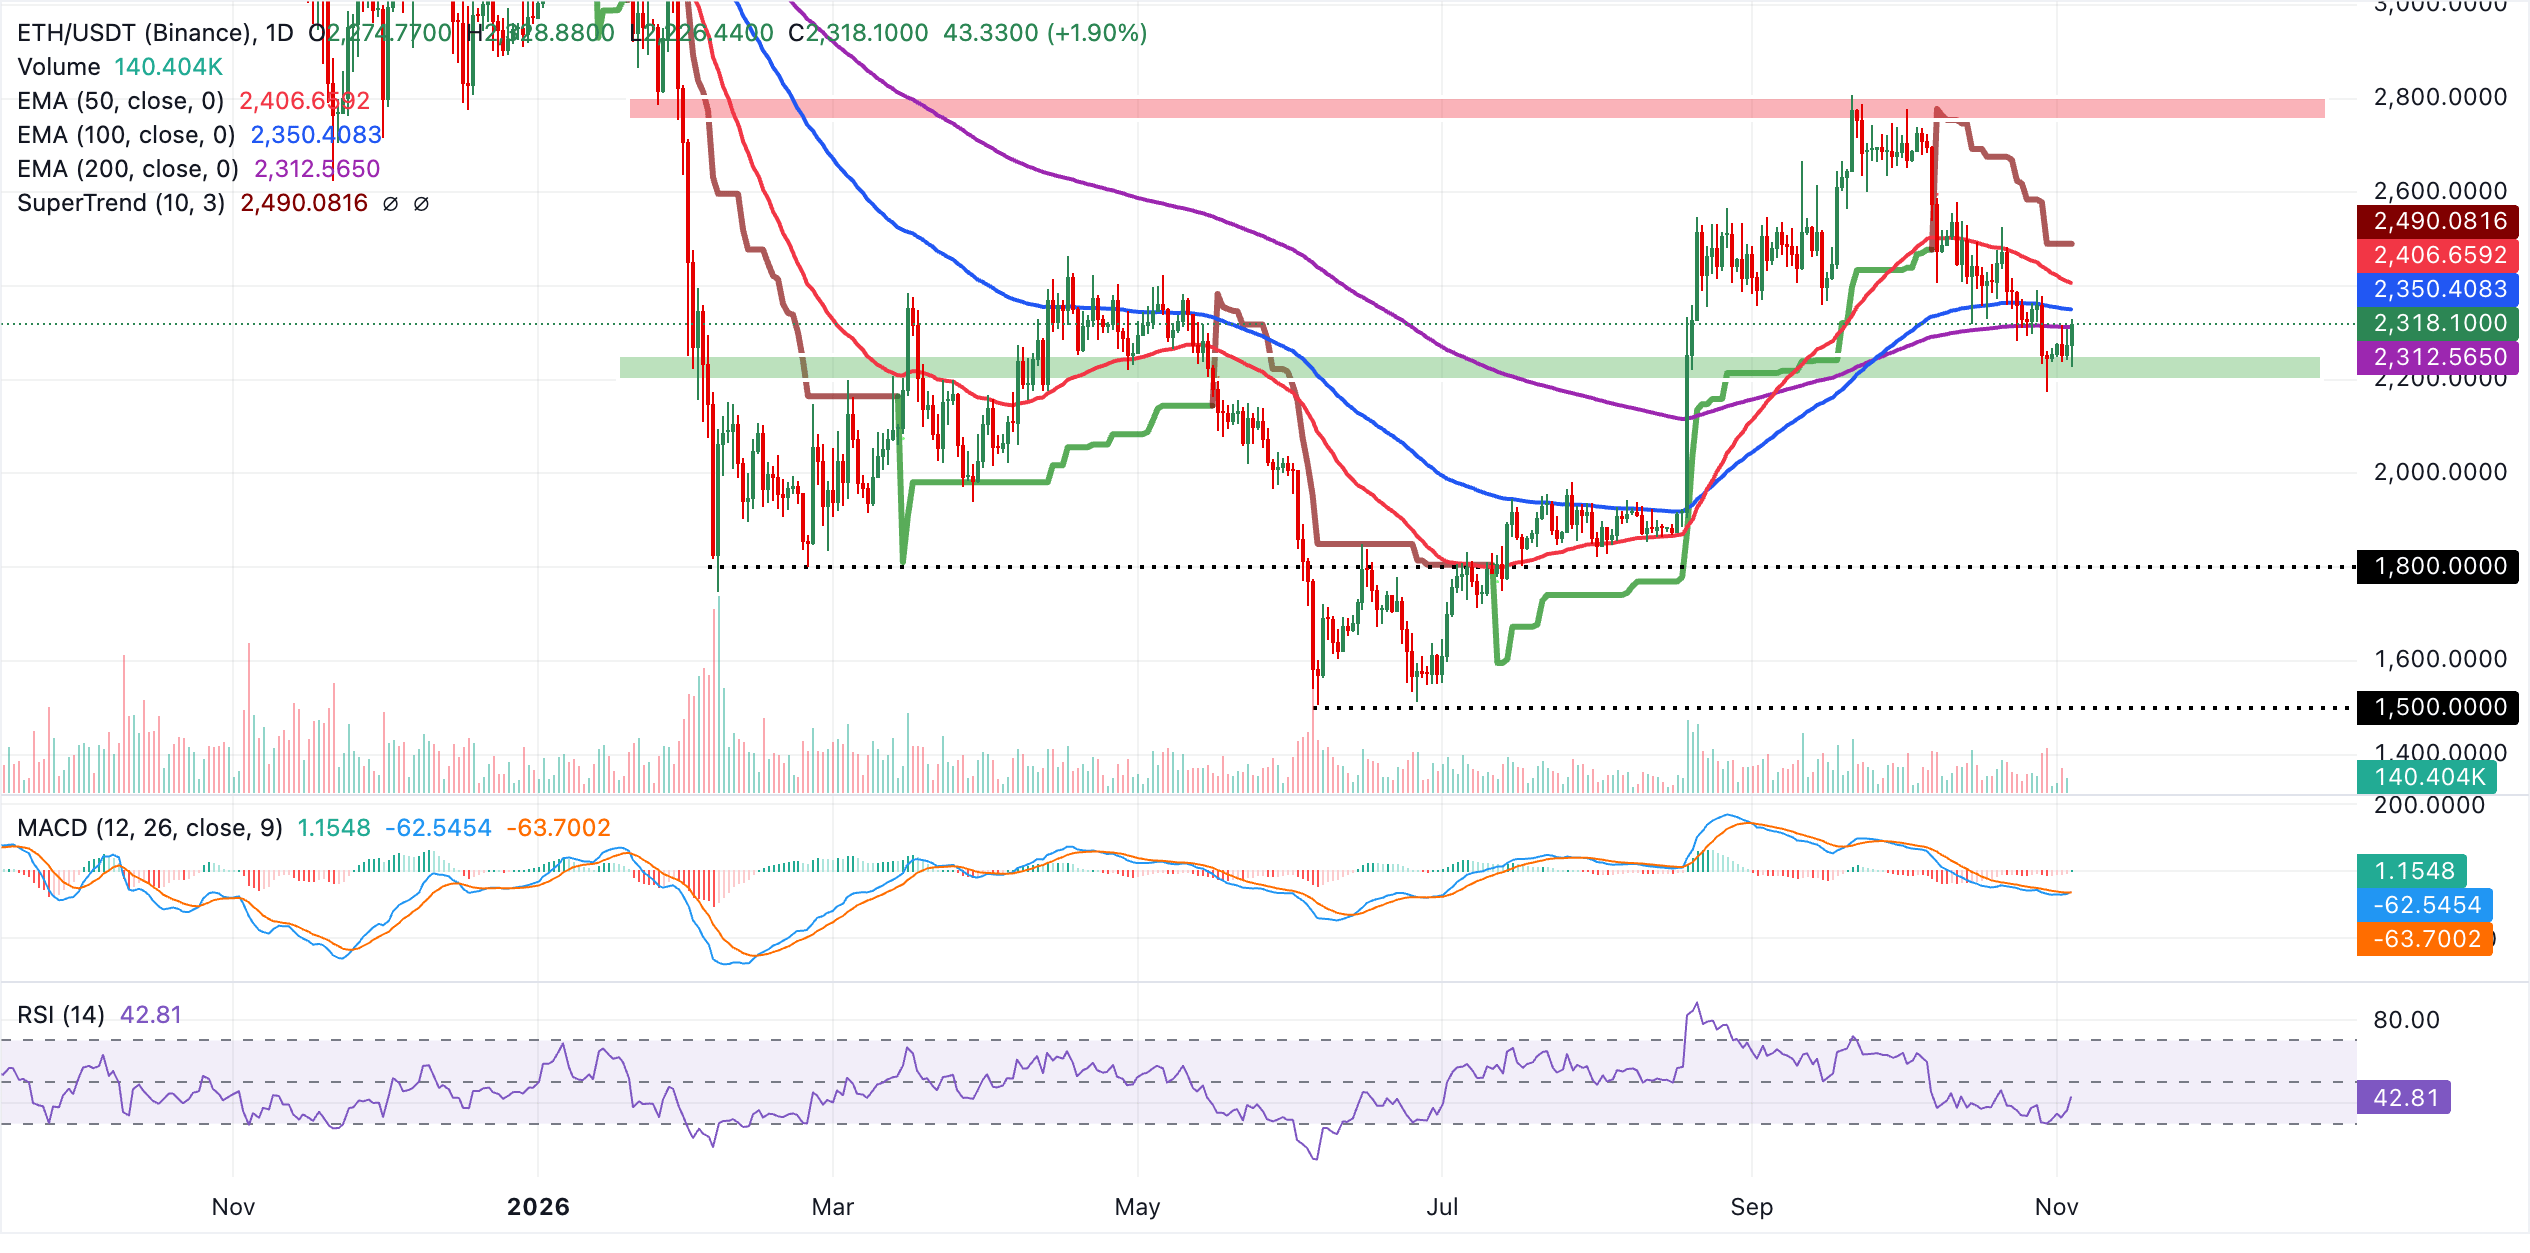
The first upside hurdle is the 100-day EMA near $2,350. Beyond it lie the 50-day EMA around $2,407 and stronger resistance at the SuperTrend level near $2,490. The 200-day EMA at roughly $2,313 supplies immediate downside support. Losing that floor on a sustained basis would likely open the way to lower levels again. To reduce the current bearish bias, Ethereum would need a daily close back above the cluster of moving-average resistance levels.
$1.28: XRP edges higher as bulls re-enter, technical analysis shows
At $1.28, XRP remains below its key moving averages, leaving the near-term bias bearish. Overhead resistance starts with the 100-day EMA at $1.32 and the 50-day EMA at $1.34, with the 200-day EMA at $1.37 adding to supply. Spot prices also sit below the Bollinger Bands’ middle band at $1.29, indicating a downside bias. Although the MACD is slightly positive and the RSI is neutral near 43, their combined signals point to only limited recovery potential for now.
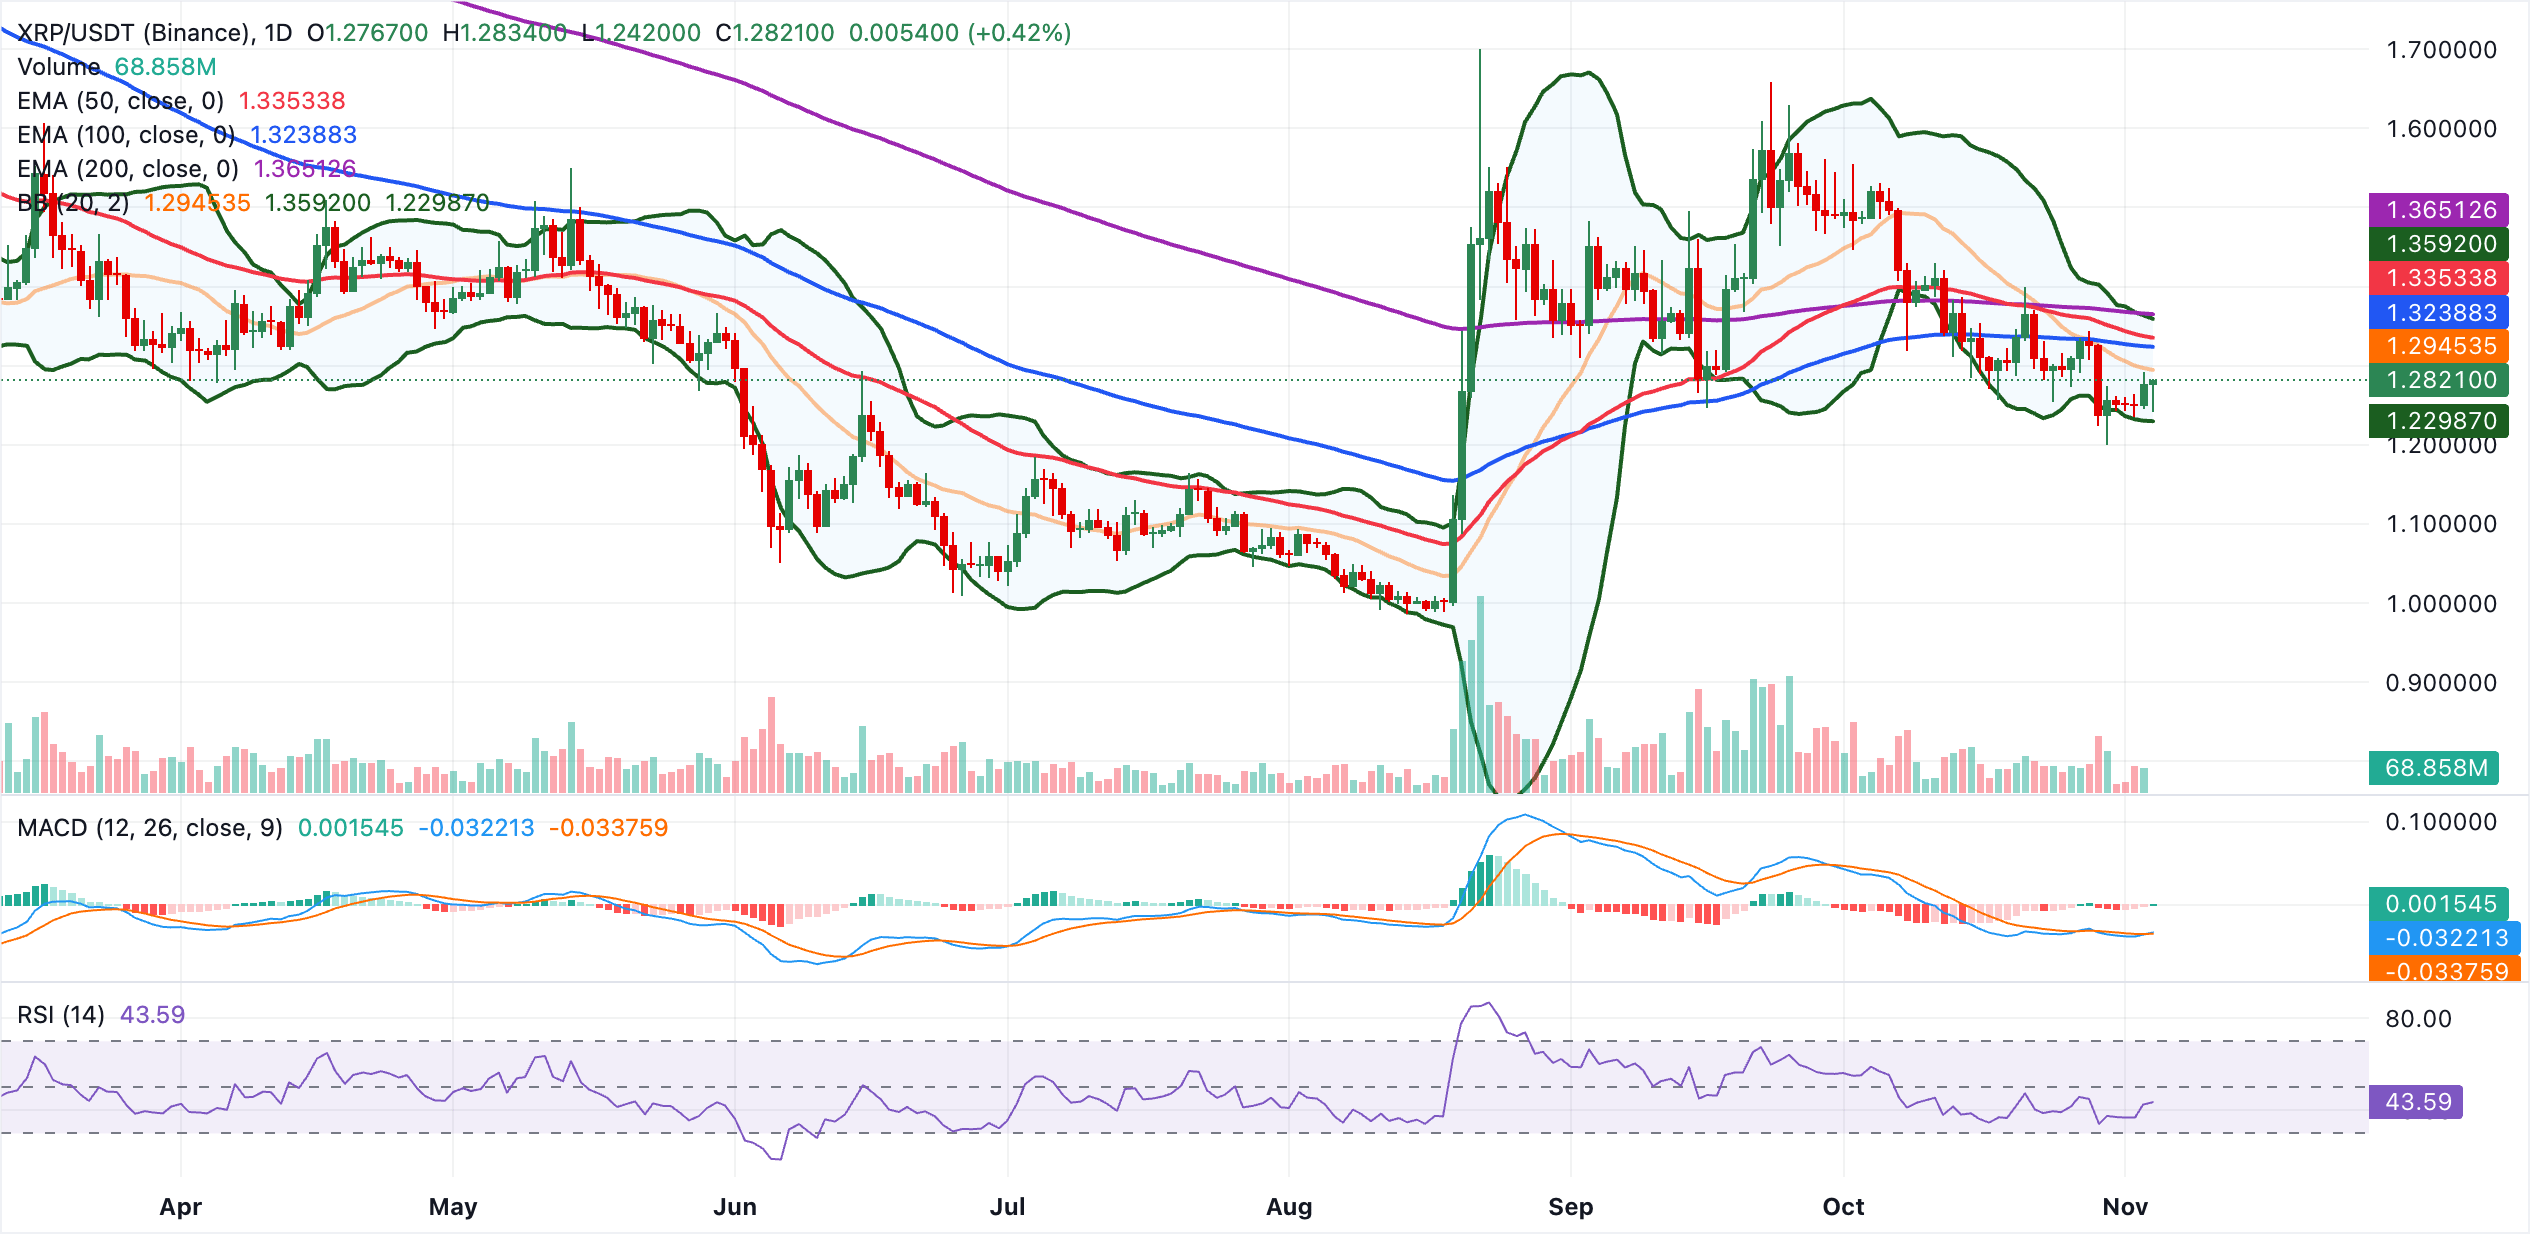
The Bollinger middle band near $1.29 is the first resistance level, ahead of the 100-day EMA at $1.32 and the 50-day EMA at $1.34. Should buyers pursue a stronger rebound, the Bollinger upper band at $1.36 and the 200-day EMA at $1.37 define a wider supply zone. Immediate structural support, meanwhile, comes from the Bollinger lower band around $1.23. A breach would likely allow a deeper correction. Holding this floor would instead preserve scope for a corrective rebound within the prevailing bearish structure.
FAQs on Bitcoin, altcoins and stablecoins
By market capitalisation, Bitcoin is the largest cryptocurrency. It is a virtual currency created to function as money. No single person, group or entity can control this payment method, removing the need for third-party involvement in financial transactions.
Any cryptocurrency other than Bitcoin is classed as an altcoin. Some, however, also exclude Ethereum because these two cryptocurrencies are the origins of forks. Under that interpretation, Litecoin is the first altcoin: it was forked from the Bitcoin protocol and is therefore an “improved” version of it.
To maintain a stable price, stablecoins use reserves of the assets they represent to back their value. Each stablecoin is pegged to a commodity or financial instrument, such as the US Dollar (USD), while an algorithm or demand regulates its supply. Their primary purpose is to give investors a route into and out of cryptocurrency trading and investment. They also offer a way to store value, given the volatility generally associated with cryptocurrencies.
The ratio of Bitcoin’s market capitalisation to the combined market capitalisation of all cryptocurrencies is known as Bitcoin dominance. This measure gives a clear view of investor interest in Bitcoin. BTC dominance is typically high before and during a bull run, when investors favour relatively stable, large-cap cryptocurrencies such as Bitcoin. Falling BTC dominance usually signals a transfer of capital and/or profits into altcoins in pursuit of higher returns. That shift often triggers a surge in altcoin rallies.
(The technical analysis of this story was written with the help of an AI tool. Know more.)
POPULAR ARTICLES
1European Central Bank: Nordea sees a gradual path to tighter policy2Japanese Yen lags peers despite post-election decline in US Dollar3South African Rand: Commerzbank flags political risks to outlook4US Dollar: Macro Drivers Guide Trading – ING50.8350: EUR/GBP Price Forecast as Euro Wavers Amid Pound Strength6Japanese Yen: Focus on structural outflows and intervention – MUFG7Riksbank: Higher policy path amid accelerating inflation – Nomura8$4,000 reclaimed: Gold rebounds as Democrats’ Congress victory unsettles US Dollar9Republicans lose both US Houses as British Pound extends gains


Get Started!
Sign up and access the Global Markets in less than 3 minutes

Connect With Us









Contacts
Phone: +61 2 8036 8388
Fax: +61 2 8036 8388
Email: support@tmgm.com



The information provided on this website is of a general nature only and does not constitute personal financial advice. Before acting on any information on this website, you should consider the suitability of the information in relation to your objectives, financial situation and needs. Investing in CFDs and FX Margin Contracts carries significant risks and is not suitable for all investors. You may lose more than your initial deposit. You do not own, or have, any interest in the underlying asset. We recommend that you seek independent advice and ensure you fully understand the risks involved before trading. It is important that you read and consider the disclosure document before you acquire any product listed on the website. The information and advertisements offered on this website are not intended for use by any person in any country or jurisdiction where such use would be contrary to local laws and regulations. The Products and Services offered on this website are not intended for residents of the United States, Malaysia and Thailand.
TMGM is authorized and regulated in various jurisdictions.
Trademax Australia Limited, trading as TMGM, is regulated by the Australian Securities and Investments Commission (ASIC), AFSL no. 436416 and is located at Level 28, One International Tower, 100 Barangaroo Avenue, 2000 Sydney, NSW Australia.
Email: support@tmgm.com.au
Trademax Global Limited, trading as TMGM, is authorized and regulated by the Vanuatu Financial Services Commission (VFSC), registration number 40356 and registered at 1276, Kumul Highway, Port Vila, Vanuatu, Republic of Vanuatu.
Email: support@tmgm.com
Trademax Global Markets (SE) Limited, trading as TMGM, is authorized and regulated by the Financial Services Authority (FSA) of Seychelles, with license number SD224. The company is registered at Office No 13, Providence Estate ABIS Centre, Mahe, Seychelles.
Email: support@tmgm.com
Trademax Global Markets (International) Pty Ltd, trading as TMGM, is authorized and regulated by the Financial Services Commission, Mauritius (FSC) with license no. GB22201012, and registered at 33, Edith Cavell Street C/o IQ EQ Fund Services (Mauritius) Ltd Port Louis, 11324 Mauritius.
Email: support@tmgm.com
Copyright © TMGM. All rights reserved